

Luminescent Carbon Dots from Wet Olive Pomace: Structural Insights, Photophysical Properties and Cytotoxicity
- PMID: 36235306
- PMCID: PMC9573145
- DOI: 10.3390/molecules27196768
Luminescent Carbon Dots from Wet Olive Pomace: Structural Insights, Photophysical Properties and Cytotoxicity
Abstract
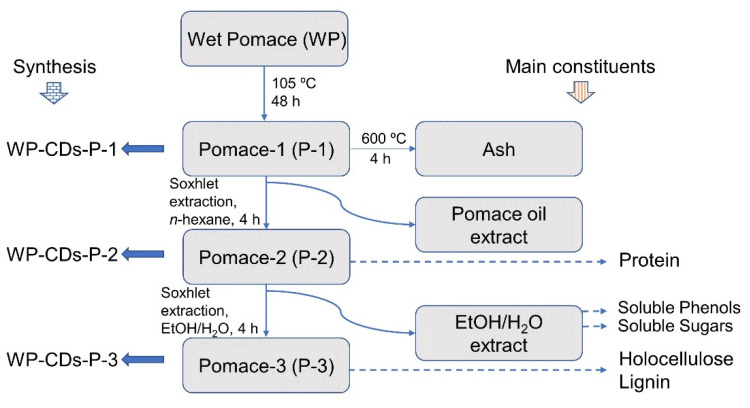
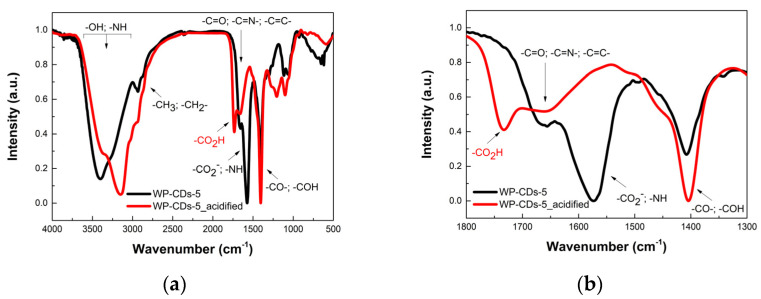
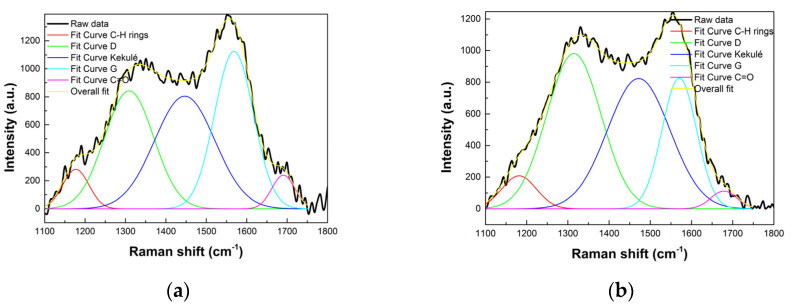
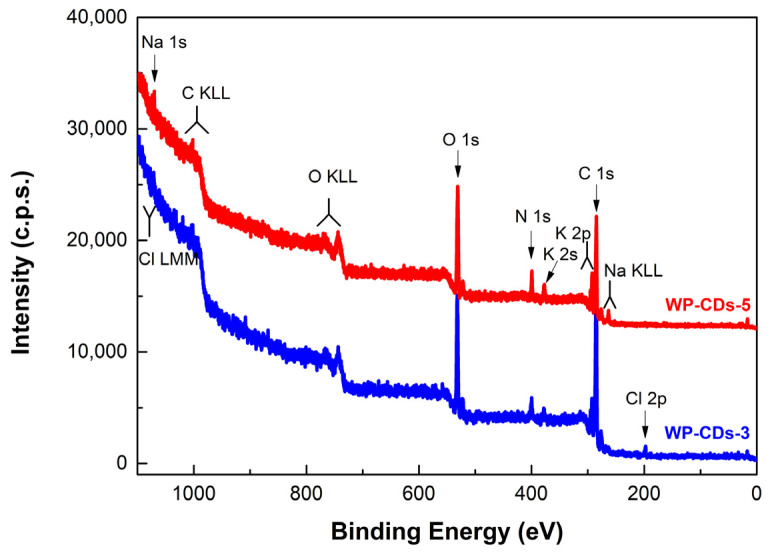
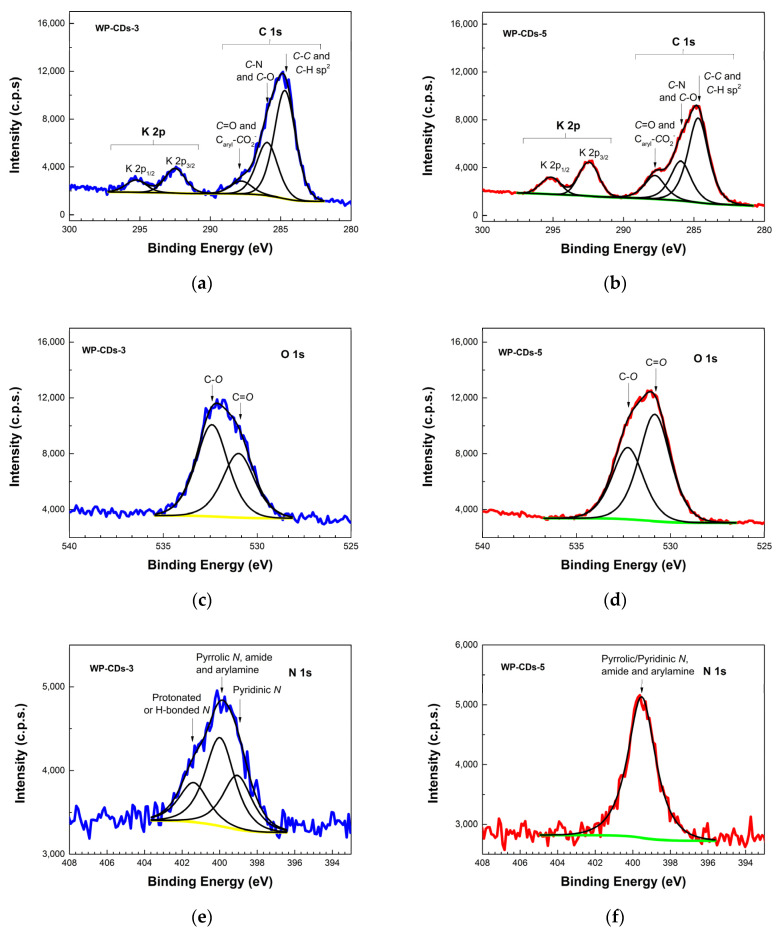
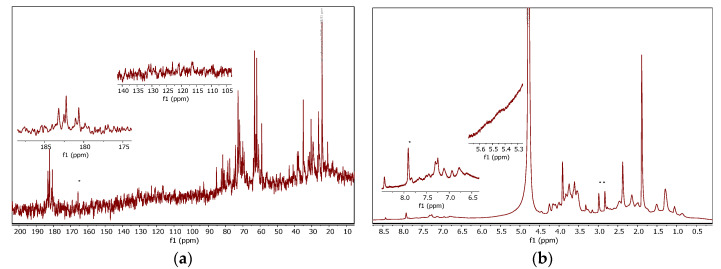
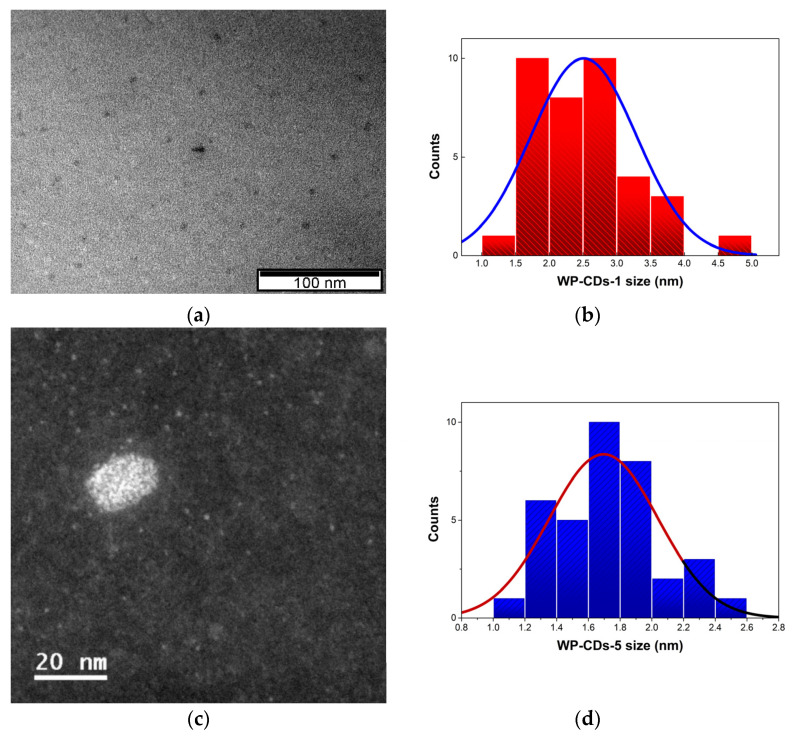
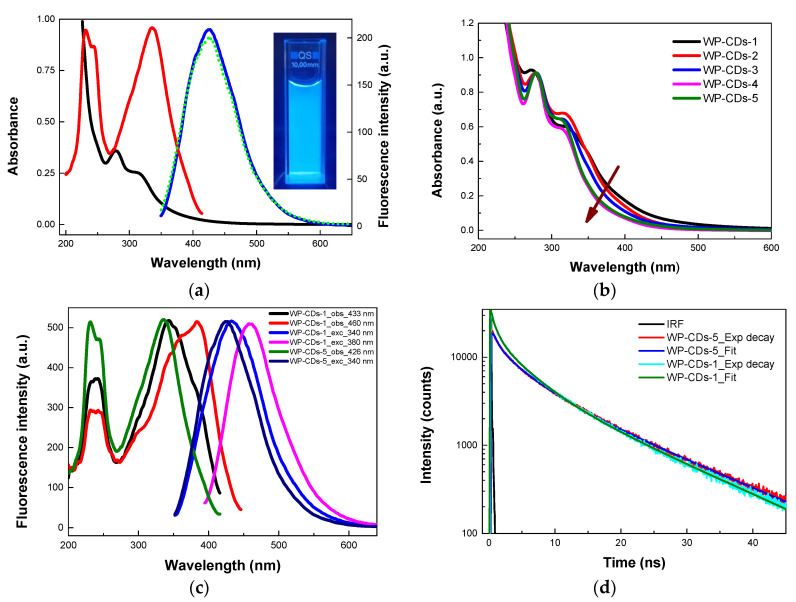
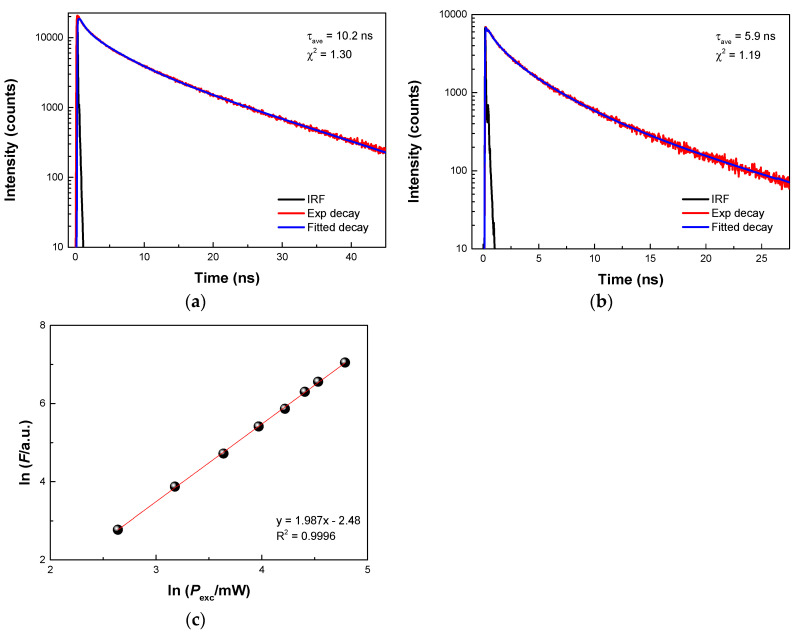
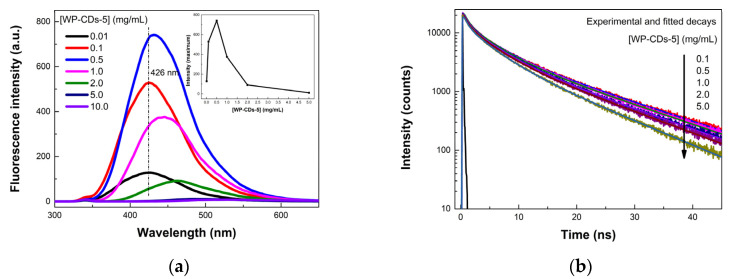
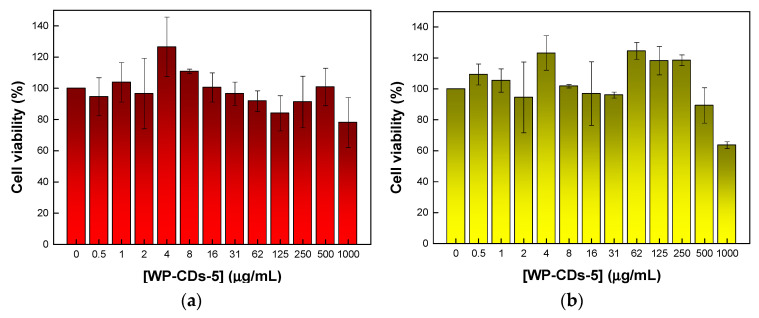
Carbon nanomaterials endowed with significant luminescence have been synthesized for the first time from an abundant, highly localized waste, the wet pomace (WP), a semi-solid by-product of industrial olive oil production. Synthetic efforts were undertaken to outshine the photoluminescence (PL) of carbon nanoparticles through a systematic search of the best reaction conditions to convert the waste biomass, mainly consisting in holocellulose, lignin and proteins, into carbon dots (CDs) by hydrothermal carbonization processes. Blue-emitting CDs with high fluorescence quantum yields were obtained. Using a comprehensive set of spectroscopic tools (FTIR, Raman, XPS, and 1H/13C NMR) in combination with steady-state and time-resolved fluorescence spectroscopy, a rational depiction of WP-CDs structures and their PL properties was reached. WP-CDs show the up-conversion of PL capabilities and negligible cytotoxicity against two mammalian cell lines (L929 and HeLa). Both properties are excellent indicators for their prospective application in biological imaging, biosensing, and dynamic therapies driven by light.
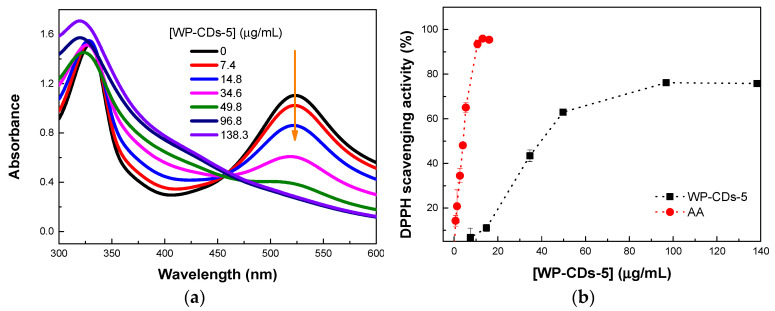
Keywords: antioxidant activity; carbon dots; cytotoxicity; fluorescence; hydrothermal carbonization; olive mill waste; two-photon absorption.
Conflict of interest statement
The authors declare that they have no conflict of interest. The funders had no role in the design of the study; in the collection, analyses, or interpretation of data; in the writing of the manuscript; or in the decision to publish the results.
Figures
Similar articles
-
Solvent-Controlled Synthesis of Highly Luminescent Carbon Dots with a Wide Color Gamut and Narrowed Emission Peak Widths.Small. 2018 May;14(22):e1800612. doi: 10.1002/smll.201800612. Epub 2018 Apr 30. Small. 2018. PMID: 29709104
-
Luminescent carbon dots with concentration-dependent emission in solution and yellow emission in solid state.J Colloid Interface Sci. 2020 Apr 1;565:77-85. doi: 10.1016/j.jcis.2020.01.007. Epub 2020 Jan 7. J Colloid Interface Sci. 2020. PMID: 31935587
-
Carbonized Polymer Dots: A Brand New Perspective to Recognize Luminescent Carbon-Based Nanomaterials.J Phys Chem Lett. 2019 Sep 5;10(17):5182-5188. doi: 10.1021/acs.jpclett.9b01384. Epub 2019 Aug 22. J Phys Chem Lett. 2019. PMID: 31424936
-
The Emerging Development of Multicolor Carbon Dots.Small. 2022 Dec;18(51):e2205099. doi: 10.1002/smll.202205099. Epub 2022 Nov 3. Small. 2022. PMID: 36328736 Review.
-
Preparation, Properties, and Application of Lignocellulosic-Based Fluorescent Carbon Dots.ChemSusChem. 2022 Apr 22;15(8):e202102486. doi: 10.1002/cssc.202102486. Epub 2022 Feb 23. ChemSusChem. 2022. PMID: 35199466 Review.
References
-
- Tsagaraki E., Lazarides H.N., Petrotos K.B. Olive Mill Wastewater. In: Chapter 8, Oreopoulou V., Russ W., editors. Utilization of By-Products and Treatment of Waste in the Food Industry. Springer; New York, NY, USA: 2007.
-
- International Olive Council World Statistics on Production, Imports, Exports and Consumption. 2022. [(accessed on 20 March 2022)]. Available online: https://www.internationaloliveoil.org/what-we-do/economic-affairs-promot....
MeSH terms
Substances
Grants and funding
LinkOut - more resources
Full Text Sources
