. 2022 Sep 26;11(19):2511.
doi: 10.3390/plants11192511.

Genome-Wide Identification and Expression Analysis of the Zinc Finger Protein Gene Subfamilies under Drought Stress in Triticum aestivum

Affiliations

Genome-Wide Identification and Expression Analysis of the Zinc Finger Protein Gene Subfamilies under Drought Stress in Triticum aestivum

Zhaoming Wu et al. Plants (Basel). .

Abstract

The zinc finger protein (ZFP) family is one of plants' most diverse family of transcription factors. These proteins with finger-like structural domains have been shown to play a critical role in plant responses to abiotic stresses such as drought. This study aimed to systematically characterize Triticum aestivum ZFPs (TaZFPs) and understand their roles under drought stress. A total of 9 TaC2H2, 38 TaC3HC4, 79 TaCCCH, and 143 TaPHD were identified, which were divided into 4, 7, 12, and 14 distinct subgroups based on their phylogenetic relationships, respectively. Segmental duplication dominated the evolution of four subfamilies and made important contributions to the large-scale amplification of gene families. Syntenic relationships, gene duplications, and Ka/Ks result consistently indicate a potential strong purifying selection on TaZFPs. Additionally, TaZFPs have various abiotic stress-associated cis-acting regulatory elements and have tissue-specific expression patterns showing different responses to drought and heat stress. Therefore, these genes may play multiple functions in plant growth and stress resistance responses. This is the first comprehensive genome-wide analysis of ZFP gene families in T. aestivum to elucidate the basis of their function and resistance mechanisms, providing a reference for precise manipulation of genetic engineering for drought resistance in T. aestivum.

Keywords: Triticum aestivum; abiotic stresses; drought stress; expression pattern; genome-wide identification; zinc finger proteins.


Conflict of interest statement

The authors declare no conflict of interest.

Figures
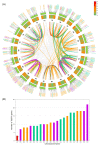
Figure 1
Figure 1
Syntenic relationships, chromosomal localization, and distribution of the TaZFP gene. (A) Red represents TaC2H2; purple represents TaC3HC4; green represents TaCCCH; orange represents TaPHD. The outer rectangles represent chromosomes and show roughly the physical location of the 269 TaZFP genes. The heat map of the middle rectangle indicates the gene density at the corresponding chromosome position; the grey lines in the inner background indicate col-linear blocks of T. aestivum; the other coloured lines indicate segmented repeat gene pairs. Tandem repeat gene pairs are located adjacent to each other and marked. (B) Distribution of the number of TaZFP genes on 21 chromosomes. Chromosomes from subgenomes A, B, and D are indicated in green, orange, and purple, respectively.
Figure 2
Figure 2
Phylogenetic trees of ZFP subfamily genes in T. aestivum, T. dicoccoides, O. sativa, and A. thaliana. (A) C2H2. (B) C3HC4. (C) CCCH. (D) PHD. Each identified subgroup is marked with Roman numerals near the branch. The different colours on the terminal branches represent ZFP genes from different species. The colours of nodes are a mapping of support values from 1000 SH tests.
Figure 2
Figure 2
Phylogenetic trees of ZFP subfamily genes in T. aestivum, T. dicoccoides, O. sativa, and A. thaliana. (A) C2H2. (B) C3HC4. (C) CCCH. (D) PHD. Each identified subgroup is marked with Roman numerals near the branch. The different colours on the terminal branches represent ZFP genes from different species. The colours of nodes are a mapping of support values from 1000 SH tests.
Figure 3
Figure 3
Genome-wide syntenic relationship of TaZFPs orthologous with three representative plants’ viz., (AD) A. thaliana, (EH) O. Sativa, and (IL) T. dicoccoides. The grey line in the background indicates the syntenic region of T. aestivum and other plant genomes. The other coloured lines indicate different gene pairs, the red line indicates the co-linear TaC2H2 gene pair, the purple represents TaC3HC4, the green represents TaCCCH, and the orange represents TaPHD.
Figure 4
Figure 4
The most common cis-acting regulatory elements of the different TaZFP subfamilies. (A) TaC2H2 (B) TaC3H4 (C) TaCCCH (D)TaPHD.
Figure 5
Figure 5
Gene ontology (GO) enrichment analysis of 269 TaZFPs under drought stress. (A) Top thirty most annotated GO items. (B) The proportion of different GO annotations. The cut-off value is FDR ≤ 0.05 for 501 GO entries. (C) Representative TaZFPs are assigned to categories related to development, stress, and hormone response and regulation. Green circles indicate that the gene does not belong to this category; red circles indicate that the gene belongs to the relevant category; the colour gradient indicates the size of the -Log10 (FDR) value; the size of the circle indicates the number of TaZFPs; the ‘Rich factor’ refers to the number of TaZFPs as a proportion of the total number of genes.
Figure 6
Figure 6
Putative interaction network of TaZFPs in T. aestivum. A total of 366 interactions are shown between 88 TaZFPs. The size of the circle is a mapping of the number of interacting objects. The colour of the circle represents the clustering category to which it belongs.
Figure 7
Figure 7
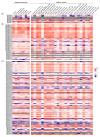
TaZFP gene expression levels heatmap at different treatment times and tissues under drought stress. TPM values were scaled by the logarithm of the base 10 to form the heatmap. (A)TaC2H2 (B) TaC3HC4 (C) TaCCCH (D) TaPHD.
Figure 7
Figure 7
TaZFP gene expression levels heatmap at different treatment times and tissues under drought stress. TPM values were scaled by the logarithm of the base 10 to form the heatmap. (A)TaC2H2 (B) TaC3HC4 (C) TaCCCH (D) TaPHD.
Figure 8
Figure 8
The relative expression levels of TaZFP genes after 3-day (3d) and 6-day (6d) drought treatments were examined by qRT-PCR. The T. aestivum actin gene was used as an internal reference control. Relative expression levels are the mean ± SE of the three samples, with significant differences marked as (*) p < 0.05 and (**) p < 0.01 under the t-test. (A) TaC3HC4 (B) TaCCCH.1 (C) TaCCCH (D) TaPHD.7 (E) TaPHD.11 (F) TaPHD.16 (G) TaPHD.30 (H) Ta PHD.39 (I) Ta PHD.46 (J) Ta PHD.62.

References

    1. Ahuja I., de Vos R.C.H., Bones A.M., Hall R.D. Plant Molecular Stress Responses Face Climate Change. Trends Plant Sci. 2010;15:664–674. doi: 10.1016/j.tplants.2010.08.002. - DOI - PubMed
    1. Miryeganeh M. Plants’ Epigenetic Mechanisms and Abiotic Stress. Genes. 2021;12:1106. doi: 10.3390/genes12081106. - DOI - PMC - PubMed
    1. Rehaman A., Mishra A.K., Ferdose A., Per T.S., Hanief M., Jan A.T., Asgher M. Melatonin in Plant Defense against Abiotic Stress. Forests. 2021;12:1404. doi: 10.3390/f12101404. - DOI
    1. Naeem M., Shahzad K., Saqib S., Shahzad A., Nasrullah, Younas M., Afridi M.I. The Solanum Melongena COP1LIKE Manipulates Fruit Ripening and Flowering Time in Tomato (Solanum lycopersicum) Plant Growth Regul. 2022;96:369–382. doi: 10.1007/s10725-021-00785-7. - DOI
    1. Han G., Qiao Z., Li Y., Yang Z., Wang C., Zhang Y., Liu L., Wang B. RING Zinc Finger Proteins in Plant Abiotic Stress Tolerance. Front. Plant Sci. 2022;13:877011. doi: 10.3389/fpls.2022.877011. - DOI - PMC - PubMed

LinkOut - more resources