. 2022 Oct 10;11(19):2658.
doi: 10.3390/plants11192658.

Photosynthetic Apparatus of Hydrocharis morsus-ranae in Different Solar Lighting

Affiliations

Photosynthetic Apparatus of Hydrocharis morsus-ranae in Different Solar Lighting

Elizabeth Kordyum et al. Plants (Basel). .

Abstract

Hydrocharis morsus-ranae is a free-floating species growing in lakes and slow-flowing rivers near the shore in Europe and Western Asia, and as an invasive plant in the USA and Canada. Light-requiring plants of this species can also grow in the shade, up to about 30% of full sunlight. In this paper we present the data about the photosynthetic apparatus of sunny and shady H. morsus-ranae plants grown in the sun and in the shade in nature. Methods of light and transmission electron microscopy, biochemistry, chlorophyll fluorescence induction as well as the principal component analysis were used. It was found that leaves of plants growing in shade differed from those in the sun with such traits as thickness of a blade, palisade and spongy parenchyma, ultrastructure of chloroplasts, and quantum efficiency of photosynthetic electron transport, the content of chlorophylls and carotenoids, anthocyanins and phenilpropanoids. By these traits, H. morsus-ranae shady plants are similar with shade-bearing plants that indicates their adaptation to light intensity lowering. The ordination plots (PCA) suggested a clear structural and functional shift of plants growing in different lighting showing relationship to light changes in the natural environment. Thus, our results displayed the high phenotypic plasticity of the H. morsus-ranae photosynthetic apparatus, which ensures its acclimation to changing light environment and wide distribution of this species.

Keywords: acclimation; anthocyanin; chlorophyll induction; chloroplast; granum; pigment complex; plasticity; principal component analysis; shade; sunlight.


Conflict of interest statement

The authors declare no conflict of interest.

Figures

Figure 1
Figure 1
Plants of Hydrocharis morsus-ranae in the shade of Phragmites australis (a) and in the sun (b) in the wide part of the arm of the Dnipro River near the Venetian Island.
Figure 2
Figure 2
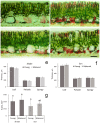
Hand-made cross-sections of Hydrocharis morsus-ranae young (a,b) and mature (c,d) leaves in the shade (a,c) and in the sun (b,d) without staining. Anthocyanin spots are seen in cells of the subepidermal layer of adaxial and abaxial leaf surfaces. Histograms of a leaf blade, palisade and spongy parenchyma thickness (e,f) and area of intercellular spaces (IS) in the spongy parenchyma (g). Different letters on Figure 2g indicate significant difference in IS area (one-way ANOVA, p < 0.05). Scale bar—100 µm.
Figure 3
Figure 3
Fragments of palisade parenchyma cells of mature leaves of Hydrocharis morsus-ranae in the shade (a) and in the sun (bd). Aggregations of chloroplasts, mitochondria and peroxisomes (a,b). Mitochondria and a peroxisome in chloroplasts’ “pockets” (c,d). Abbreviations: Ch–chloroplast, M–mitochondrium, P–peroxisome. Scale bar: (a,c) 0.2 µm, (b,d) 0.5 µm.
Figure 4
Figure 4
General view of chloroplasts (a,c) and chloroplast fragments with grana consisting of different number of thylakoids (b,d) from palisade parenchyma cells of young leaves of Hydrocharis morsus-ranae in the shade (a,b) and in the sun (c,d). Abbreviations: G—granum. Scale bar: (a,c)—1 µm, (b,d)—0.2 nm.
Figure 5
Figure 5
General view of chloroplasts with grana, starch grains and plastoglobules (a,c) and chloroplast fragments with grana consisting of different number of thylakoids (b,d) from palisade parenchyma cells of mature leaves of Hydrocharis morsus-ranae in the shade (a,b) and in the sun (c,d). Abbreviations: SG—starch grain, G—granum, Pl—plastoglobule. Scale bar: (a,c)—1 µm, (b,d)—0.2 nm.
Figure 6
Figure 6
Anthocyanins/chlorophylls (a + b) ratio in young and mature leaves of Hydrocharis morsus-ranae in the different lighting.
Figure 7
Figure 7
Chlorophyll a fluorescence fast induction (OJIP) averaged curves. The curves of 10 leaves for each variant were averaged and normalized to maximum.
Figure 8
Figure 8
Relationship between digital values of leaf color G/B (a ratio of mean values of green to blue) and chlorophylls (a), anthocyanins (b) and ratio of chlorophylls to anthocyanins (c) in young and mature leaves of Hydrocharis morsus-ranae grown in the shade and sun.
Figure 9
Figure 9
Principal component analysis (PCA) biplot of studied photosynthetic traits in leaves of H. morsus-ranae. The loadings of physiological traits are shown with red lines and labelled by green captions. The first principal component (PC1) is mainly associated with Chl (a + b) and Fv/Fm, whereas the second component (PC2) is associated with the content of phenylpropanoids, anthocyanins, and with ϕR0. The locations of leaves in the ordination space are shown by circles filled with different colors, according to the experimental group, as also indicated in the legend: blue circles—mature leaves in the shade; orange—mature leaves in the sun; green—young leaves in the shade; red—young leaves in the sun. The groups are clearly separated on the ordination plot, indicating that they are different by multivariable traits. The leaf groups are separated along with PC1 by their development stage (young and mature ones), and along with PC2 by their lighting conditions (sun and shade ones), which indicates that these factors have different and independent effect on leaves.
Figure 10
Figure 10
K-means clustering of PCA representations of studied leaves of H. morsus-ranae. The leaves were automatically assigned to different clusters (shown in different colors), that are similar to groups by their age and lighting conditions.
Figure 11
Figure 11
Normalized relative light spectrum distribution in shaded vs. open locations. The irradiance spectra were estimated by measurement of sunlight reflected from white etalon placed at the level of leaves.

References

    1. Cook C.D.K., Luond R. A revision of the genus Hydrocharis (Hydrocharitaceae) Aquat. Bot. 1982;14:177–204. doi: 10.1016/0304-3770(82)90097-3. - DOI
    1. Scribailo R.W., Posluszny U. The reproductive biology of Hydrocharis morsus-ranae L. Floral biology. Canad. J. Bot. 1984;62:2779–2787. doi: 10.1139/b84-370. - DOI
    1. Catling P.M., Miltrow G., Haber E., Posluszny U., Charlton W.A. The biology of Canadian weeds Hydrocharis morsus-ranae L. Can. J. Plant Sci. 2003;83:1001–1016. doi: 10.4141/P02-033. - DOI
    1. Toma C. Reproduction of Hydrocharis morsus-ranae taxa in an oxbow lake of the River Vistula. Limnol. Rev. 2013;3:171–179. doi: 10.2478/limre-2013-0019. - DOI
    1. Zhu B., Ottaviani C.C., Naddafi R., Dai Z., Du D. Invasive European frogbit (Hydrocharis morsus-ranae L.) in North America: An updated review 2003–2016. J. Plant Ecol. 2018;11:17–25. doi: 10.1093/jpe/rtx031. - DOI

LinkOut - more resources