. 2022 Oct 7;14(19):4201.
doi: 10.3390/polym14194201.

Knot Factories with Helical Geometry Enhance Knotting and Induce Handedness to Knots

Affiliations

Knot Factories with Helical Geometry Enhance Knotting and Induce Handedness to Knots

Renáta Rusková et al. Polymers (Basel). .

Abstract

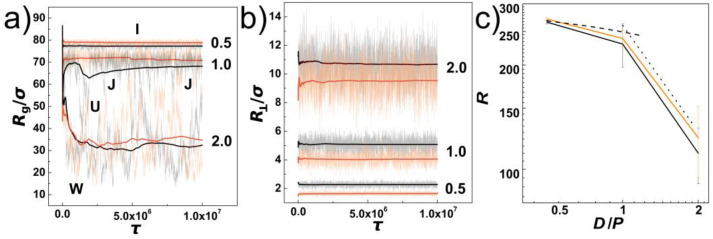
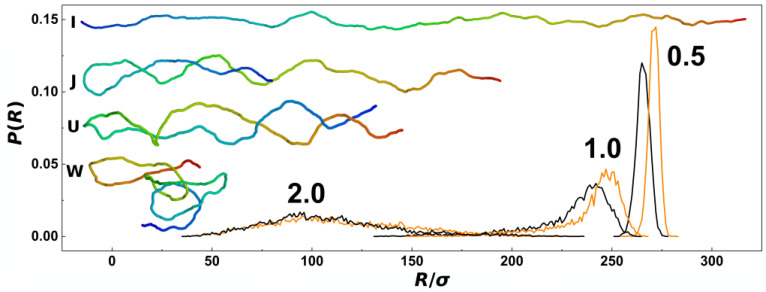
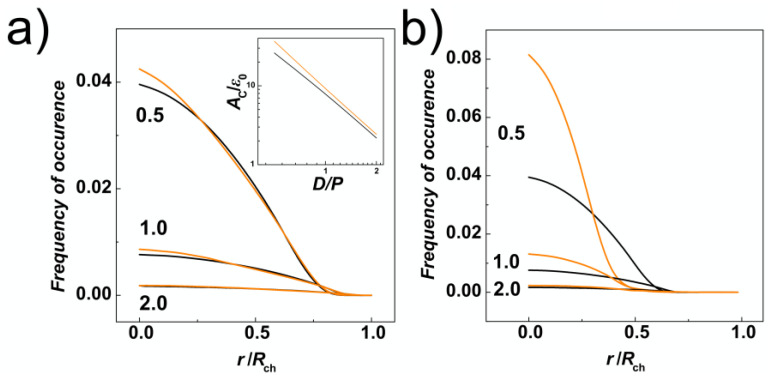
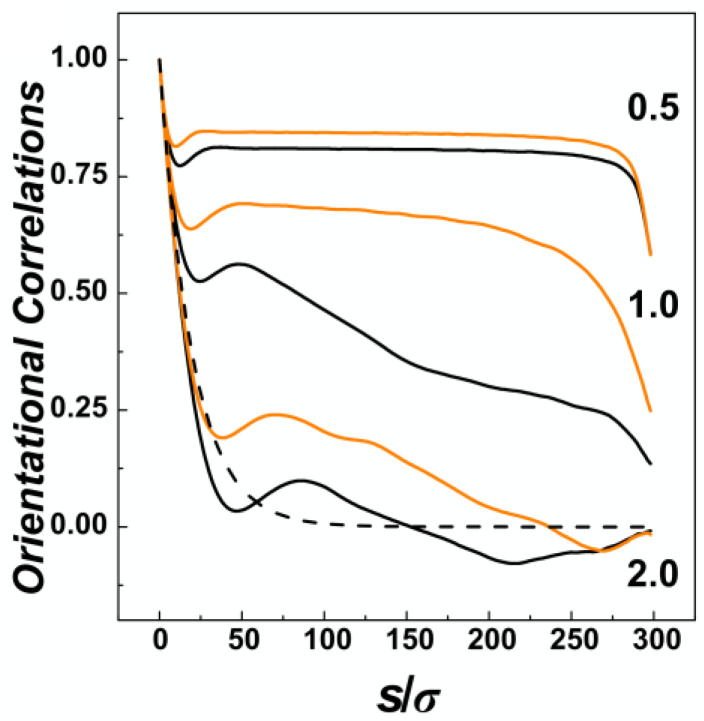
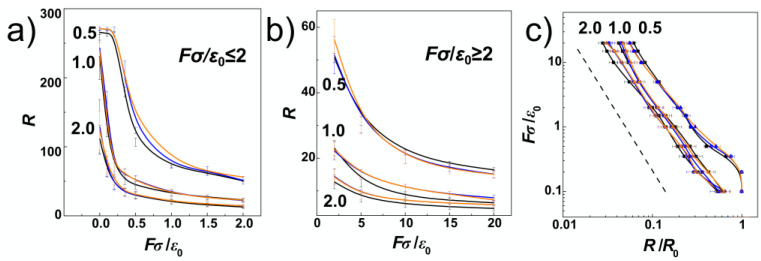
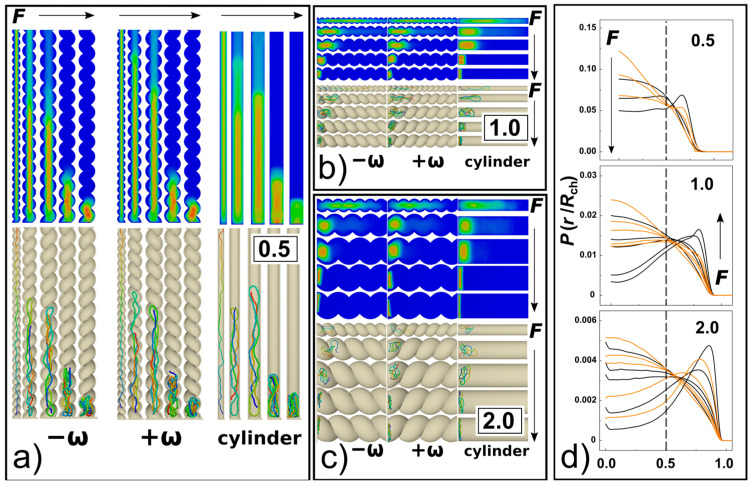
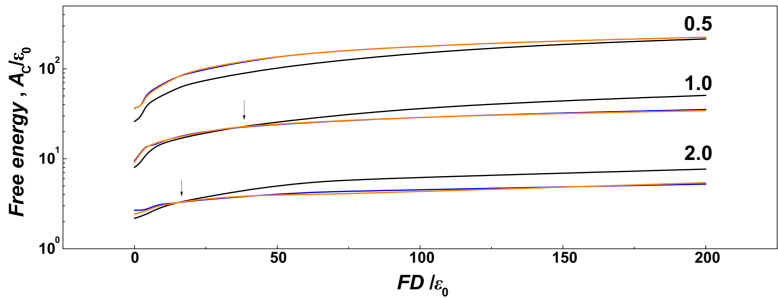
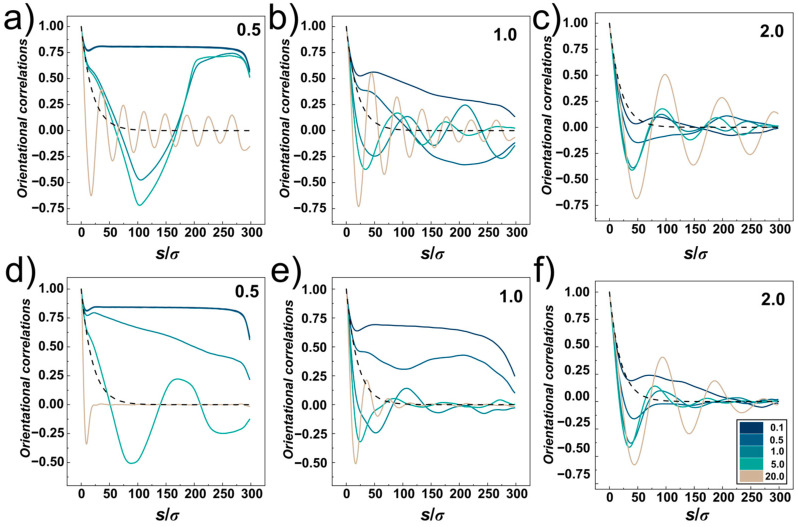
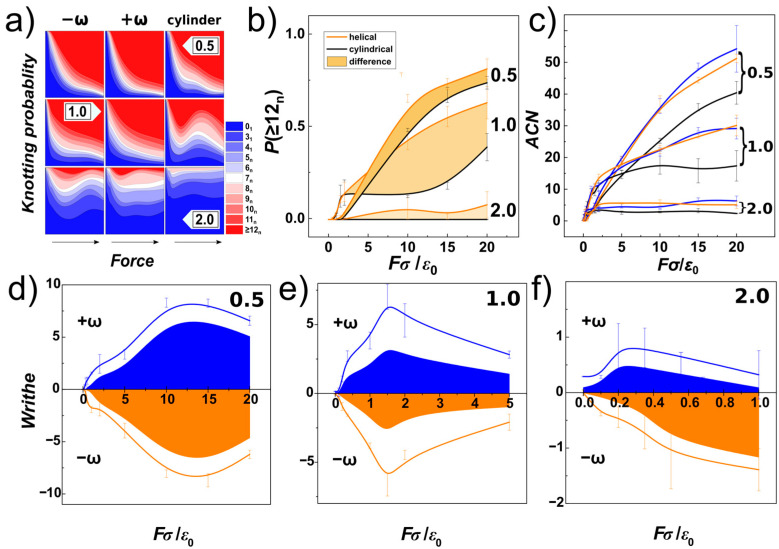
We performed molecular dynamics simulations of DNA polymer chains confined in helical nano-channels under compression in order to explore the potential of knot-factories with helical geometry to produce knots with a preferred handedness. In our simulations, we explore mutual effect of the confinement strength and compressive forces in a range covering weak, intermediate and strong confinement together with weak and strong compressive forces. The results find that while the common metrics of polymer chain in cylindrical and helical channels are very similar, the DNA in helical channels exhibits greatly different topology in terms of chain knottedness, writhe and handedness of knots. The results show that knots with a preferred chirality in terms of average writhe can be produced by using channels with a chosen handedness.

Keywords: DNA; chirality; compression; helical; knot factory; knots; molecular dynamics; nano-channels; polymer; topology.


Conflict of interest statement

The authors declare no conflict of interest.

Figures

Figure 1
Figure 1
DNA confined in nano-channels without external compressive force. Data for cylindrical channels are shown in black and helical channels are in orange. The confinement strengths investigated are indicated by numbers D/P = 0.5, 1.0 and 2.0. Panels (a,b) show evolution of instantaneous values of gyration radius and transversal radius from the initial structure. The letters I, J, U, and W show impressions of DNA conformations. (c) average values of polymer span as a function of confinement strength D/P. The dashed and dotted lines show theoretically predicted values.
Figure 2
Figure 2
Histograms showing probability distributions of DNA span, R, obtained from simulations of DNA confined in nano-channels without external compressive force. The histograms obtained for cylindrical and helical nano-channels are shown in black and orange colours respectively. The panel shows also snapshots of the DNA chain in a rainbow colour scale from simulations for typical conformations represented by simplified impressions using the letters I, J, U and W. The numbers indicate confinement strength indicated as the D/P ratio 0.5, 1.0 and 2.0.
Figure 3
Figure 3
Radial distributions of DNA monomers obtained from simulations of DNA confined in nano-channels without external compressive force and calculated (a) from the centre of the nano-channel and (b) from the major axis of inertia of the channels in normalized radial coordinates, r/Rch. The values computed for cylindrical and helical geometries of the channels are shown in black and orange colours respectively. The numbers indicate regime of the confinement strength expressed as the ratio D/P. The inlay on the panel (a) shows also the dependence of the confinement free energy, AC, obtained as the integral of the monomer concentration on the surface of the channels [29].
Figure 4
Figure 4
The orientational correlation functions along the coarse-grained curvature s/σ of the DNA polymer as obtained from simulations of DNA confined in nano-channels without external compressive force. The values obtained for cylindrical and helical channels are distinguished by black and orange colours and the strength of confinement in terms of the ratio D/P is indicated by number 0.5, 1.0 and 2.0. The the dashed line corresponds to the decay of orientational correlations of unperturbed DNA in the bulk <cosθ> = exp (−s/P) [61].
Figure 5
Figure 5
The evolution of polymer metrics during compression of DNA in helical and cylindrical nano-channels. In the plots, the black lines correspond to cylindrical channels, blue lines and orange lines to helical channels with negative −ω and positive +ω handedness respectively. The regime in terms of confinement strength expressed as the ration D/P = 0.5, 1.0 and 2.0 is indicated by numbers along the computed values of the span. Panels (a,b) show average extension of the DNA, R, for weak /ε0 ≤ 2 and strong /ε0 ≥ 2 compressive forces respectively. (c) Plot shows the extension of the DNA in log-log scale, while the dashed line corresponds to the theoretically predicted relation RFY, where Y = −9/4.
Figure 6
Figure 6
The compression of DNA in helical and cylindrical nano-channels. Panels (ac) show planar projection heatmaps of distributions of DNA monomers across the channel together with snapshots for cylindrical channels and helical channels with negative and positive handedness. F’s with the arrows indicate the direction of increasing force (/ε0 = 0.1, 0.5, 1, 5, 20); (d) the panel shows the radial distribution function of the DNA monomers along the radial coordinate of the channel, for D/P = 0.5 shown with three lines /ε0 = 0.1, 1 and 20; and /ε0 = 0.1, 0.5, 1, 5, 20 for D/P ≥ 1.
Figure 7
Figure 7
The confinement free energy during compression of DNA in helical and cylindrical nano-channels. In the plots, the black lines correspond to cylindrical channels, blue lines and orange lines to helical channels with negative −ω and positive +ω handedness respectively. Graph shows confinement free energy AC, obtained as the integral of the number density of monomers on the surface of the channel in a layer δ = ⅕ σ thick. The regime of the confinement strength is indicated by the numbers along the lines in terms of the ratio D/P = 0.5, 1.0 and 2.0. The arrows indicate where the chain size bias is expected to take place in larger channels.
Figure 8
Figure 8
Orientational correlations as a function of the channel geometry, confinement strength and compressive force. Panels (ac) show orientational correlations for cylindrical channels, and panels (df) show the orientational correlations obtained as average for right-handed and left-handed helical channels. The investigated range of confinement strengths D/P = 0.5, 1.0 and 2.0 is indicated by numbers in the upper right corner of the plots. The data are shown for compressive force /ε0 = 0.1, 0.5, 1, 5 and 20 indicated by the color-scale legend. The dashed line corresponds to the orientational correlations decay in the bulk, given as <cosθ> = exp (−s/P), where s is the coordinate along the chain.
Figure 9
Figure 9
The topology of DNA chain and knots. (a) the graph shows knotting probability in terms of knot types and shown in thermometer colour scale representing knots by their crossing number and indicated by the legend. The knotting probability is shown for different confinement strengths expressed as D/P = 0.5, 1.0 and 2.0 (rows) and different geometries of the channel (columns). The comparison is made for right-handed (+ω) helical channels and left-handed (−ω) channels against cylindrical geometry. The arrow indicates direction of increasing compressive force in the range of /ε0 = <0;20>. (b) the graph shows difference of knotting probability (filled area) in channels with different geometry for knots with complex topology and crossing number above 11 and different confinement strengths D/P indicated by numbers adjacent to the curves. Orange lines correspond to averaged values for helical channels and blue lines correspond to the values obtained in cylindrical channels. (c) Average crossing number for different confinement strengths and geometries of the channel. Panels (df) show the dependence of writhe of the chain (lines) and writhe of the knotted portion (filled areas). The writhe of the chain and the knots obtained in the right-handed helical channels with positive handedness (+ω) is shown in blue and for the left-handed channels with negative handedness (−ω) is shown in orange. The writhe of the chain is investigated for three different confinement strengths indicated in terms of D/P = 0.5, 1.0 and 2.0 in the upper right corner of the plots.

Similar articles

Cited by

References

    1. Amin S., Khorshid A., Zeng L., Zimny P., Reisner W. A Nanofluidic Knot Factory Based on Compression of Single DNA in Nanochannels. Nat. Commun. 2018;9:1506. doi: 10.1038/s41467-018-03901-w. - DOI - PMC - PubMed
    1. Amin S. Knot Formation on Nanochannel-Confined DNA and Flow-Assisted DNA Disentanglement and Linearization. McGill University; Montreal, QC, Canada: 2018.
    1. Khorshid A., Zimny P., Tétreault-La Roche D., Massarelli G., Sakaue T., Reisner W. Dynamic Compression of Single Nanochannel Confined DNA via a Nanodozer Assay. Phys. Rev. Lett. 2014;113:268104. doi: 10.1103/PhysRevLett.113.268104. - DOI - PubMed
    1. Khorshid A., Amin S., Zhang Z., Sakaue T., Reisner W.W. Nonequilibrium Dynamics of Nanochannel Confined DNA. Macromolecules. 2016;49:1933–1940. doi: 10.1021/acs.macromol.5b02240. - DOI
    1. Ma Z., Dorfman K.D. Diffusion of Knots along DNA Confined in Nanochannels. Macromolecules. 2020;53:6461–6468. doi: 10.1021/acs.macromol.0c00561. - DOI

LinkOut - more resources