. 2022 Sep 21;22(19):7138.
doi: 10.3390/s22197138.

Development and Validation of an Algorithm for the Digitization of ECG Paper Images

Affiliations

Development and Validation of an Algorithm for the Digitization of ECG Paper Images

Vincenzo Randazzo et al. Sensors (Basel). .

Abstract

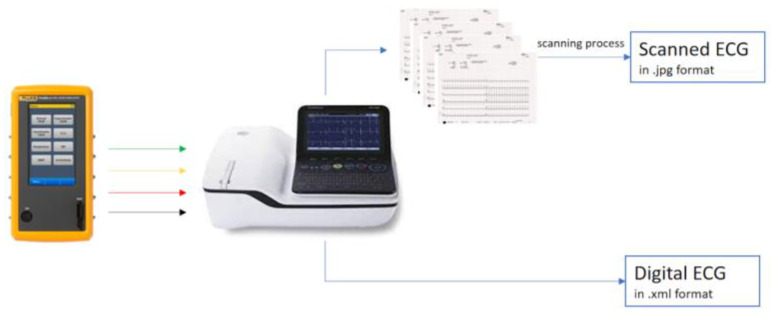
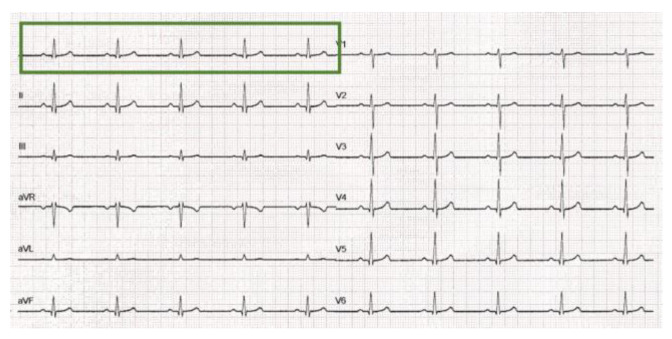
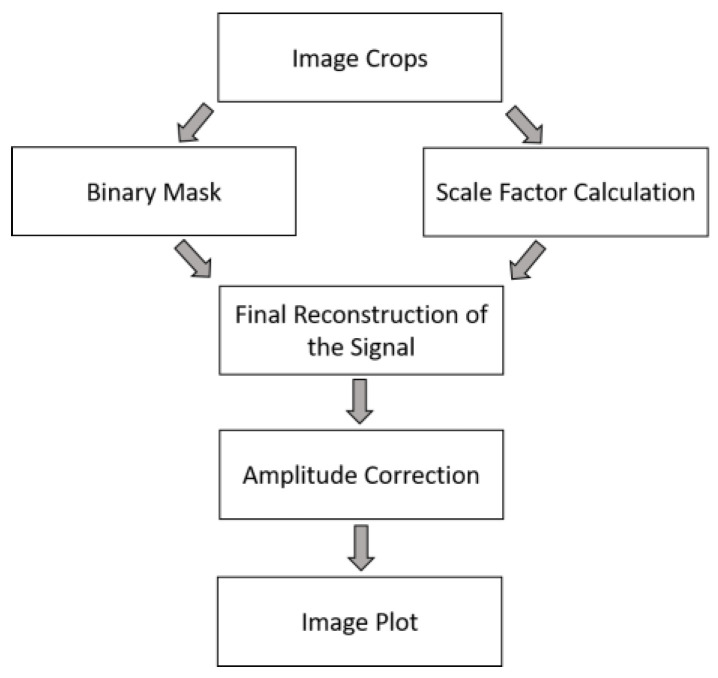
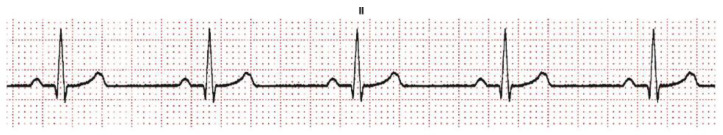
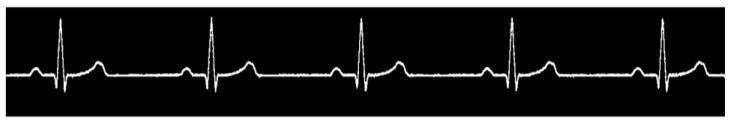
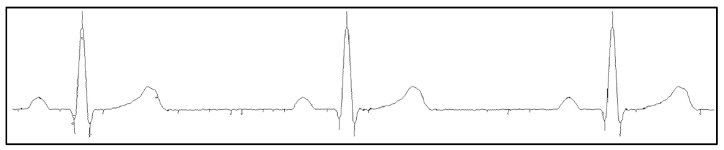
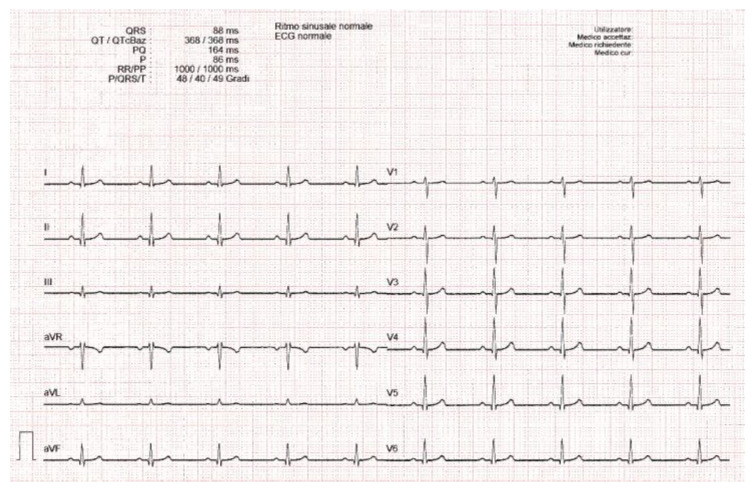
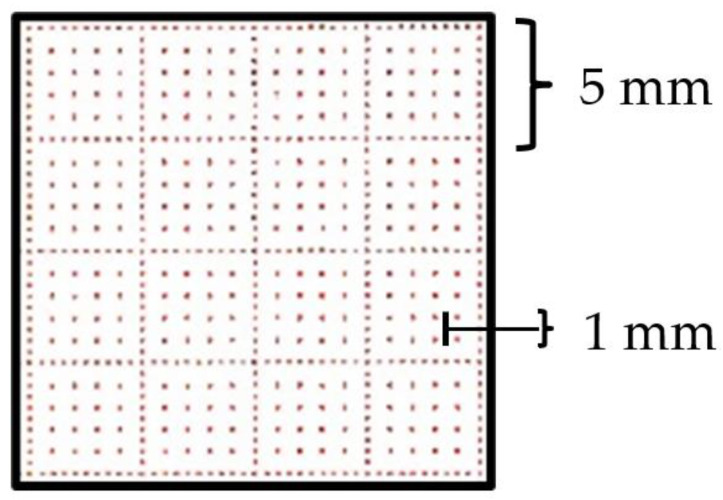
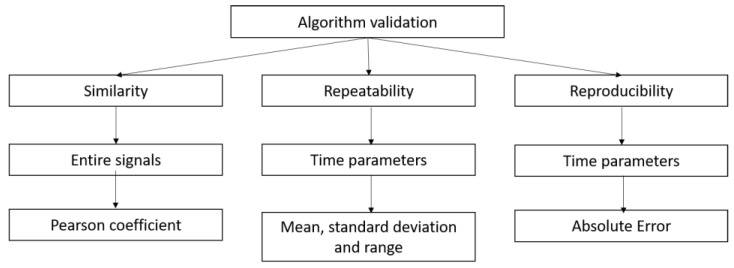
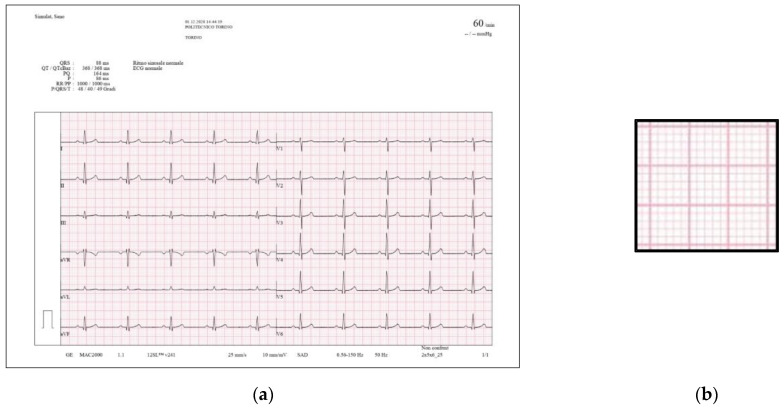
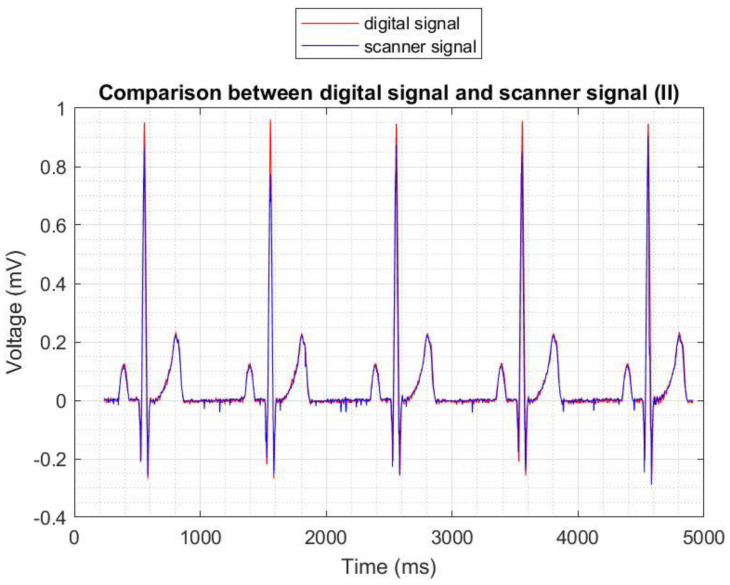
The electrocardiogram (ECG) signal describes the heart's electrical activity, allowing it to detect several health conditions, including cardiac system abnormalities and dysfunctions. Nowadays, most patient medical records are still paper-based, especially those made in past decades. The importance of collecting digitized ECGs is twofold: firstly, all medical applications can be easily implemented with an engineering approach if the ECGs are treated as signals; secondly, paper ECGs can deteriorate over time, therefore a correct evaluation of the patient's clinical evolution is not always guaranteed. The goal of this paper is the realization of an automatic conversion algorithm from paper-based ECGs (images) to digital ECG signals. The algorithm involves a digitization process tested on an image set of 16 subjects, also with pathologies. The quantitative analysis of the digitization method is carried out by evaluating the repeatability and reproducibility of the algorithm. The digitization accuracy is evaluated both on the entire signal and on six ECG time parameters (R-R peak distance, QRS complex duration, QT interval, PQ interval, P-wave duration, and heart rate). Results demonstrate the algorithm efficiency has an average Pearson correlation coefficient of 0.94 and measurement errors of the ECG time parameters are always less than 1 mm. Due to the promising experimental results, the algorithm could be embedded into a graphical interface, becoming a measurement and collection tool for cardiologists.

Keywords: ECG; Pearson’s coefficient measurement; digitization; electrocardiogram; heart pathologies; signals similarity.


Conflict of interest statement

The authors declare no conflict of interest.

Figures

Figure 1
Figure 1
Data acquisition system. The scanning process is done by the Kyocera TASKalfa 5053ci scanner.
Figure 2
Figure 2
ECG of normal sinus rhythm (60 bpm); the green rectangle represents the printed portion of each lead (duration of 5 s). The sensitivity/gain is 10 mm/mV and the paper speed is 25 mm/s.
Figure 3
Figure 3
Automatic algorithm pipeline.
Figure 4
Figure 4
Example of the cropped image for one lead (Normal sinus rhythm, 60 bpm, II lead).
Figure 5
Figure 5
Binary mask of the cropped image (normal sinus rhythm, 60 bpm, II lead).
Figure 6
Figure 6
Thinned signal image (normal sinus rhythm, 60 bpm, II lead).
Figure 7
Figure 7
ECG leads printed on graph paper (normal sinus rhythm, 60 bpm).
Figure 8
Figure 8
Squares in ECG graph paper.
Figure 9
Figure 9
Reconstruction of the squares of the grid; (a) removal of the signal; (b) union of the nearest points; (c) removal of the furthest points; and (d) final squares with 5 mm sides.
Figure 10
Figure 10
Signal reconstruction from pixels to samples (normal sinus rhythm, 60 bpm, II lead).
Figure 11
Figure 11
A portion of the reconstructed ECG signal (normal sinus rhythm, 60 bpm, II lead) with SF application; (a) before the amplitude correction; (b) after the amplitude correction.
Figure 12
Figure 12
Reconstructed ECG signal (normal sinus rhythm, 60 bpm, II lead); (a) both axes are expressed in millimeters; (b) time is converted in milliseconds and voltage in millivolts (final version).
Figure 13
Figure 13
Validation scheme of the algorithm.
Figure 14
Figure 14
Graph paper with another format, used for reproducibility (normal sinus rhythm, 60 bpm); (a) PDF converted to JPEG; (b) structure of the grid.
Figure 15
Figure 15
Comparison between the digitized (blue) and digital (red) signal for lead II (Normal sinus rhythm, 60 bpm).

Similar articles

Cited by

References

    1. Mishra S., Khatwani G., Patil R., Sapariya D., Shah V., Parmar D., Dinesh S., Prathamesh D., Mehendale N. ECG Paper Record Digitization and Diagnosis Using Deep Learning. J. Med. Biol. Eng. 2021;41:422–432. doi: 10.1007/s40846-021-00632-0. - DOI - PMC - PubMed
    1. Cirrincione, Giansalvo, Randazzo V., Pasero E. Neural Approaches to Dynamics of Signal Exchanges. Springer; Singapore: 2020. A neural based comparative analysis for feature ex-traction from ECG signals; pp. 247–256. - DOI
    1. Sannino G., De Pietro G. A Deep Learning Approach for ECG-Based Heartbeat Classification for Arrhythmia Detection. Future Gener. Comput. Syst. 2018;86:446–455. doi: 10.1016/j.future.2018.03.057. - DOI
    1. Badilini F., Erdem T., Zareba W., Moss A.J. ECGScan: A Method for Conversion of Paper Electrocardiographic Printouts to Digital Electrocardiographic Files. J. Electrocardiol. 2005;38:310–318. doi: 10.1016/j.jelectrocard.2005.04.003. - DOI - PubMed
    1. Schimpf R., Wolpert C., Gaita F., Giustetto C., Borggrefe M. Short QT Syndrome. Cardiovasc. Res. 2005;67:357–366. doi: 10.1016/j.cardiores.2005.03.026. - DOI - PubMed

LinkOut - more resources