. 2022 Sep 21;22(19):7148.
doi: 10.3390/s22197148.

Flow-Enhanced Photothermal Spectroscopy

Affiliations

Flow-Enhanced Photothermal Spectroscopy

Ulrich Radeschnig et al. Sensors (Basel). .

Abstract

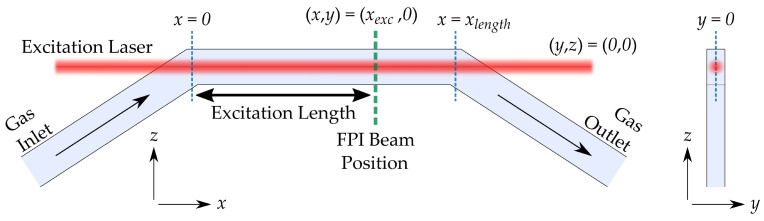
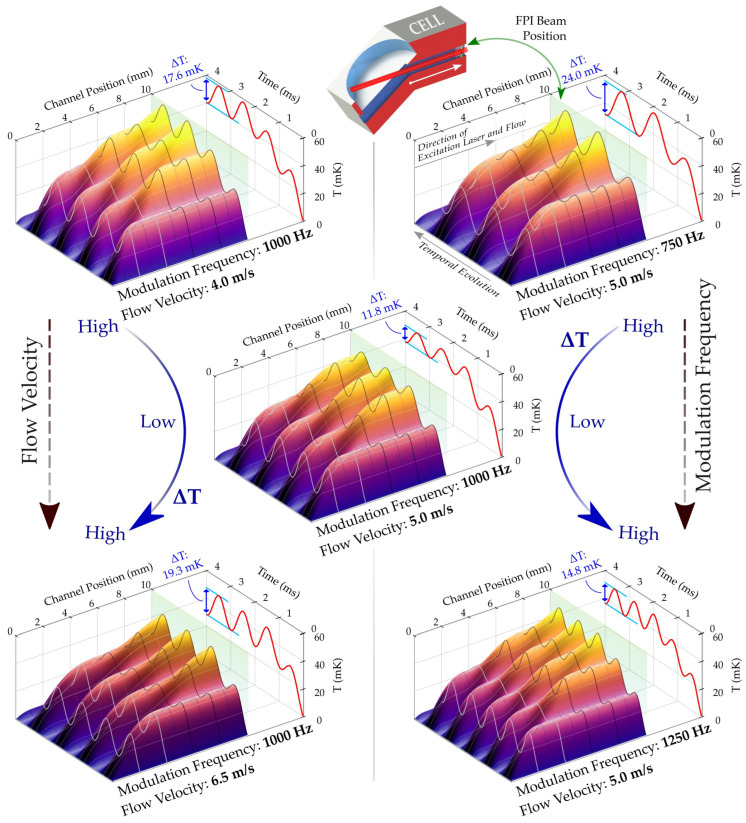
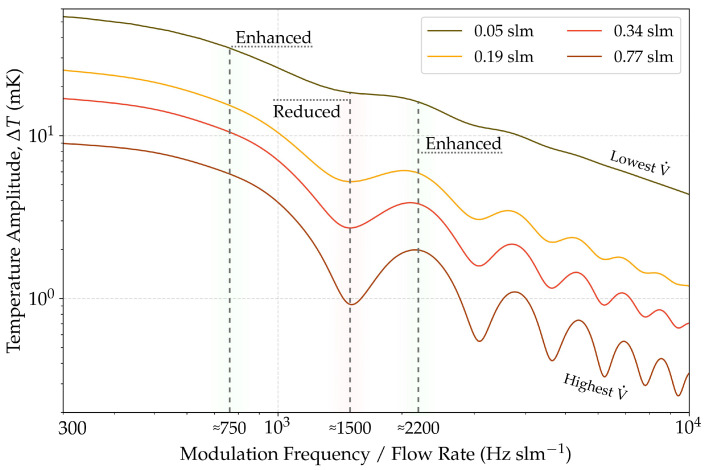
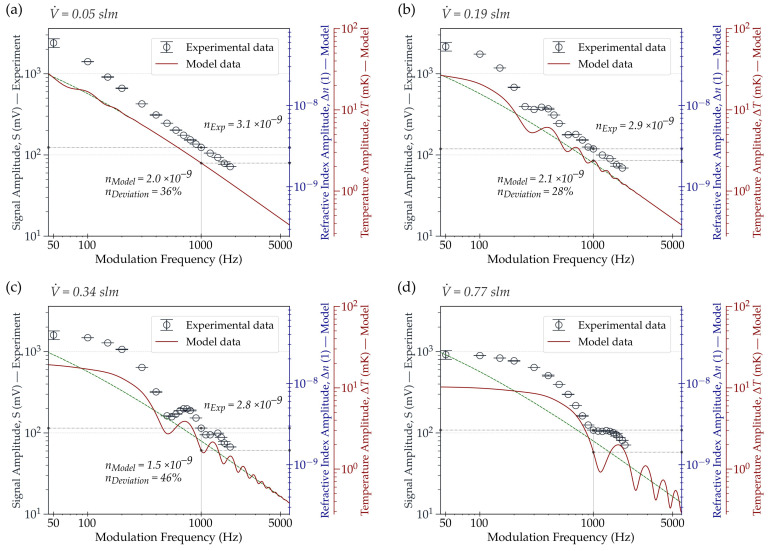
Photothermal spectroscopy (PTS) is a promising sensing technique for the measurement of gases and aerosols. PTS systems using a Fabry-Pérot interferometer (FPI) are considered particularly promising owing to their robustness and potential for miniaturization. However, limited information is available on viable procedures for signal improvement through parameter tuning. In our work, we use an FPI-based PTS configuration, in which the excitation laser irradiates the target collinearly to the flowing gas. We demonstrate that the generated thermal wave, and thus the signal intensity, is significantly affected by the ratio between excitation modulation frequency and gas flow velocity towards another. We provide an analytical model that predicts the signal intensity with particular considerations of these two parameter settings and validate the findings experimentally. The results reveal the existence of an optimal working regime, depending on the modulation frequency and flow velocity.

Keywords: Fabry–Pérot interferometer; PTS sensors; gas sensing; photothermal spectroscopy.


Conflict of interest statement

The authors declare no conflict of interest.

Figures

Figure 1
Figure 1
Schematic sketch of the channel geometry with the coordinates of the relevant elements in xz-plane (left) and yz-plane (right). The excitation laser beam (red) propagates centrally through the channel and collinear to the gas flow in the area of exposure, i.e., the excitation channel. Both gas duct (blue area) and etalon (positioned at the dashed green line) are rectangular with a size of 1 × 2 mm (width × height). The excitation length (black arrow) spans approximately 10 mm, starting at the transition from the curvature to the horizontal part of the channel and ending at the position of the FPI probe laser beam.
Figure 2
Figure 2
Photothermal cell used for the PTS measurements. The excitation laser beam with a 1/e2 radius of 0.43 mm is aligned collinearly to the movement direction of the gas in the excitation channel. The beam enters the cell through a window arranged at the Brewster angle. The fiber-coupled, air-spaced etalon for monitoring the RI is fitted firmly into the channel system and held gas-tight by a clamping bolt and a sealing ring. Areas colored in red and blue symbolize a sectional view through the cell and its gas duct system, respectively, which serves solely for visualization. The FPI probe beam (green) in the upper right sketch is drawn to scale as FWHM for visibility.
Figure 3
Figure 3
Schematic sketch of the experimental setup with its key components for the modulation frequency sweep. Gas with a predefined water concentration and flow rate is pumped through the cell (solid blue arrows). Periodic temperature change inside the excitation channel, induced by the absorption of the modulated excitation laser (dashed yellow and red arrows), is monitored interferometrically (dashed green arrows). Processing the FPI signal and controlling the laser modulation are accomplished via an FPGA that is part of a real-time computing device (NI cRIO, National Instruments). Solid gray arrows denote the essential data flow.
Figure 4
Figure 4
Temporal and positional temperature evolution at the channel centerline for different flow velocities (left) and modulation frequencies (right). The channel position axis represents the x-position inside the excitation channel. The variation in temperature ΔT (plotted at the red line as peak-to-peak) at the position of the FPI beam (translucent green plane) initially decreases towards both a higher flow velocity and modulation frequencies (top to center plot) before increasing again (center to lower plots). The center plot configuration shows an unfavorable relationship between flow velocity and modulation frequency at 1000 Hz and 5.0 m/s by yielding a low ΔT. The illustration on top shows a cross-sectional view of the excitation area of the used PT cell.
Figure 5
Figure 5
Temperature amplitude as a function of the ratio between modulation frequency and mass flow rate for four selected mass flow rates V˙. Areas with greater temperature amplitude and areas with reduced amplitude appear, which are more pronounced towards larger V˙. The temperature amplitude is averaged over the entire channel height.
Figure 6
Figure 6
Spectral density estimation (Welch’s spectra) with a blocked excitation laser beam for evaluating the highest reasonable mass flow rate V˙ through the cell. Flow rates of 0.6 slm and below show similar noise spectra, implying a laminar flow without significant turbulence. Welch’s spectra for V˙ of 0.8 slm and above exhibit a swift noise increase towards higher flow rates. Further experimental runs are thus to be limited to remain below 0.8 slm.
Figure 7
Figure 7
Experimental (circles) and numerical simulation (solid red line) frequency sweep for four selected flow rates. The model features amplitude variations oscillating around a zero-flow baseline (dashed green line) that increase in intensity for higher V˙ (from (ad)). Variations in amplitude are experimentally not observable for the lowest V˙ (a) but become distinctly noticeable towards higher V˙. Deviations between experiment and model in amplitude (for all V˙) and oscillation position (for high V˙) are attributable to parameter uncertainties in the model (e.g., flow velocity distribution) and engineering constraints in the experimental setup (e.g., PT cell imperfections). The measured values (in mV) are convertible into Δn and ΔT at 1 kHz via the given sensitivity of the FPI device.

Similar articles

References

    1. Bialkowski S.E. Photothermal Spectroscopy Methods for Chemical Analysis. Volume 177 John Wiley & Sons; Hoboken, NJ, USA: 1996.
    1. Krzempek K. A review of photothermal detection techniques for gas sensing applications. Appl. Sci. 2019;9:2826. doi: 10.3390/app9142826. - DOI
    1. Sedlacek A., Lee J. Photothermal interferometric aerosol absorption spectrometry. Aerosol Sci. Technol. 2007;41:1089–1101. doi: 10.1080/02786820701697812. - DOI
    1. Lee J., Moosmüller H. Measurement of Light Absorbing Aerosols with Folded-Jamin Photothermal Interferometry. Sensors. 2020;20:2615. doi: 10.3390/s20092615. - DOI - PMC - PubMed
    1. Dudzik G., Krzempek K., Abramski K., Wysocki G. Solid-state laser intra-cavity photothermal gas sensor. Sens. Actuators B Chem. 2021;328:129072. doi: 10.1016/j.snb.2020.129072. - DOI

LinkOut - more resources