. 2022 Sep 22;22(19):7193.
doi: 10.3390/s22197193.

Additively Manufactured Detection Module with Integrated Tuning Fork for Enhanced Photo-Acoustic Spectroscopy

Affiliations

Additively Manufactured Detection Module with Integrated Tuning Fork for Enhanced Photo-Acoustic Spectroscopy

Roberto Viola et al. Sensors (Basel). .

Abstract

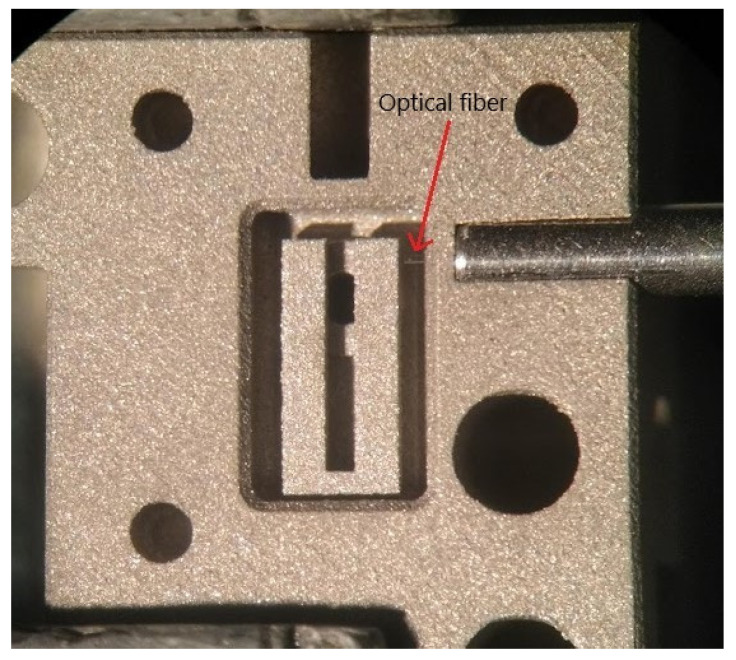
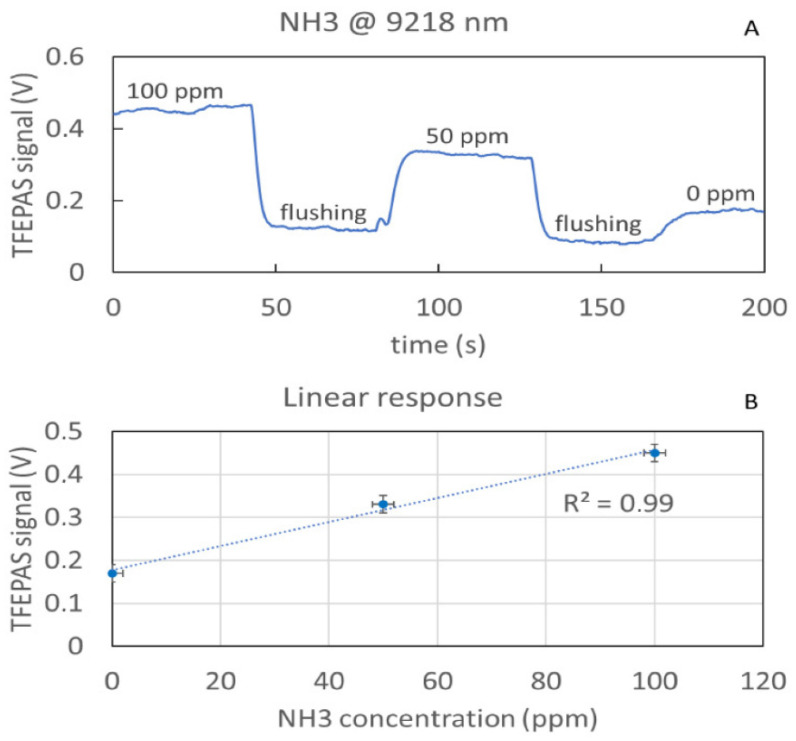
Starting from Quartz-Enhanced Photo-Acoustic Spectroscopy (QEPAS), we have explored the potential of a tightly linked method of gas/vapor sensing, from now on referred to as Tuning-Fork-Enhanced Photo-Acoustic Spectroscopy (TFEPAS). TFEPAS utilizes a non-piezoelectric metal or dielectric tuning fork to transduce the photoacoustic excitation and an optical interferometric readout to measure the amplitude of the tuning fork vibration. In particular, we have devised a solution based on Additive Manufacturing (AM) for the Absorption Detection Module (ADM). The novelty of our solution is that the ADM is entirely built monolithically by Micro-Metal Laser Sintering (MMLS) or other AM techniques to achieve easier and more cost-effective customization, extreme miniaturization of internal volumes, automatic alignment of the tuning fork with the acoustic micro-resonators, and operation at high temperature. This paper reports on preliminary experimental results achieved with ammonia at parts-per-million concentration in nitrogen to demonstrate the feasibility of the proposed solution. Prospectively, the proposed TFEPAS solution appears particularly suited for hyphenation to micro-Gas Chromatography and for the analysis of complex solid and liquid traces samples, including compounds with low volatility such as illicit drugs, explosives, and persistent chemical warfare agents.

Keywords: PAS; gas analyzer; interferometric readout; micro additive manufacturing; tuning fork.


Conflict of interest statement

The authors declare no conflict of interest.

Figures

Figure 1
Figure 1
STEP models for additive manufacturing of the two monolithic stainless-steel parts of the TFEPAS ADM. The red arrows indicate two small apertures, giving access to the gas sample for analysis and to the optical fiber for interferometric readout.
Figure 2
Figure 2
(A) Picture of the AM part of the ADM, and size comparison with a 1 cent coin. (B) Detail of a lateral view of the tuning fork close to contact with the micro-acoustic resonator. (C) front view of the tuning fork with micro-resonator behind, showing the roughness of AM surfaces.
Figure 3
Figure 3
Picture of the test bench for interferometric readout of the micro-3D-printed tuning fork.
Figure 4
Figure 4
Optical schemes for the interferometric readout system. (A): free space solution based on a cube beam splitter; (B): more embedded solution based on optical fiber circulator.
Figure 5
Figure 5
Picture of the AM part of the ADM showing the end ferrule of the optical fiber for interferometric readout locked to the ADM. The red arrow indicates the optical fiber protruding to get close to the tuning fork.
Figure 6
Figure 6
Response of the AM tuning fork to coarse- (A) and fine-tuning (B) of the photothermal excitation around the resonance frequency. Similar response to photoacoustic excitation frequency around the resonance frequency (C).
Figure 7
Figure 7
Real time measurement of the TFEPAS signal acquired while flushing different concentrations of ammonia (A) and corresponding scatter plot showing the linearity of the response (B).
Figure 8
Figure 8
(A) Reference IR absorption spectrum of ammonia from PNNL database. (B) Real-time acquisition of the signal from 100 ppm of ammonia while cyclically scanning the emission wavelength of the QCL across the IR absorption line at 9218 nm. (C) Absorption spectrum of ammonia measured in the wavelength spectral range 9210–9335 nm. The strongest peak at 9218 nm is out of scale for showing all the other absorption peaks detected better. (D) Spectrum measured in the same wavelength spectral range of the reference (9200–9410 nm).

References

    1. Kosterev A.A., Bakhirkin Y.A., Curl R.F., Tittel F.K. Quartz-enhanced photoacoustic spectroscopy. Opt. Lett. 2002;27:1902–1904. doi: 10.1364/OL.27.001902. - DOI - PubMed
    1. Kosterev A.A., Tittel F.K., Serebryakov D.V., Malinovsky A.L., Morozov I.V. Applications of quartz tuning forks in spectroscopic gas sensing. Rev. Sci. Instrum. 2005;76:043105. doi: 10.1063/1.1884196. - DOI
    1. Patimisco P., Scamarcio G., Tittel F.K., Spagnolo V. Quartz-enhanced photoacoustic spectroscopy: A review. Sensors. 2014;14:6165–6206. doi: 10.3390/s140406165. - DOI - PMC - PubMed
    1. Ma Y. Review of Recent Advances in QEPAS-Based Trace Gas Sensing. Appl. Sci. 2018;8:1822. doi: 10.3390/app8101822. - DOI
    1. Phillips M.C., Myers T.L., Wojcik M.D., Cannon B.D. External cavity quantum cascade laser for quartz tuning fork photoacoustic spectroscopy of broad absorption features. Opt. Lett. 2007;32:1177–1179. doi: 10.1364/OL.32.001177. - DOI - PubMed