. 2022 Sep 26;22(19):7300.
doi: 10.3390/s22197300.

Classification of Drivers' Mental Workload Levels: Comparison of Machine Learning Methods Based on ECG and Infrared Thermal Signals

Affiliations

Classification of Drivers' Mental Workload Levels: Comparison of Machine Learning Methods Based on ECG and Infrared Thermal Signals

Daniela Cardone et al. Sensors (Basel). .

Abstract

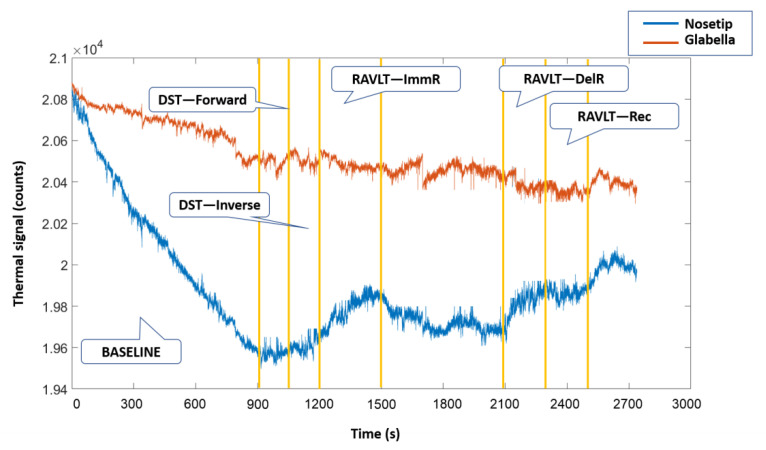
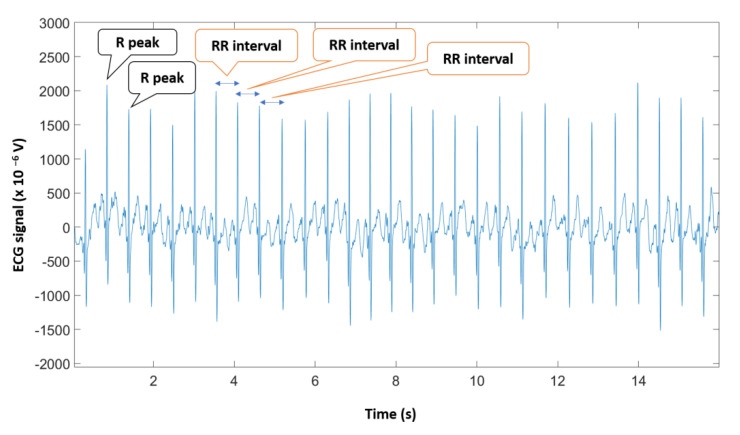
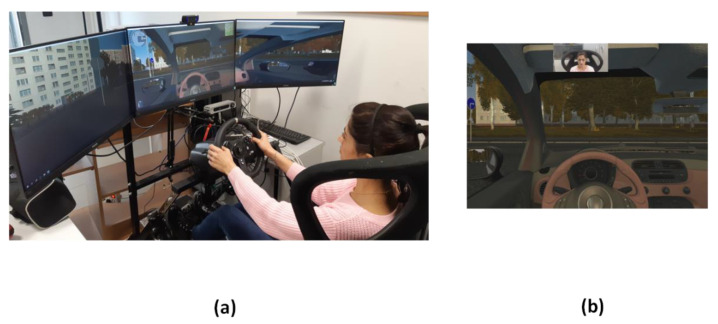
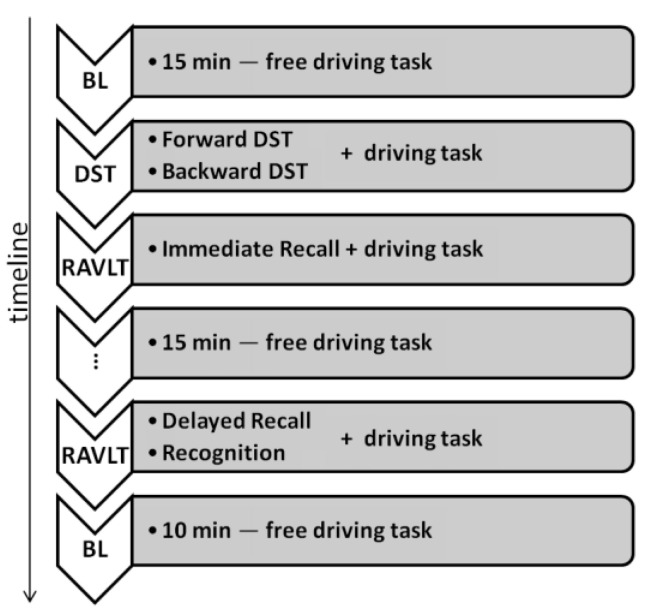
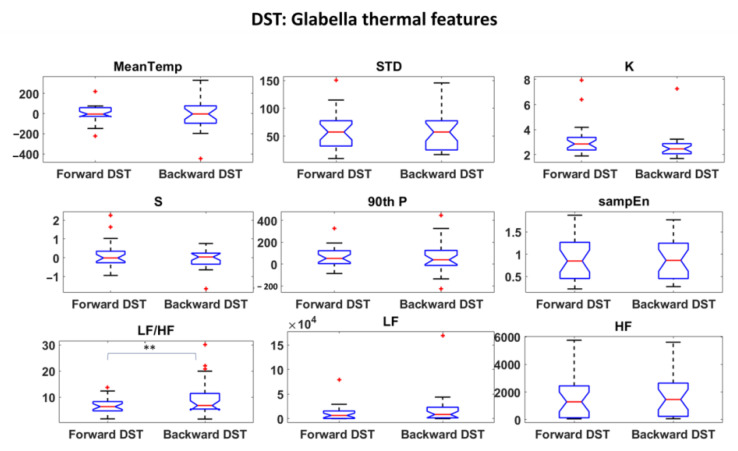
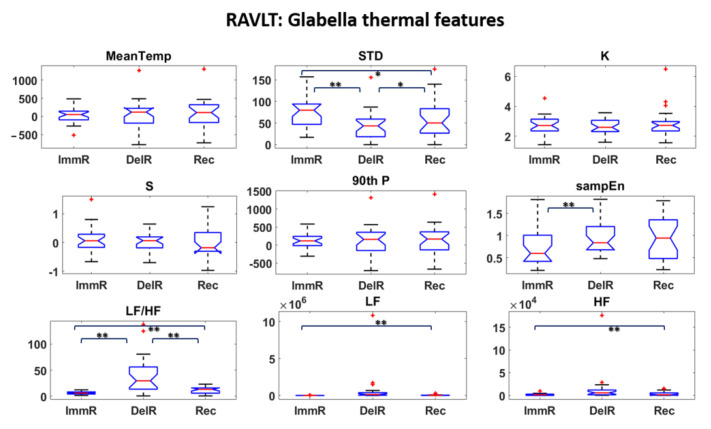
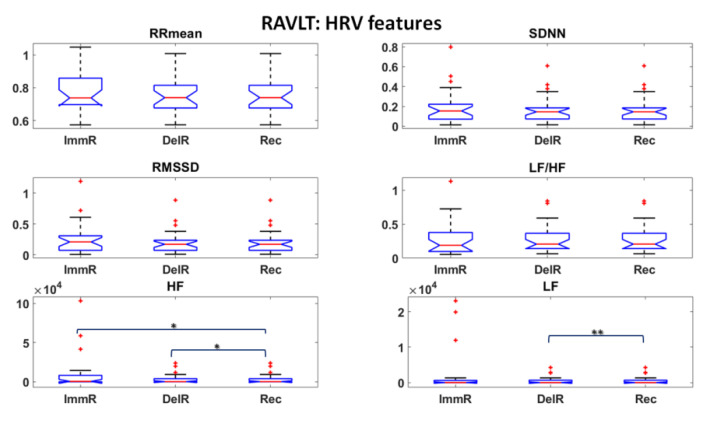
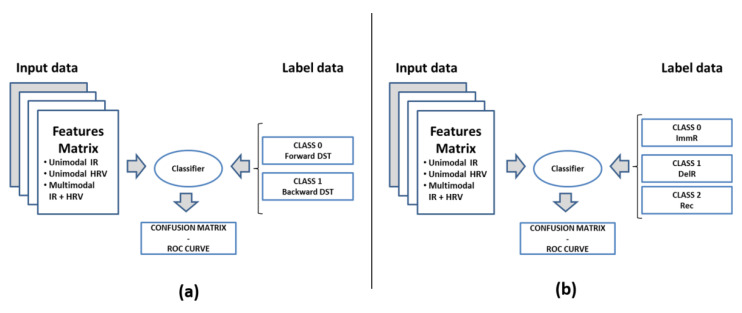
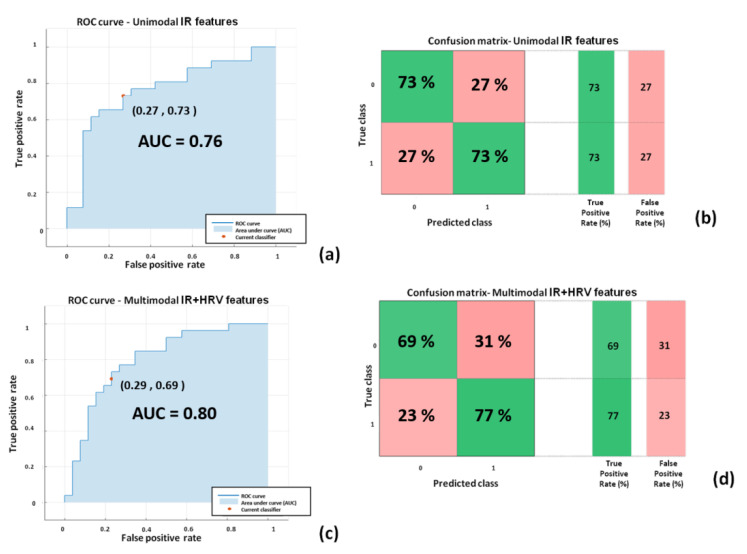
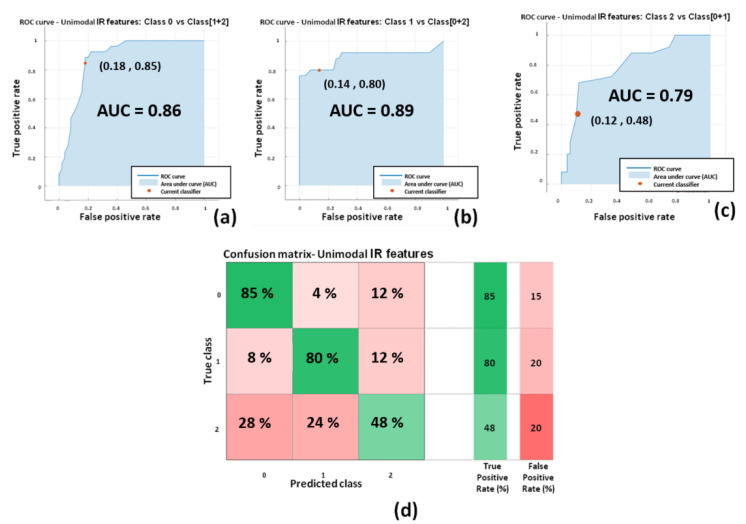
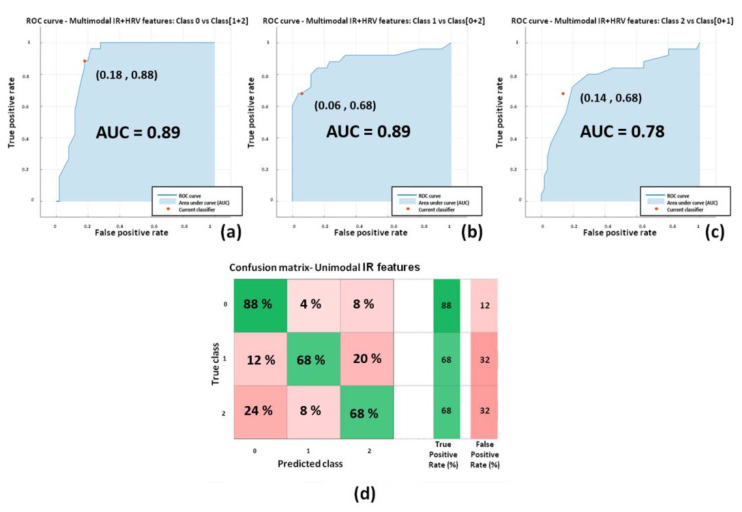
Mental workload (MW) represents the amount of brain resources required to perform concurrent tasks. The evaluation of MW is of paramount importance for Advanced Driver-Assistance Systems, given its correlation with traffic accidents risk. In the present research, two cognitive tests (Digit Span Test-DST and Ray Auditory Verbal Learning Test-RAVLT) were administered to participants while driving in a simulated environment. The tests were chosen to investigate the drivers' response to predefined levels of cognitive load to categorize the classes of MW. Infrared (IR) thermal imaging concurrently with heart rate variability (HRV) were used to obtain features related to the psychophysiology of the subjects, in order to feed machine learning (ML) classifiers. Six categories of models have been compared basing on unimodal IR/unimodal HRV/multimodal IR + HRV features. The best classifier performances were reached by the multimodal IR + HRV features-based classifiers (DST: accuracy = 73.1%, sensitivity = 0.71, specificity = 0.69; RAVLT: accuracy = 75.0%, average sensitivity = 0.75, average specificity = 0.87). The unimodal IR features based classifiers revealed high performances as well (DST: accuracy = 73.1%, sensitivity = 0.73, specificity = 0.73; RAVLT: accuracy = 71.1%, average sensitivity = 0.71, average specificity = 0.85). These results demonstrated the possibility to assess drivers' MW levels with high accuracy, also using a completely non-contact and non-invasive technique alone, representing a key advancement with respect to the state of the art in traffic accident prevention.

Keywords: ADAS; automotive ergonomics; driver monitoring; infrared imaging; mental workload.


Conflict of interest statement

The authors declare that they have no conflict of interest.

Figures

Figure A1
Figure A1
Thermal signals extracted from nosetip (in blue) and glabella (in orange) ROIs over the experimental phases.
Figure A2
Figure A2
Exemplificative ECG signal. Example of R peaks and RR intervals are highlighted.
Figure 1
Figure 1
Experimental setting: (a) static driver simulator; (b) screenshot of the driving simulation software (i.e., City Car Driving, Home Edition software-version 1.5, Forward Development, Ltd., Verona (WI), USA [37]).
Figure 2
Figure 2
Pipeline of the experimental protocol.
Figure 3
Figure 3
Imaging system device settings: (a) position of the imaging system in the driving simulator; (b) detail of the imaging system device (visible and thermal camera horizontally aligned and held together by means of a 3d-printed support).
Figure 4
Figure 4
Processing of thermal and visible videos. (a) Software interface for the acquisition and processing of visible and thermal IR videos. (b) Thermal image with ROI drawn in red colors (Nosetip and Glabella); (c) thermal signal extracted from the two ROIs during the experimental phases. The values are obtained subtracting the mean value of the signals during the baseline phase.
Figure 5
Figure 5
Whiskers plot of the participants’ scores in DST (a) and RAVLT (b). Outliers are represented with red crosses.
Figure 6
Figure 6
Thermal features relative to Nosetip ROI extracted during DST (* p < 0.05; ** p < 0.01). Outliers are represented with red crosses. The titles of the single plots refer to abbreviations of features described in Section 3.3.
Figure 7
Figure 7
Thermal features relative to Glabella ROI extracted during DST (** p < 0.01). Outliers are represented with red crosses. The titles of the single plots refer to abbreviations of features described in Section 3.3.
Figure 8
Figure 8
HRV features extracted during DST. Outliers are represented with red crosses. The titles of the single plots refer to abbreviations of features described in Section 3.3.
Figure 9
Figure 9
Thermal features relative to Nosetip ROI extracted during RAVLT (* p < 0.05; ** p < 0.01). Outliers are represented with red crosses. The titles of the single plots refer to abbreviations of features described in Section 3.3.
Figure 10
Figure 10
Thermal features relative to Glabella ROI extracted during RAVLT (* p < 0.05; ** p < 0.01). Outliers are represented with red crosses. The titles of the single plots refer to abbreviations of features described in Section 3.3.
Figure 11
Figure 11
HRV features extracted during RAVLT (* p < 0.05; ** p < 0.01). Outliers are represented with red crosses. The titles of the single plots refer to abbreviations of features described in Section 3.3.
Figure 12
Figure 12
Scheme of classification adopted in the present work: (a) scheme of the two-level classification model for DST; (b) scheme of the three-level classification model for RAVLT.
Figure 13
Figure 13
Performances of the SVM classifiers for DST: (a) ROC curve for unimodal IR features-based classifier; (b) confusion matrix unimodal IR features-based classifier; (c) ROC curve for multimodal IR + HRV features-based classifier; (d) confusion matrix multimodal IR + HRV features-based classifier.
Figure 14
Figure 14
Performances of the Ensemble bagged trees for unimodal IR features-based classifiers for RAVLT: (a) ROC curve for the classifier of class ImmR (i.e., class 0) vs. cumulative class (DelR + Rec) (i.e., class 1 + 2); (b) ROC curve for the classifier of class DelR (i.e., class 1) vs. cumulative class (ImmR + Rec) (i.e., class 0 + 2); (c) ROC curve for the classifier of class Rec (i.e., class 2) vs. cumulative class (ImmR + DelR) (i.e., class 0 + 1); (d) confusion matrix for the unimodal IR features-based classifier.
Figure 15
Figure 15
Performances of the Ensemble bagged trees for multimodal IR + hrv features-based classifiers for RAVLT: (a) ROC curve for the classifier of class ImmR (i.e., class 0) vs. cumulative class (DelR + Rec) (i.e., class 1 + 2); (b) ROC curve for the classifier of class DelR (i.e., class 1) vs. cumulative class (ImmR + Rec) (i.e., class 0 + 2); (c) ROC curve for the classifier of class Rec (i.e., class 2) vs. cumulative class (ImmR + DelR) (i.e., class 0 + 1); (d) confusion matrix for the multimodal IR features-based classifier.

References

    1. Kajiwara S. Evaluation of Driver’s Mental Workload by Facial Temperature and Electrodermal Activity under Simulated Driving Conditions. Int. J. Automot. Technol. 2014;15:65–70. doi: 10.1007/s12239-014-0007-9. - DOI
    1. Kantowitz B.H., Simsek O. Stress, Workload, and Fatigue. CRC Press; Boca Raton, FL, USA: 2000. Secondary-task measures of driver workload.
    1. Da Silva F.P. Mental Workload, Task Demand and Driving Performance: What Relation? Procedia Soc. Behav. Sci. 2014;162:310–319. doi: 10.1016/j.sbspro.2014.12.212. - DOI
    1. Paxion J., Galy E., Berthelon C. Mental Workload and Driving. Front. Psychol. 2014;5:1344. doi: 10.3389/fpsyg.2014.01344. - DOI - PMC - PubMed
    1. Charles R.L., Nixon J. Measuring Mental Workload Using Physiological Measures: A Systematic Review. Appl. Ergon. 2019;74:221–232. doi: 10.1016/j.apergo.2018.08.028. - DOI - PubMed

LinkOut - more resources