. 2022 Oct 8;22(19):7626.
doi: 10.3390/s22197626.

Optical Oxygen Sensing and Clark Electrode: Face-to-Face in a Biosensor Case Study

Affiliations

Optical Oxygen Sensing and Clark Electrode: Face-to-Face in a Biosensor Case Study

Pavel V Melnikov et al. Sensors (Basel). .

Abstract

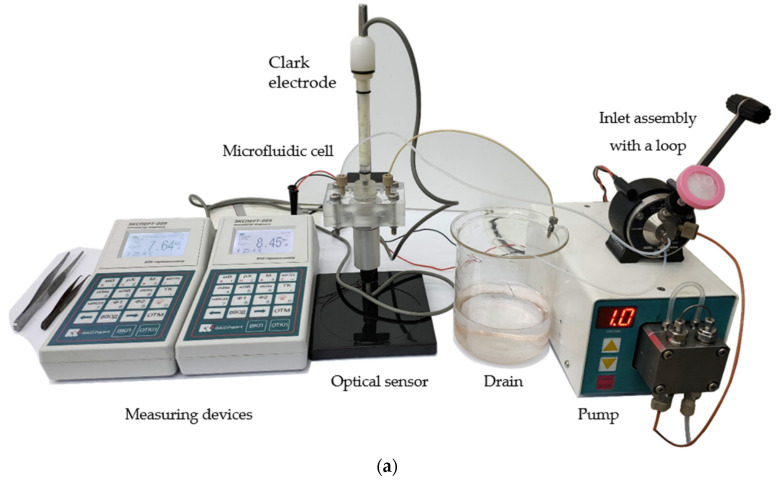
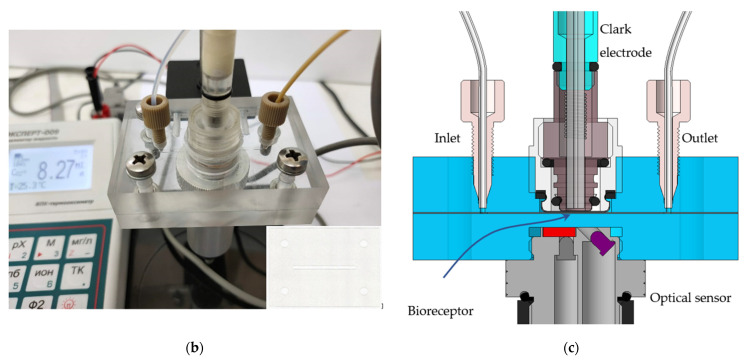
In the last decade, there has been continuous competition between two methods for detecting the concentration of dissolved oxygen: amerometric (Clark electrode) and optical (quenching of the phosphorescence of the porphyrin metal complex). Each of them has obvious advantages and disadvantages. This competition is especially acute in the development of biosensors, however, an unbiased comparison is extremely difficult to achieve, since only a single detection method is used in each particular study. In this work, a microfluidic system with synchronous detection of the oxygen concentration by two methods was created for the purpose of direct comparison. The receptor element is represented by Saccharomyces cerevisiae yeast cells adsorbed on a composite material, previously developed by our scientific group. To our knowledge, this is the first work of this kind in which the comparison of the oxygen detection methods is carried out directly.

Keywords: adhesion control; biofouling; biosensor; fluorinated material; lab-on-chip; microfluidics; modified nanodiamond; nanostructured surface; optical sensor; oxygen sensor; surface modification.


Conflict of interest statement

The authors declare no conflict of interest.

Figures

Figure 1
Figure 1
Experimental setup: (a)—overall view; (b)—the developed microfluidic cell with installed amperometric Clark electrode (top), optical oxygen sensor (bottom). A PET film with an eluent channel is shown in the inset; (c) schematic representation of a microfluidic cell in section, side view. The bioreceptor is placed in the center of the cell directly into the liquid flow, the amperometric (top) and optical (bottom) sensors are in close proximity, performing measurements in the same microvolume.
Figure 1
Figure 1
Experimental setup: (a)—overall view; (b)—the developed microfluidic cell with installed amperometric Clark electrode (top), optical oxygen sensor (bottom). A PET film with an eluent channel is shown in the inset; (c) schematic representation of a microfluidic cell in section, side view. The bioreceptor is placed in the center of the cell directly into the liquid flow, the amperometric (top) and optical (bottom) sensors are in close proximity, performing measurements in the same microvolume.
Figure 2
Figure 2
Dependences of the oxygen concentration in the analyzed microvolume on time from the moment the sample was injected into the flow for different concentrations: (a)—Clark electrode current; (b)—indicator dye excited state lifetime. Flow rate 1 mL·min−1, loop volume 0.2 ml.
Figure 3
Figure 3
Methods for the recorded signal processing: (a)—calculation of the peak area; (b)—determination of the peak height; (c)—determination of the slope (the rate of change of the primary signal) after the sample enters the cell.
Figure 4
Figure 4
Calibration dependencies for different methods of the original data processing (calculated areas, heights, and slopes): (ac)—Clark electrode; (df)—optical sensor. Readings of the optical sensor vs. Clark electrode: (g)—peak area; (i)—peak height; (j)—slope.
Figure 5
Figure 5
Properties of the created receptor element: (a)—respiratory MTT assay; (b)—Images of the surface (1200×) of a freshly prepared sensor with applied Saccharomyces cerevisiae yeast and a sample after a working day. Fluorescent staining: the cells are shown in red, and the polysaccharide biofilm matrix is indicated in green.
Figure 6
Figure 6
The response of the Saccharomyces cerevisiae bioreceptor on the concentration of glucose in the microfluidic cell: (a)—Clark electrode; (b)—optical oxygen sensor. Flow rate 1 mL·min−1, loop volume 0.2 mL.
Figure 7
Figure 7
Influence of loop volume and flow rate on the system performance: (a)—calibration slope and (b)—coefficient of mixed correlation dependencies for Clark electrode; (c)—calibration slope and (d)—coefficient of mixed correlation dependencies for optical oxygen sensor.
Figure 7
Figure 7
Influence of loop volume and flow rate on the system performance: (a)—calibration slope and (b)—coefficient of mixed correlation dependencies for Clark electrode; (c)—calibration slope and (d)—coefficient of mixed correlation dependencies for optical oxygen sensor.
Figure 8
Figure 8
Dependence of the estimated BOD5 parameter on that determined by the classical method.

References

    1. Justino C.I.L., Duarte A.C., Rocha-Santos T.A.P. Recent progress in biosensors for environmental monitoring: A review. Sensors. 2017;17:2918. doi: 10.3390/s17122918. - DOI - PMC - PubMed
    1. Panchenko P.A., Fedorov Y.V., Polyakova A.S., Fedorova O.A. Fluorimetric detection of Ag+ cations in aqueous solutions using a polyvinyl chloride sensor film doped with crown-containing 1,8-naphthalimide. Mendeleev Commun. 2021;31:517–519. doi: 10.1016/j.mencom.2021.07.027. - DOI
    1. Gorbatov S.A., Kozlov M.A., Zlobin I.E., Kartashov A.V., Zavarzin I.V., Volkova Y.A. Highly selective BODIPY-based fluorescent probe for Zn2+ imaging in plant roots. Mendeleev Commun. 2018;28:615–617. doi: 10.1016/j.mencom.2018.11.017. - DOI
    1. Gavrilenko N.A., Volgina T.N., Gavrilenko M.A. Colorimetric sensor for determination of thiocyanate in fossil and drill waters. Mendeleev Commun. 2017;27:529–530. doi: 10.1016/j.mencom.2017.09.034. - DOI
    1. Bhalla N., Jolly P., Formisano N., Estrela P. Introduction to biosensors. Essays Biochem. 2016;60:1–8. doi: 10.1042/EBC20150001. - DOI - PMC - PubMed

LinkOut - more resources