. 2022 Dec;13(6):3163-3180.
doi: 10.1002/jcsm.13106. Epub 2022 Oct 13.

Atrophic skeletal muscle fibre-derived small extracellular vesicle miR-690 inhibits satellite cell differentiation during ageing

Affiliations

Atrophic skeletal muscle fibre-derived small extracellular vesicle miR-690 inhibits satellite cell differentiation during ageing

Xiaoyan Shao et al. J Cachexia Sarcopenia Muscle. 2022 Dec.

Abstract

Background: Sarcopenia is a common and progressive skeletal muscle disorder characterized by atrophic muscle fibres and contractile dysfunction. Accumulating evidence shows that the number and function of satellite cells (SCs) decline and become impaired during ageing, which may contribute to impaired regenerative capacity. A series of myokines/small extracellular vesicles (sEVs) released from muscle fibres regulate metabolism in muscle and extramuscular tissues in an autocrine/paracrine/endocrine manner during muscle atrophy. It is still unclear whether myokines/sEVs derived from muscle fibres can affect satellite cell function during ageing.

Methods: Aged mice were used to investigate changes in the myogenic capacity of SCs during ageing-induced muscle atrophy. The effects of atrophic myotube-derived sEVs on satellite cell differentiation were investigated by biochemical methods and immunofluorescence staining. Small RNA sequencing was performed to identify differentially expressed sEV microRNAs (miRNAs) between the control myotubes and atrophic myotubes. The target genes of the miRNA were predicted by bioinformatics analysis and verified by luciferase activity assays. The effects of identified miRNA on the myogenic capacity of SCs in vivo were investigated by intramuscular injection of adeno-associated virus (AAV) to overexpress or silence miRNA in skeletal muscle.

Results: Our study showed that the myogenic capacity of SCs was significantly decreased (50%, n = 6, P < 0.001) in the tibialis anterior muscle of aged mice. We showed that atrophic myotube-derived sEVs inhibited satellite cell differentiation in vitro (n = 3, P < 0.001) and in vivo (35%, n = 6, P < 0.05). We also found that miR-690 was the most highly enriched miRNA among all the screened sEV miRNAs in atrophic myotubes [Log2 (Fold Change) = 7, P < 0.001], which was verified in the atrophic muscle of aged mice (threefold, n = 6, P < 0.001) and aged men with mean age of 71 ± 5.27 years (2.8-fold, n = 10, P < 0.001). MiR-690 can inhibit myogenic capacity of SCs by targeting myocyte enhancer factor 2, including Mef2a, Mef2c and Mef2d, in vitro (n = 3, P < 0.05) and in vivo (n = 6, P < 0.05). Specific silencing of miR-690 in the muscle can promote satellite cell differentiation (n = 6, P < 0.001) and alleviate muscle atrophy in aged mice (n = 6, P < 0.001).

Conclusions: Our study demonstrated that atrophic muscle fibre-derived sEV miR-690 may inhibit satellite cell differentiation by targeting myocyte enhancer factor 2 during ageing.

Keywords: Muscle fibre; Myogenic capacity; Sarcopenia; Satellite cells; Small extracellular vesicle; miR-690.


Conflict of interest statement

The authors disclose no potential conflicts of interest.

Figures
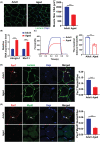
Figure 1
Figure 1
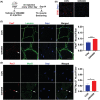
The myogenic capacity of SCs decreased in company with muscle atrophy in aged mice. (A) Left panel: The representative images of immunofluorescent staining for fibre cross section in TA muscle from adult mice and aged mice. The muscle fibre membranes were immunostained with anti‐laminin antibody (green) and the nuclei in muscle fibres were labelled with Dapi (blue). Scale bars, 100 μm. Right panel: The semi‐quantitative analysis of fCSA for TA from adult mice and aged mice. (B) Q‐PCR analysis of Atrogin‐1 and Murf‐1 mRNA levels in TA muscles from adult mice and aged mice. (C) Left panel, the representative curve for tetanic force generated during tetanic stimulation in EDL from adult and aged mice. Right panel, the maximal tetanic force in EDL from adult and aged mice. (D) Left panel, the representative images of immunofluorescent staining for Pax7 (red) and laminin (green) in TA muscle sections from adult mice and aged mice. The nuclei were labelled with DAPI (blue). Scale bars: 50 μm. Right panel: The average number of Pax7 positive staining SCs (Pax7+) per TA section of adult mice and aged mice. (E) Left panel: The representative images of immunofluorescent staining for Pax7 (red) and MyoD (green) in TA section from adult mice and aged mice. Nuclei were labelled with DAPI (blue). Scale bars, 50 μm. Right panel: The average number of double‐positive staining with Pax7+ and MyoD+ SCs (Pax7+/MyoD+) per TA section of adult mice and aged mice. Notes: Data are presented as means ± SEM. *P < 0.05, **P < 0.01, ***P < 0.001 by Student's t‐test. N = 6 for each group. EDL, extensor digitorum longus; fCSA, muscle fibre cross‐sectional area; SCs, satellite cells; TA, tibialis anterior.
Figure 2
Figure 2
sEVs released from atrophic myotube inhibited myoblast differentiation in vitro. (A) The representative cryo‐EM images of sEVs in supernatant released from starvation‐induced atrophic myotubes. Scale bar, 50 nm. (B) Dynamic light scattering (DLS) showing the particle size distribution of sEVs in supernatant from atrophic myotubes induced by starvation. (C) Western blot analysis for the protein expression of the EV markers (CD81 and CD9) in both sEVs in supernatant and total cell lysate (TCL) from atrophic myotubes. The sEVs fraction is missing the ER marker (calnexin), whereas the TCL fraction is free from the sEVs markers (CD81 and CD9). (D) The representative images of immunofluorescence staining for MyHC in C2C12 myoblasts during differentiation after treated with sEVs released from atrophic and control myotubes, respectively. Scale bars, 200 μm. (E) Q‐PCR analysis for the mRNA expression levels of myogenesis‐related genes, including MyoD, MyoG and MyHC, in C2C12 myoblast during differentiation after incubation with sEVs released from atrophic and control myotubes, respectively. (F) Western blot analysis for the protein levels of myogenesis‐related genes in C2C12 myoblasts during differentiation after adding CON‐sEVs and ATR‐sEVs, respectively. Notes: Data are presented as means ± SEM. *P < 0.05, **P < 0.01, ***P < 0.001 by Student's t‐test. N = 3 for the group (D, E). ATR‐sEVs, sEVs from atrophic myotubes; CON‐sEVs, sEVs from control myotubes; cryo‐EM, cryogenic electron microscope; DLS, dynamic light scattering; ER, endoplasmic reticulum; TCL, total cell lysate.
Figure 3
Figure 3
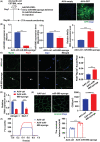
sEVs released from atrophic myotube inhibited myoblast differentiation in vivo. (A) Schematic diagram showing the experimental design for administration adult mice ATR‐sEVs and CON‐sEVs via intramuscular injection (i.m., 100 μg) into TA muscle once every other day for 14 days. (B) The representative images of immunofluorescent staining for PKH26 (red) and Pax7 (green) in TA muscle sections of adult mice 12 h after intramuscular injection with unlabelled sEVs (left), PKH26‐labelled CON‐sEVs (middle), PKH26‐labelled ATR‐sEVs (right). Nuclei were co‐stained with Dapi (blue). Scale bars, 100 μm. (C) Left panel: The representative images of immunofluorescent staining for Pax7 (red) and laminin (green) in TA muscle sections from CON‐sEVs treated mice and ATR‐sEVs treated mice. The nuclei were labelled by Dapi (blue). Scale bars: 50 μm. Right panel: The average number of Pax7 positive staining SCs (Pax7+) per TA section of CON‐sEVs treated mice and ATR‐sEVs treated mice. (D) Left panel, the representative images of immunofluorescent staining for Pax7 (red) and MyoD (green) in TA section from mice treated with CON‐sEVs and ATR‐sEVs, respectively. Nuclei were labelled with Dapi (blue). Scale bars, 50 μm. Right panel: The average number of double positive labelling with Pax7 and MyoD cells (Pax7+MyoD+) in TA section from mice treated with CON‐sEVs and ATR‐sEVs, respectively. Notes: Data are presented as means ± SEM. *P < 0.05, **P < 0.01, ***P < 0.001 by Student's t‐test. N = 6 for mice group (C, D). ATR‐sEVs, sEVs from atrophic myotubes; CON‐sEVs, sEVs from control myotubes; TA, tibialis anterior.
Figure 4
Figure 4
Blockage of sEV generation in atrophic muscle by GW4869 promoted SCs myogenic capacity in aged mice. (A) Schematic diagram illustrating the experimental design of administrating aged mice with GW4869 via daily intramuscular injection for 14 days. (B) The representative images of immunofluorescent staining for CD63 (red) in TA section from aged mice injected with PBS (control) and GW4869, respectively. Nuclei were co‐stained with Dapi (blue). Scale bars, 100 μm. (C) Left panel: The representative images of immunofluorescent staining for Pax7 (red) and laminin (green) in TA muscle sections from aged mice after intramuscular injection of PBS (control) and GW4869, respectively. The nuclei were labelled by Dapi (blue). Scale bars: 50 μm. Right panel: The average number of Pax7 positive staining SCs (Pax7+) per TA section of control mice and GW4869 injected mice. (D) Left panel: The representative images of immunofluorescent staining for Pax7 (red) and MyoD (green) in TA section from aged mice after intramuscular injection of PBS (control) and GW4869, respectively. Nuclei were labelled with Dapi (blue). Scale bars, 50 μm. Right panel: The average number of Pax7+ MyoD+ cells per TA section of control mice and GW4869 injected mice. Notes: Data are presented as means ± SEM. *P < 0.05, **P < 0.01, ***P < 0.001 by Student's t‐test. N = 6 for mice group (C, D). TA, tibialis anterior.
Figure 5
Figure 5
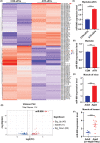
MiR‐690 enriched in sEVs released from atrophic myotubes and muscles induced by ageing. (A) Volcano plot of differentially enriched miRNAs showing 45 up‐regulated miRNAs and 53 down‐regulated miRNAs in the sEVs released from atrophic myotubes compared with those sEVs secreted from control myotubes [Log2(fold change) > 2]. The scattered dots indicate the individual miRNAs, the grey dots represent the miRNAs with no significant difference, the red dots represent the significantly up‐regulated differential miRNAs, and the blue dots represent the significantly down‐regulated differential miRNAs. MiR‐690 is the mostly enriched sEV miRNA among all the up‐regulated miRNAs. (B) Hierarchical clustering and heat map of the changed miRNAs. Scale bars show mean‐centred log2 normalized counts (row Z score), where red and blue column boxes indicate higher and lower than mean abundance, respectively. Each column represents a different sample and rows represent miRNA transcripts. (C) Q‐PCR analysis of miR‐690 expression level in CON‐sEVs and ATR‐sEVs, respectively. (D) Q‐PCR analysis of miR‐690 expression level in control myotubes (CON) and atrophic myotubes (ATR), respectively. (E) Q‐PCR analysis of miR‐690 expression level in TA muscle from adult mice and aged mice, respectively. (F) Q‐PCR analysis of miR‐690 expression level in muscle tissue from adult human (21–40 years) and aged human (61–85 years), respectively. Notes: The data are expressed as mean ± SEM; n = 6 mice for mice group (E), n = 3 for the other group (C, D) and n = 9 for adult human group, n = 10 for aged human group. *P < 0.05, **P < 0.01, ***P < 0.001 by Student's t‐test. ATR, atrophic myotubes; ATR‐sEVs, sEVs from atrophic myotubes; CON, control myotubes; CON‐sEVs, sEVs from control myotubes; TA, tibialis anterior.
Figure 6
Figure 6
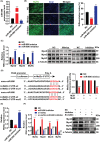
MiR‐690 inhibited C2C12 myoblast differentiation by targeting Mef2c in vitro. (A) Q‐PCR analysis of miR‐690 level in C2C12 myoblast after transfection with miR‐690 mimics, miR‐690 inhibitors and negative control vehicle (NC) for 5 days, respectively. The miR‐690 overexpression level indicates the efficiency of miR‐690 mimics transfection. The miR‐690 down‐regulated level indicates the efficiency of miR‐690 inhibitor transfection. (B) Left panel: The representative images of immunofluorescence staining for MyHC in C2C12 myoblasts after miR‐690 mimics, miR‐690 inhibitors and NC transfection, respectively. Scale bars, 200 μm. Right panel: The ratio of the MyHC‐positive cell number to the total nuclei number as the differentiation index. (C) Left panel: Q‐PCR analysis for the mRNA expression levels of myogenic marker genes, including MyoD, MyoG and MyHC during C2C12 myoblast differentiation after miR‐690 mimics, miR‐690 inhibitors and NC transfection, respectively. Right panel: Western blot analysis for the protein levels of myogenic markers, including MyoD, MyoG and MyHC, in C2C12 myoblast differentiation after treatment with miR‐690 mimics, miR‐690 inhibitors and NC, respectively. (D) Left panel: Diagram illustrating the construct of psiCHECK™‐2 vector. The predicted binding sequence and its mutated sequences (Mut1, Mut2 and Mut1/2) at 3′‐UTR of Mef2c by miR‐690 are highlighted. Right panel: The dual‐luciferase reporter assay for fluorescent activity of MEF2C in HK293T cells after co‐transfection with the WT or mutant Mef2c‐3′‐UTR luciferase construct in combination with miR‐690 mimics or NC. (E) Q‐PCR analysis for the mRNA expression level of Mef2c in myoblasts after transfection with miR‐690 mimics, miR‐690 inhibitor and NC, respectively. (F) Left panel: Q‐PCR analysis for the mRNA levels of Mef2c, MyoD, MyoG and MyHC, in C2C12 myoblasts after transfection with miR‐690 inhibitor, NC and si‐Mef2c in combination with or without miR‐690 inhibitor for 5 days. Right panel: Western blot analysis for the protein levels of MyoD, MyoG, MyHC and Mef2c, in C2C12 myoblasts after transfection with miR‐690 inhibitor, negative control and si‐Mef2c in combination with or without miR‐690 inhibitor for 5 days. Notes: Data are presented as means ± SEM. *P < 0.05, **P < 0.01, ***P < 0.001 vs. NC group by Student's t‐test (A, B, C, D, E). *P < 0.05, **P < 0.01, ***P < 0.001 vs. NC group and # P < 0.05, ## P < 0.01, ### P < 0.001 vs. miR‐690 inhibitor group by one‐way ANOVA (F). Mef2c, muscle enhancer factors 2c; MyHC, muscle myosin heavy chain; MyoD, myoblast determination protein 1; MyoG, Myogenin.
Figure 7
Figure 7
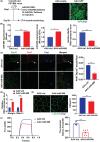
MiR‐690 overexpression in muscle fibres inhibited the myogenic capacity of SCs in vivo. (A) Left panel: Schematic diagram depicting the experimental design of administrating adult mice with recombinant AAV‐miR‐690 via intramuscular injection in TA muscles. Right panel: The representative microscopy images of frozen cross sections from TA muscles transduced with AAV‐empty (no insert in AAV expression vector) and AAV‐GFP in TA muscles from adult mice. Fluorescence signals indicate the positive expression of green fluorescent protein (GFP, green) in muscle fibres. (B) Left panel: Q‐PCR analysis of the miR‐690 expression level in TA muscles from AAV‐ctrl mice and AAV‐miR‐690 mice, respectively. Middle panel: Q‐PCR analysis of the miR‐690 expression level in sEVs isolated from TA muscles of AAV‐ctrl mice and AAV‐miR‐690 mice, respectively. Right panel: Q‐PCR analysis of the Mef2c expression level in TA muscles from AAV‐ctrl mice and AAV‐miR‐690 mice, respectively. (C) Left panel: The representative images of immunofluorescent staining for Pax7 (red) and MyoD (green) in TA section from AAV‐ctrl and AAV‐miR‐690 mice. Nuclei were labelled by Dapi (blue). Scale bars, 50 μm. Right panel: The average number of Pax7 + MyoD + cells per TA section from AAV‐ctrl and AAV‐miR‐690 mice, respectively. (D) Q‐PCR analysis of the mRNA levels of muscle atrophy related markers including atrogin‐1 and murf‐1 expression in TA muscles from AAV‐ctrl mice and AAV‐miR‐690 mice, respectively. (E) Left panel: The representative images of immunofluorescent staining for laminin in cryosection of TA muscles from AAV‐ctrl mice and AAV‐miR‐690 mice, respectively. Scale bars, 100 μm. Right panel: Semi‐quantitative analysis of fCSA in TA muscles from AAV‐ctrl mice and AAV‐miR‐690 mice, respectively. (F) Left panel: The representative curve of tetanic force generated by tetanic stimulation in EDL from AAV‐ctrl and AAV‐miR‐690 mice, respectively. Right panel: The maximal tetanic force of EDL muscle from AAV‐ctrl and AAV‐miR‐690 mice, respectively. Notes: Data are presented as means ± SEM. *P < 0.05, **P < 0.01, ***P < 0.001 by Student's t‐test. N = 6 for each group. EDL, extensor digitorum longus; fCSA, fibre cross‐sectional area; TA, tibialis anterior.
Figure 8
Figure 8
Silencing miR‐690 promoted SCs differentiation and alleviated muscle atrophy in aged mice. (A) Left panel: Schematic diagram illustrating the experimental design of administrating aged mice with recombinant AAV‐miR‐690‐sponge via intramuscular injection in TA muscles. Right panel: The representative microscopy images of frozen cross sections from TA muscles transduced with AAV‐empty (no insert in AAV expression vector) and AAV‐GFP in TA muscles from aged mice. Fluorescence signals indicate the positive expression of green fluorescent protein (GFP, green) in muscle fibres. (B) Left panel: Q‐PCR analysis for the expression level of miR‐690 in TA muscles of AAV‐ctrl mice and AAV‐miR‐690‐sponge mice, respectively. Middle panel: Q‐PCR analysis for the expression level of miR‐690 in sEVs isolated from TA muscles of AAV‐ctrl mice and AAV‐miR‐690‐sponge mice, respectively. Right panel: Q‐PCR analysis for the expression level of mef2c in TA muscles of AAV‐ctrl mice and AAV‐miR‐690‐sponge mice. (C) Left panel: The representative images of immunofluorescent staining for Pax7 (red) and MyoD (green) in TA section from AAV‐ctrl and AAV‐miR‐690‐sponge mice. Nuclei were labelled by DAPI (blue). Scale bars, 50 μm. Right panel: The average number of Pax7+ MyoD+ cells per TA section of AAV‐ctrl and AAV‐miR‐690‐sponge mice, respectively. (D) Q‐PCR analysis for the expression levels of the muscle atrophy‐related marker genes including atrogin‐1 and murf‐1 in TA muscles of AAV‐ctrl mice and AAV‐miR‐690‐sponge mice, respectively. (E) Left panel: The representative images of immunofluorescent staining for laminin in cryosection of TA muscles from AAV‐ctrl mice and AAV‐miR‐690‐sponge, respectively. Scale bars, 100 μm. Right panel: Semi‐quantitative analysis for fCSA of TA muscle in AAV‐ctrl mice and AAV‐miR‐690‐sponge mice, respectively. (F) Left panel: The representative curve of tetanic force generated by tetanic stimulation in EDL from AAV‐ctrl and AAV‐miR‐690‐sponge mice, respectively. Right panel: The maximal tetanic force of EDL from AAV‐ctrl and AAV‐miR‐690‐sponge mice, respectively. Notes: Data are presented as means ± SEM. *P < 0.05, **P < 0.01, ***P < 0.001 by Student's t‐test. N = 6 for group (B, C, D, E); n = 5 for group (F). EDL, extensor digitorum longus; fCSA, fibre cross‐sectional area; TA, tibialis anterior.

References

    1. Mayhew AJ, Amog K, Phillips S, Parise G, McNicholas PD, de Souza RJ, Thabane L, Raina P. The prevalence of sarcopenia in community‐dwelling older adults, an exploration of differences between studies and within definitions: A systematic review and meta‐analyses. Age Ageing 2019;48:48–56. - PubMed
    1. Cruz‐Jentoft AJ, Bahat G, Bauer J, Boirie Y, Bruyère O, Cederholm T, Cooper C, Landi F, Rolland Y, Sayer AA, Schneider SM, Sieber CC, Topinkova E, Vandewoude M, Visser M, Zamboni M, Writing Group for the European Working Group on Sarcopenia in Older People 2 (EWGSOP2), and the Extended Group for EWGSOP2 , Bautmans I, Baeyens JP, Cesari M, Cherubini A, Kanis J, Maggio M, Martin F, Michel JP, Pitkala K, Reginster JY, Rizzoli R, Sánchez‐Rodríguez D, Schols J. Sarcopenia: Revised European consensus on definition and diagnosis. Age Ageing 2019;48:16–31. - PMC - PubMed
    1. Beaudart C, Zaaria M, Pasleau F, Reginster JY, Bruyere O. Health outcomes of sarcopenia: A systematic review and meta‐analysis. PLoS ONE 2017;12:e0169548. - PMC - PubMed
    1. Siriett V, Salerno MS, Berry C, Nicholas G, Bower R, Kambadur R, Sharma M. Antagonism of myostatin enhances muscle regeneration during sarcopenia. Mole Ther:J Am Soc Gene Ther 2007;15:1463–1470. - PubMed
    1. Lees SJ, Rathbone CR, Booth FW. Age‐associated decrease in muscle precursor cell differentiation. Am J Physiol Cell Physiol 2006;290:C609–C615. - PubMed

Publication types

MeSH terms