. 2022 Sep;11(9):3187-3208.
doi: 10.21037/tcr-22-502.

A comprehensive pan-cancer analysis on the immunological role and prognostic value of TYMP in human cancers

Affiliations

A comprehensive pan-cancer analysis on the immunological role and prognostic value of TYMP in human cancers

Yalan Yang et al. Transl Cancer Res. 2022 Sep.

Abstract

Background: The TYMP gene encodes an important nucleoside metabolism enzyme which is a rate-limiting enzyme for chemotherapeutic drug metabolism. Previous studies have shown that TYMP is highly expressed in many different tumors, promoting invasiveness and progression, and that it helps to predict the response to chemotherapeutic drugs. However, the role of TYMP in tumor immunity and prognosis remains largely unclear. The purpose of this pan-cancer analysis was to acquire more data on the function of TYMP function and its clinical significance.

Methods: To access the TYMP expression, we accessed datasets from The Cancer Genome Atlas (TCGA), Oncomine, Gene Expression Profiling Interactive Analysis (GEPIA), Cancer Cell Line Encyclopedia (CCLE) databases, and analyzed its differential expression between paired tumor and normal samples. We employed PrognoScan and Kaplan-Meier plotter for survival analyses. TYMP mutations were analyzed using cBioPortal. Correlations of TYMP with tumor stage, tumor mutational burden (TMB), microsatellite instability (MSI), immune checkpoint genes (ICGs), and immune cell infiltration were estimated via bioinformatics tools and methods. The CellMiner database was used to predict drug response. Gene set enrichment analysis (GSEA) was applied to explore the biological functions of TYMP in different tumors.

Results: Our results indicated that TYMP was overexpressed and also significantly associated with a worse prognosis in several human cancers, such as kidney clear cell carcinoma (KIRC) and lower grade glioma (LGG). TYMP was also associated with TMB, MSI, and ICGs across a variety of malignancies. TYMP was most significantly correlated with immune cell infiltration in five tumors, namely, breast cancer (BRCA), cervical cancer (CESC), KIRC, skin cutaneous melanoma (SKCM), and stomach adenocarcinoma (STAD). Moreover, TYMP expression predicted sensitivity to chemotherapy drugs and also influenced relevant biological pathways, according to enrichment analysis.

Conclusions: According to the results of this comprehensive analysis, TYMP is associated with prognosis and tumor immunology, which might make it be a potential therapeutic target for cancer treatment.

Keywords: TYMP; immune infiltration; pan-cancer analysis; prognosis; tumor mutational burden (TMB).


Conflict of interest statement

Conflicts of Interest: All authors have completed the ICMJE uniform disclosure form (available at https://tcr.amegroups.com/article/view/10.21037/tcr-22-502/coif). The authors have no conflicts of interest to declare.

Figures

Figure 1
Figure 1
TYMP gene expression levels in normal tissues, tumor tissues, and cancer cell lines (A) TYMP expression in different cancers and matched normal tissues, assessed using the Oncomine database. (B) Differential expression of TYMP in 33 human cancer types based on the TCGA database. (*P<0.05; **P<0.01; ***P<0.001). (C) The level of TYMP expression in different cancers and paired normal tissues from the GEPIA database (*P<0.05). (D) TYMP expression in different cancer lines, from the CCLE database. CNS, central nervous system; ACC, adrenocortical cancer; BLCA, bladder cancer; BRCA, breast cancer; CESC, cervical cancer; CHOL, bile duct cancer; COAD, colon cancer; DLBC, large B-cell lymphoma; ESCA, esophageal cancer; GBM, glioblastoma; HNSC, head and neck cancer; KICH, kidney chromophobe; KIRC, kidney clear cell carcinoma; KIRP, kidney papillary cell carcinoma; LAML, acute myeloid leukemia; LGG, lower grade glioma; LIHC, liver cancer; LUAD, lung adenocarcinoma; LUSC, lung squamous cell carcinoma; MESO, mesothelioma; OV, ovarian cancer; PAAD, pancreatic cancer; PCPG, pheochromocytoma and paraganglioma; PRAD, prostate adenocarcinoma; READ, rectal cancer; SARC, sarcoma; SKCM, skin cutaneous melanoma; STAD, stomach adenocarcinoma; TGCT, testicular cancer; THCA, thyroid cancer; THYM, thymoma; UCEC, endometrioid cancer; UCS, uterine carcinosarcoma; UVM, uveal melanomas; TPM, transcripts per million; TCGA, The Cancer Genome Atlas; GEPIA, Gene Expression Profiling Interactive Analysis; CCLE, Cancer Cell Line Encyclopedia.
Figure 2
Figure 2
The correlation between the expression of TYMP and patient prognosis using R software. (A) Forest plot of OS across cancers. (B) Forest plot of DSS in pan-cancer. (C) Forest plot of DFI in pan-cancer. (D) Forest plot of PFI in pan-cancer. (E) Kaplan-Meier survival analysis for OS and TYMP expression. The P value of each tumor: ACC: P=0.013; LGG: P<0.001; KIRC: P=0.005; THYM: P=0.049; SKCM: P=0.009; UVM: P<0.001. ACC, adrenocortical cancer; BLCA, bladder cancer; BRCA, breast cancer; CESC, cervical cancer; CHOL, bile duct cancer; COAD, colon cancer; DLBC, large B-cell lymphoma; ESCA, esophageal cancer; GBM, glioblastoma; HNSC, head and neck cancer; KICH, kidney chromophobe; KIRC, kidney clear cell carcinoma; KIRP, kidney papillary cell carcinoma; LAML, acute myeloid leukemia; LGG, lower grade glioma; LIHC, liver cancer; LUAD, lung adenocarcinoma; LUSC, lung squamous cell carcinoma; MESO, mesothelioma; OV, ovarian cancer; PAAD, pancreatic cancer; PCPG, pheochromocytoma and paraganglioma; PRAD, prostate adenocarcinoma; READ, rectal cancer; SARC, sarcoma; SKCM, skin cutaneous melanoma; STAD, stomach adenocarcinoma; TGCT, testicular cancer; THCA, thyroid cancer; THYM, thymoma; UCEC, endometrioid cancer; UCS, uterine carcinosarcoma; UVM, uveal melanomas; OS, overall survival; DSS, disease-specific survival; DFI, disease-free interval; PFI, progression-free interval.
Figure 3
Figure 3
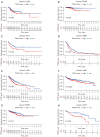
Correlations of TYMP expression and DSS determined by Kaplan-Meier analysis using R software. (A-G) Kaplan-Meier survival analysis for DSS and TYMP expression. The P value of each tumor: BRCA: P=0.009; SKCM: P<0.001; KIRC: P=0.020; LGG: P<0.001; ACC: P=0.014; THYM: P=0.021; UVM: P<0.001. BRCA, breast cancer; SKCM, skin cutaneous melanoma; KIRC, kidney clear cell carcinoma; LGG, lower grade glioma; ACC, adrenocortical cancer; THYM, thymoma; UVM, uveal melanomas; DSS, disease-specific survival.
Figure 4
Figure 4
Correlations between TYMP expression and DFI and PFI by Kaplan-Meier analysis using R software. (A,B) Kaplan-Meier survival analysis for DFI and TYMP expression. (C-H) Kaplan-Meier survival analysis for PFI and expression. The P value of each tumor: LUAD: P=0.045; PRAD: P=0.003; ACC: P=0.032; GBM: P=0.022; LGG: P<0.001; KIRC: P=0.020; PRAD: P=0.017; UVM: P=0.005. LUAD, lung adenocarcinoma; PRAD, prostate adenocarcinoma; ACC, adrenocortical cancer; GBM, glioblastoma; LGG, lower grade glioma; KIRC, kidney clear cell carcinoma; UVM, uveal melanomas; DFI, disease-free interval; PFI, progression-free interval.
Figure 5
Figure 5
Genetic mutations of TYMP and survival across different cancers as assessed by cBioPortal tool analysis. (A) Frequency of TYMP mutations in different tumor types. (B) Types, sites and number of case with TYMP genetic alterations in pan-cancer from cBioPortal. (C) Kaplan-Meier curves of OS, DSS, DFS, and PFS in cancers with genetic alterations in TYMP. TCGA, The Cancer Genome Atlas; OS, overall survival; DSS, disease-specific survival; DFS, disease-free survival; PFS, progress-free survival.
Figure 6
Figure 6
Relationship between TYMP expression and tumor stage in cancer patients based on TCGA represented by stage plots (A), relationship between TYMP expression TMB (B) in cancer patients based on TCGA represented by radar maps (*P<0.05; **P<0.01; ***P<0.001; meaningful P values in cancers, BRCA: P=0.0003, CESC: P=0.023; COAD: P=6.99372605004755e-06; ESCA: P=0.012; KIRC: P=0.0003; KIRP: P=0.0147; LAML: P=0.0028; LGG: P=7.80820021923056e-07; LUSC: P=0.0308; SARC: P=0.036; TGCT: P=0.0150; THCA: P=0.0007; THYM: P=0.0090; UCEC: P=0.0076; UCS: P=0.0386). Relationship between TYMP expression MSI (C) in cancer patients based on TCGA represented by radar maps. (*P<0.05; **P<0.01; ***P<0.001; meaningful P values in cancers, CHOL: P=0.0080; COAD: P=5.22958938728024e-06; ESCA: P=0.0027; LUAD: P=0.0498; OV: P=0.0092; PAAD: P=0.0346; PRAD: P=0.0326; READ; P=0.0091; TGCT: P=5.22958938728024e-06; THCA: P=0.0140). ACC, adrenocortical cancer; BLCA, bladder cancer; KIRC, kidney clear cell carcinoma; KICH, kidney chromophobe; KIRP, kidney papillary cell carcinoma; LUAD, lung adenocarcinoma; ESCA, esophageal cancer; TGCT, testicular cancer; COAD, colon cancer; STAD, stomach adenocarcinoma; PAAD, pancreatic cancer; THCA, thyroid cancer; BRCA, breast cancer; CESC, cervical cancer; CHOL, bile duct cancer; DLBC, large B-cell lymphoma; GBM, glioblastoma; HNSC, head and neck cancer; LAML, acute myeloid leukemia; LGG, lower grade glioma; LIHC, liver cancer; LUSC, lung squamous cell carcinoma; MESO, mesothelioma; OV, ovarian cancer; PCPG, pheochromocytoma and paraganglioma; PRAD, prostate adenocarcinoma; READ, rectal cancer; SARC, sarcoma; SKCM, skin cutaneous melanoma; THYM, thymoma; UCEC, endometrioid cancer; UCS, uterine carcinosarcoma; UVM, uveal melanomas; TCGA, The Cancer Genome Atlas; TMB, tumor mutational burden; MSI, microsatellite instability.
Figure 7
Figure 7
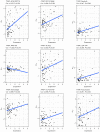
Relationships between TYMP expression and the tumor immune microenvironment. The top 5 tumors with the highest immune cell scores or stromal cell scores calculated by the ESTIMATE algorithm method. (A) Correlations of TYMP expression and immune cell scores in KICH, OV, PCPG, SARC, and TGCT. (B) Correlations of TYMP expression and stromal cell scores in GBM, KICH, LGG, PCPG, and UVM. KICH, kidney renal clear cell carcinoma; OV, ovarian cancer; PCPG, pheochromocytoma and paraganglioma; SARC, sarcoma; TGCT, testicular; GBM, glioblastoma; LGG, lower grade glioma; UVM, uveal melanomas.
Figure 8
Figure 8
Relationship between TYMP expression and 47 ICGs depicted in a heatmap. *P<0.05; **P<0.01; ***P<0.001. ACC, adrenocortical cancer; BLCA, bladder cancer; BRCA, breast cancer; CESC, cervical cancer; CHOL, bile duct cancer; COAD, colon cancer; DLBC, large B-cell lymphoma; ESCA, esophageal cancer; GBM, glioblastoma; HNSC, head and neck cancer; KICH, kidney chromophobe, KIRC, kidney clear cell carcinoma; KIRP, kidney papillary cell carcinoma; LAML, acute myeloid leukemia; LGG, lower grade glioma; LIHC, liver cancer; LUAD, lung adenocarcinoma; LUSC, lung squamous cell carcinoma; MESO, mesothelioma; OV, ovarian cancer; PAAD, pancreatic cancer; PCPG, pheochromocytoma and paraganglioma; PRAD, prostate adenocarcinoma; READ, rectal cancer; SARC, sarcoma; SKCM, skin cutaneous melanoma; STAD, stomach adenocarcinoma; TGCT, testicular cancer; THCA, thyroid cancer; THYM, thymoma; UCEC, endometrioid cancer; UCS, uterine carcinosarcoma; UVM, uveal melanomas; ICGs, immune checkpoint genes.
Figure 9
Figure 9
Associations of TYMP gene expression with sensitivity to chemotherapy (IC50) based on the CellMiner database using Pearson correlation analysis. IC50, half maximal inhibitory concentration.
Figure 10
Figure 10
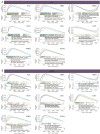
GSEA of TYMP expression. (A) The top 8 results from the GO analysis of TYMP in cancers. (B) The top 8 results from KEGG pathway enrichment analysis of TYMP in cancers. GO, Gene Ontology; ACC, adrenocortical cancer; GBM, glioblastoma; HNSC, head and neck cancer; KICH, kidney chromophobe; LGG, lower grade glioma; LIHC, liver cancer; PRAD, prostate adenocarcinoma; PCPG, pheochromocytoma and paraganglioma; KEGG, Kyoto Encyclopedia of Genes and Genomes; GSEA, gene set enrichment analysis.

Similar articles

Cited by

References

    1. Sung H, Ferlay J, Siegel RL, et al. Global Cancer Statistics 2020: GLOBOCAN Estimates of Incidence and Mortality Worldwide for 36 Cancers in 185 Countries. CA Cancer J Clin 2021;71:209-49. 10.3322/caac.21660 - DOI - PubMed
    1. Steeg PS. Targeting metastasis. Nat Rev Cancer 2016;16:201-18. 10.1038/nrc.2016.25 - DOI - PMC - PubMed
    1. Kishton RJ, Sukumar M, Restifo NP. Metabolic Regulation of T Cell Longevity and Function in Tumor Immunotherapy. Cell Metab 2017;26:94-109. 10.1016/j.cmet.2017.06.016 - DOI - PMC - PubMed
    1. Ribas A, Wolchok JD. Cancer immunotherapy using checkpoint blockade. Science 2018;359:1350-5. 10.1126/science.aar4060 - DOI - PMC - PubMed
    1. Wang J, Chen W, Wang F, et al. Nutrition Therapy for Mitochondrial Neurogastrointestinal Encephalopathy with Homozygous Mutation of the TYMP Gene. Clin Nutr Res 2015;4:132-6. 10.7762/cnr.2015.4.2.132 - DOI - PMC - PubMed