

Development and validation of a prognostic nomogram for predicting cancer-specific survival in patients with metastatic clear cell renal carcinoma: A study based on SEER database
- PMID: 36237316
- PMCID: PMC9552762
- DOI: 10.3389/fonc.2022.949058
Development and validation of a prognostic nomogram for predicting cancer-specific survival in patients with metastatic clear cell renal carcinoma: A study based on SEER database
Abstract
Objectives: Clear cell renal cell carcinoma (ccRCC) is highly prevalent, prone to metastasis, and has a poor prognosis after metastasis. Therefore, this study aimed to develop a prognostic model to predict the individualized prognosis of patients with metastatic clear cell renal cell carcinoma (mccRCC).
Patients and methods: Data of 1790 patients with mccRCC, registered from 2010 to 2015, were extracted from the Surveillance, Epidemiology and End Results (SEER) database. The included patients were randomly divided into a training set (n = 1253) and a validation set (n = 537) based on the ratio of 7:3. The univariate and multivariate Cox regression analyses were used to identify the important independent prognostic factors. A nomogram was then constructed to predict cancer specific survival (CSS). The performance of the nomogram was internally validated by using the concordance index (C-index), calibration plots, receiver operating characteristic curves, net reclassification improvement (NRI), integrated discrimination improvement (IDI), and decision curve analysis (DCA). We compared the nomogram with the TNM staging system. Kaplan-Meier survival analysis was applied to validate the application of the risk stratification system.
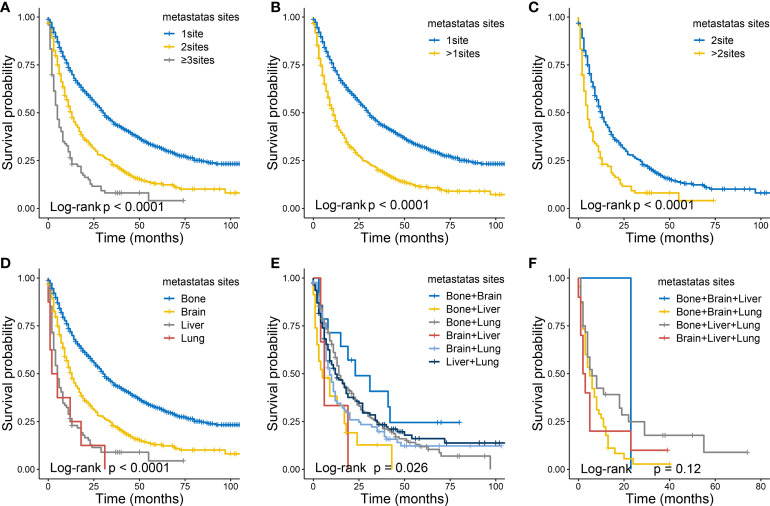
Results: Diagnostic age, T-stage, N-stage, bone metastases, brain metastases, liver metastases, lung metastases, chemotherapy, radiotherapy, surgery, and histological grade were identified as independent predictors of CSS. The C-index of training and validation sets are 0.707 and 0.650 respectively. In the training set, the AUC of CSS predicted by nomogram in patients with mccRCC at 1-, 3- and 5-years were 0.770, 0.758, and 0.757, respectively. And that in the validation set were 0.717, 0.700, and 0.700 respectively. Calibration plots also showed great prediction accuracy. Compared with the TNM staging system, NRI and IDI results showed that the predictive ability of the nomogram was greatly improved, and DCA showed that patients obtained clinical benefits. The risk stratification system can significantly distinguish the patients with different survival risks.
Conclusion: In this study, we developed and validated a nomogram to predict the CSS rate in patients with mccRCC. It showed consistent reliability and clinical applicability. Nomogram may assist clinicians in evaluating the risk factors of patients and formulating an optimal individualized treatment strategy.
Keywords: Surveillance, Epidemiology, and End Results (SEER); metastatic clear cell renal cell carcinoma; nomogram; prognosis; survival analysis.
Copyright © 2022 Huang, Liao, Cai, Chen, Qin, Ba, Rao, Zhong, Lin, Liang, Wei, Li, Deng, Li, Guo, Wang and Zhuo.
Conflict of interest statement
The authors declare that the research was conducted in the absence of any commercial or financial relationships that could be construed as a potential conflict of interest.
Figures


Similar articles
-
Development and validation of a prognostic nomogram for predicting overall survival in patients with primary bladder sarcoma: a SEER-based retrospective study.BMC Urol. 2021 Nov 25;21(1):162. doi: 10.1186/s12894-021-00929-x. BMC Urol. 2021. PMID: 34823525 Free PMC article.
-
Nomogram for predicting cancer-specific survival of patients with clear-cell renal cell carcinoma: a SEER-based population study.Gen Physiol Biophys. 2022 Nov;41(6):591-601. doi: 10.4149/gpb_2022040. Gen Physiol Biophys. 2022. PMID: 36454119 Clinical Trial.
-
A Web-Based Prediction Model for Cancer-Specific Survival of Elderly Patients With Clear Cell Renal Cell Carcinoma: A Population-Based Study.Front Public Health. 2022 Mar 3;9:833970. doi: 10.3389/fpubh.2021.833970. eCollection 2021. Front Public Health. 2022. PMID: 35310783 Free PMC article. Clinical Trial.
-
Analysis of prognostic factors of metastatic endometrial cancer based on surveillance, epidemiology, and end results database.Front Surg. 2023 Jan 6;9:1001791. doi: 10.3389/fsurg.2022.1001791. eCollection 2022. Front Surg. 2023. PMID: 36684133 Free PMC article. Review.
-
Analysis of prognostic factors and risk prediction in brain metastases: a SEER population-based study.Front Oncol. 2025 May 21;15:1523069. doi: 10.3389/fonc.2025.1523069. eCollection 2025. Front Oncol. 2025. PMID: 40469182 Free PMC article.
Cited by
-
A Novel Nomogram for the Prediction and Evaluation of Prognosis in Patients with Early-onset Kidney Cancer: a Population-based Study.J Cancer. 2025 Jan 13;16(4):1189-1201. doi: 10.7150/jca.104569. eCollection 2025. J Cancer. 2025. PMID: 39895778 Free PMC article.
-
Immune infiltration and prognosis in gastric cancer: role of NAD+ metabolism-related markers.PeerJ. 2024 Jul 31;12:e17833. doi: 10.7717/peerj.17833. eCollection 2024. PeerJ. 2024. PMID: 39099656 Free PMC article.
-
Are We Accurately Predicting Mortality in Renal Cancer? A Systematic Review of Prognostic Models.J Clin Med. 2025 Aug 19;14(16):5851. doi: 10.3390/jcm14165851. J Clin Med. 2025. PMID: 40869676 Free PMC article. Review.
-
A dynamic visualization clinical tool constructed and validated based on the SEER database for screening the optimal surgical candidates for bone metastasis in primary kidney cancer.Sci Rep. 2024 Feb 12;14(1):3561. doi: 10.1038/s41598-024-54085-x. Sci Rep. 2024. PMID: 38347099 Free PMC article.
-
Two simple-to-use web-based nomograms to predict overall survival and cancer-specific survival in patients with extremity fibrosarcoma.Front Oncol. 2023 Feb 13;12:942542. doi: 10.3389/fonc.2022.942542. eCollection 2022. Front Oncol. 2023. PMID: 36861108 Free PMC article.
References
LinkOut - more resources
Full Text Sources