

Comparison of COVID-19 and seasonal influenza under different intensities of non-pharmaceutical interventions and vaccine effectiveness
- PMID: 36238257
- PMCID: PMC9551384
- DOI: 10.3389/fpubh.2022.973088
Comparison of COVID-19 and seasonal influenza under different intensities of non-pharmaceutical interventions and vaccine effectiveness
Abstract
Background: The COVID-19 pandemic has lasted more than 2 years, and the global epidemic prevention and control situation remains challenging. Scientific decision-making is of great significance to people's production and life as well as the effectiveness of epidemic prevention and control. Therefore, it is all the more important to explore its patterns and put forward countermeasures for the pandemic of respiratory infections.
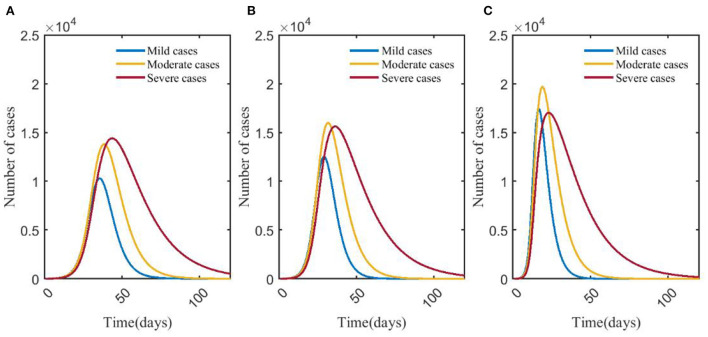
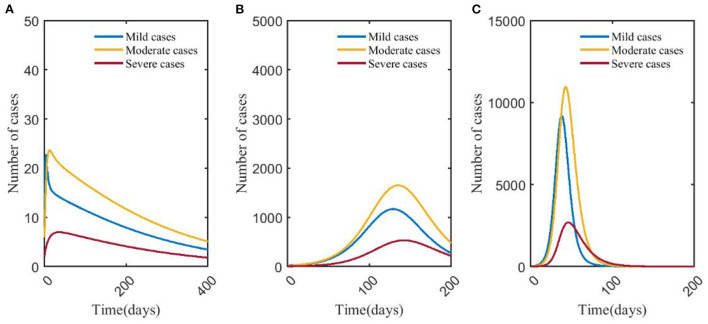
Methods: Modeling of epidemiological characteristics was conducted based on COVID-19 and influenza characteristics using improved transmission dynamics models to simulate the number of COVID-19 and influenza infections in different scenarios in a hypothetical city of 100,000 people. By comparing the infections of COVID-19 and influenza in different scenarios, the impact of the effectiveness of vaccination and non-pharmaceutical interventions (NPIs) on disease trends can be calculated. We have divided the NPIs into three levels according to the degree of restriction on social activities (including entertainment venues, conventions, offices, restaurants, public transport, etc.), with social controls becoming progressively stricter from level 1 to level 3.
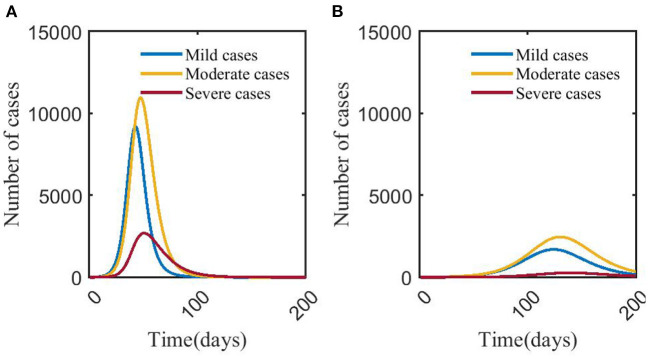
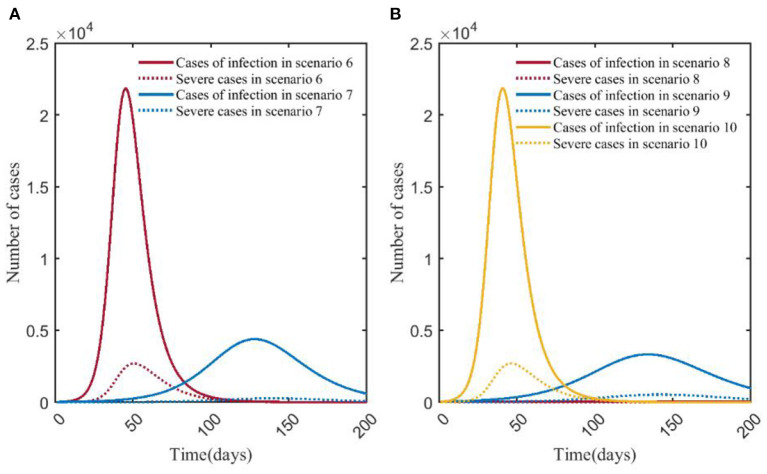
Results: In the simulated scenario where susceptible individuals were vaccinated with three doses of COVID-19 coronaVac vaccine, the peak number of severe cases was 26.57% lower than that in the unvaccinated scenario, and the peak number of infection cases was reduced by 10.16%. In the scenario with level three NPIs, the peak number of severe cases was reduced by 7.79% and 15.43%, and the peak number of infection cases was reduced by 12.67% and 28.28%, respectively, compared with the scenarios with NPIs intensity of level 2 and level 1. For the influenza, the peak number of severe cases in the scenario where the entire population were vaccinated was 89.85%, lower than that in the unvaccinated scenario, and the peak number of infections dropped by 79.89%.
Conclusion: The effectiveness of COVID-19 coronaVac vaccine for preventing severe outcomes is better than preventing infection; for the prevention and control of influenza, we recommend influenza vaccination as a priority over strict NPIs in the long term.
Keywords: COVID-19 pandemic; non-pharmaceutical interventions; seasonal influenza; transmission dynamics model; vaccine.
Copyright © 2022 Chen, Wang, Li, Ma, Zhang, Chen and Zhang.
Conflict of interest statement
The authors declare that the research was conducted in the absence of any commercial or financial relationships that could be construed as a potential conflict of interest.
Figures


Similar articles
-
Effectiveness of a scenario-based, community-based intervention in containing COVID-19 in China.Front Public Health. 2024 Nov 27;12:1449305. doi: 10.3389/fpubh.2024.1449305. eCollection 2024. Front Public Health. 2024. PMID: 39664544 Free PMC article.
-
Analysis of the effectiveness of non-pharmaceutical interventions on influenza during the Coronavirus disease 2019 pandemic by time-series forecasting.BMC Infect Dis. 2023 Oct 24;23(1):717. doi: 10.1186/s12879-023-08640-y. BMC Infect Dis. 2023. PMID: 37875817 Free PMC article.
-
Influenza and COVID-19 co-infection and vaccine effectiveness against severe cases: a mathematical modeling study.Front Cell Infect Microbiol. 2024 Mar 4;14:1347710. doi: 10.3389/fcimb.2024.1347710. eCollection 2024. Front Cell Infect Microbiol. 2024. PMID: 38500506 Free PMC article.
-
Lifting non-pharmaceutical interventions following the COVID-19 pandemic - the quiet before the storm?Expert Rev Vaccines. 2022 Nov;21(11):1541-1553. doi: 10.1080/14760584.2022.2117693. Epub 2022 Sep 5. Expert Rev Vaccines. 2022. PMID: 36039786 Review.
-
[Consideration on implementation of co-administration of Seasonal Influenza and COVID-19 vaccines during pandemic in China].Zhonghua Yu Fang Yi Xue Za Zhi. 2022 Feb 6;56(2):103-107. doi: 10.3760/cma.j.cn112150-20211203-01117. Zhonghua Yu Fang Yi Xue Za Zhi. 2022. PMID: 34954956 Review. Chinese.
Cited by
-
Effectiveness of a scenario-based, community-based intervention in containing COVID-19 in China.Front Public Health. 2024 Nov 27;12:1449305. doi: 10.3389/fpubh.2024.1449305. eCollection 2024. Front Public Health. 2024. PMID: 39664544 Free PMC article.
-
Effectiveness of social distancing measures and lockdowns for reducing transmission of COVID-19 in non-healthcare, community-based settings.Philos Trans A Math Phys Eng Sci. 2023 Oct 9;381(2257):20230132. doi: 10.1098/rsta.2023.0132. Epub 2023 Aug 23. Philos Trans A Math Phys Eng Sci. 2023. PMID: 37611629 Free PMC article.
References
-
- World Health Organization. Coronavirus (COVID-19) Dashboard . (2022). Available online at: https://covid19.who.int/ (accessed August 4, 2022).
Publication types
MeSH terms
Substances
LinkOut - more resources
Full Text Sources
Medical