. 2022 Sep 27:13:981532.
doi: 10.3389/fimmu.2022.981532. eCollection 2022.

Dysregulated autoantibodies targeting vaso- and immunoregulatory receptors in Post COVID Syndrome correlate with symptom severity

Affiliations

Dysregulated autoantibodies targeting vaso- and immunoregulatory receptors in Post COVID Syndrome correlate with symptom severity

Franziska Sotzny et al. Front Immunol. .

Abstract

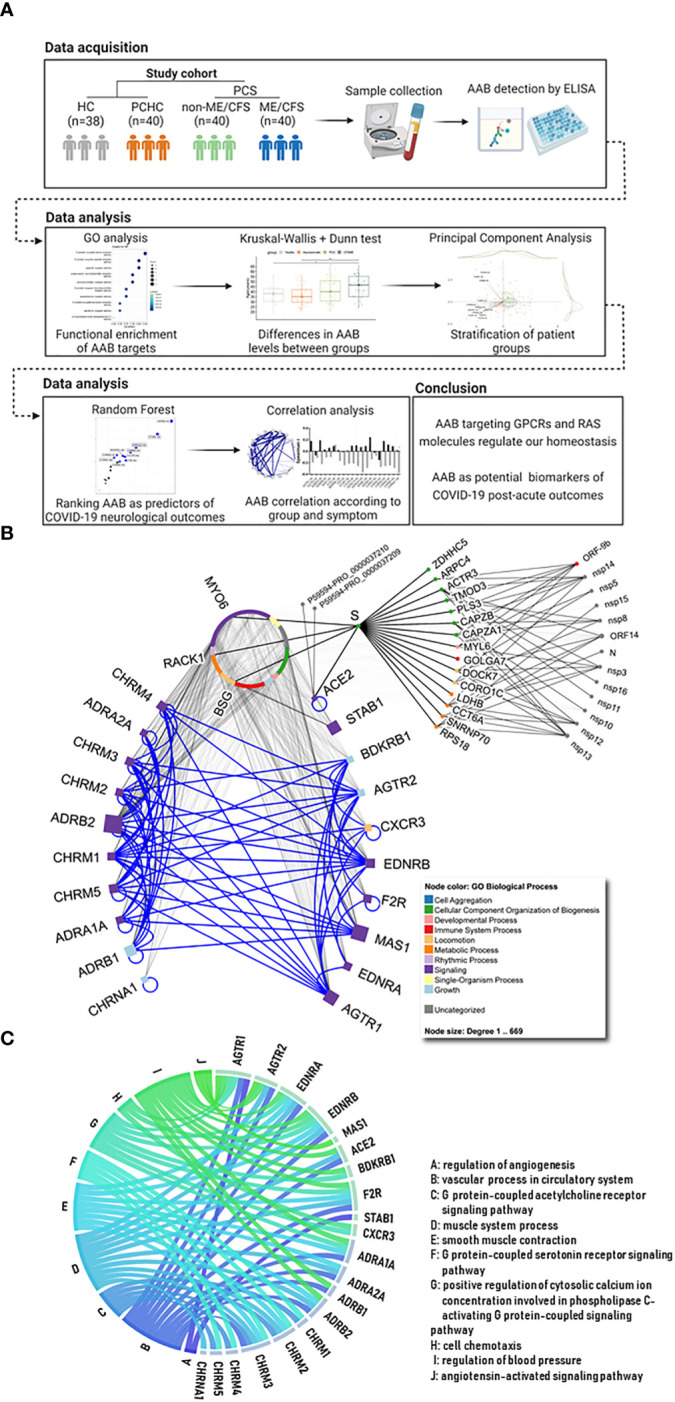
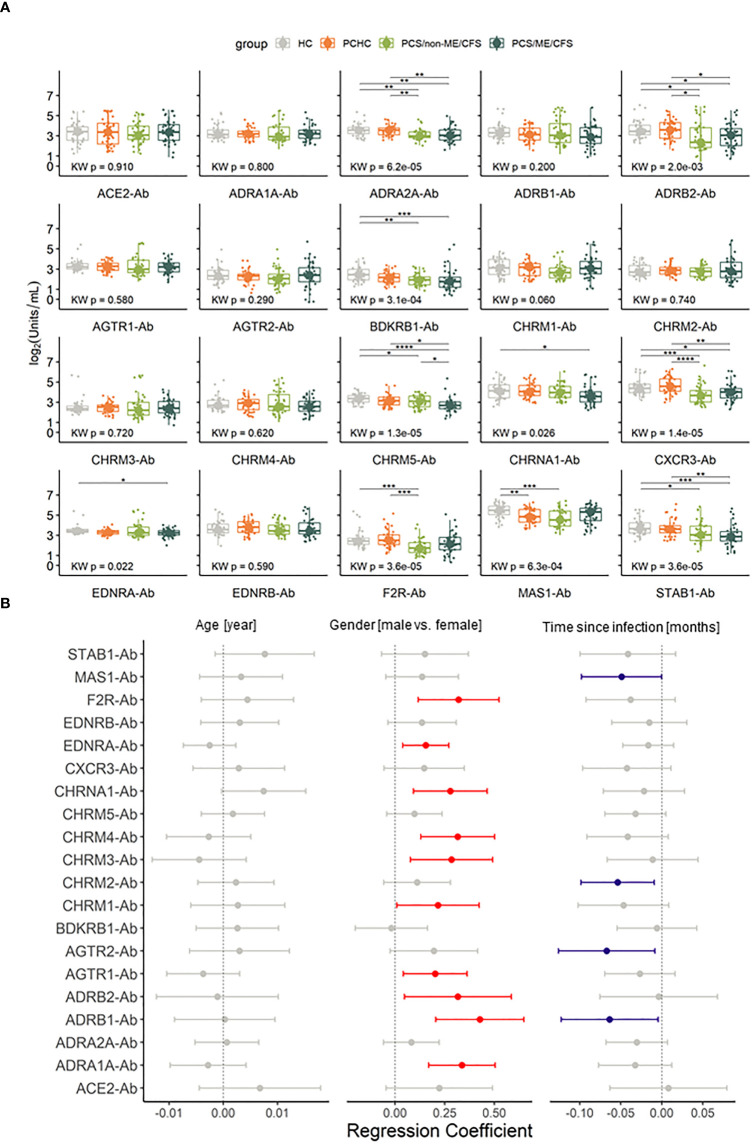
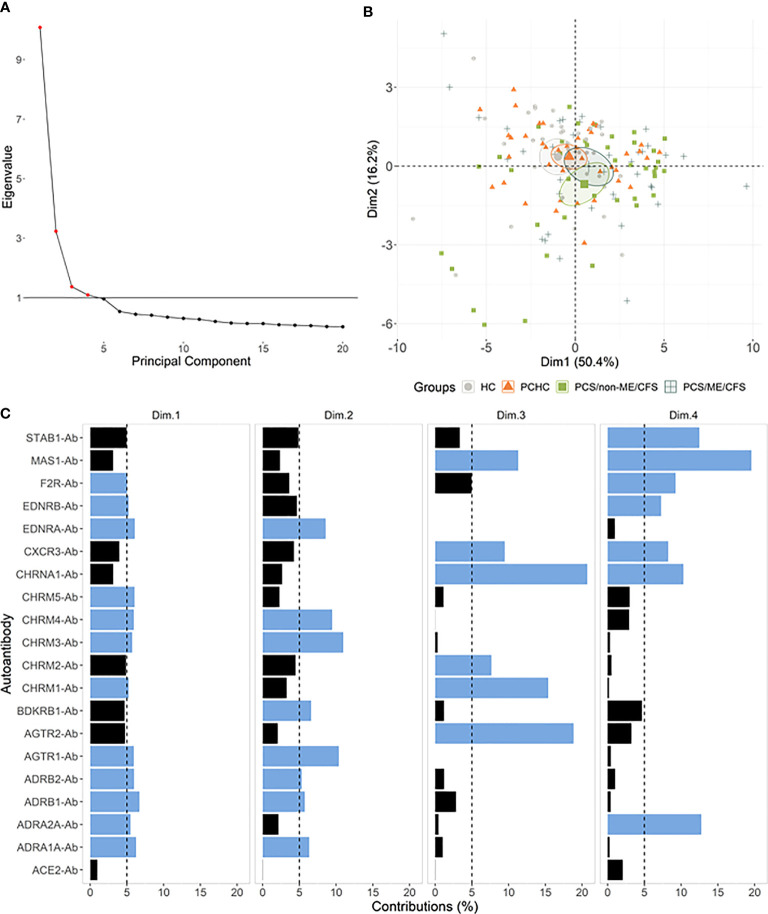
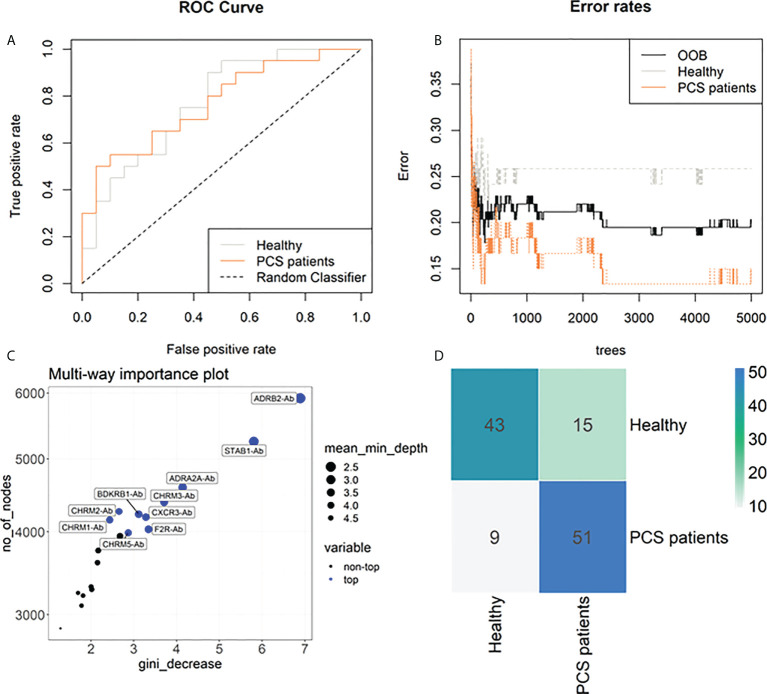
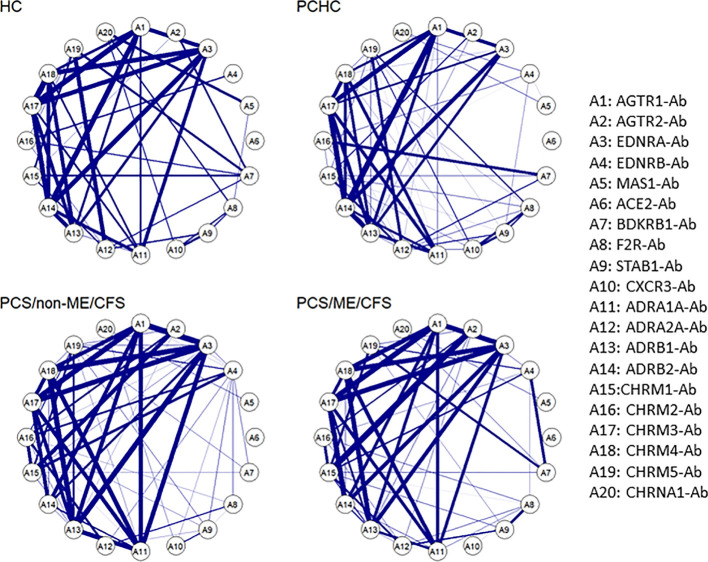
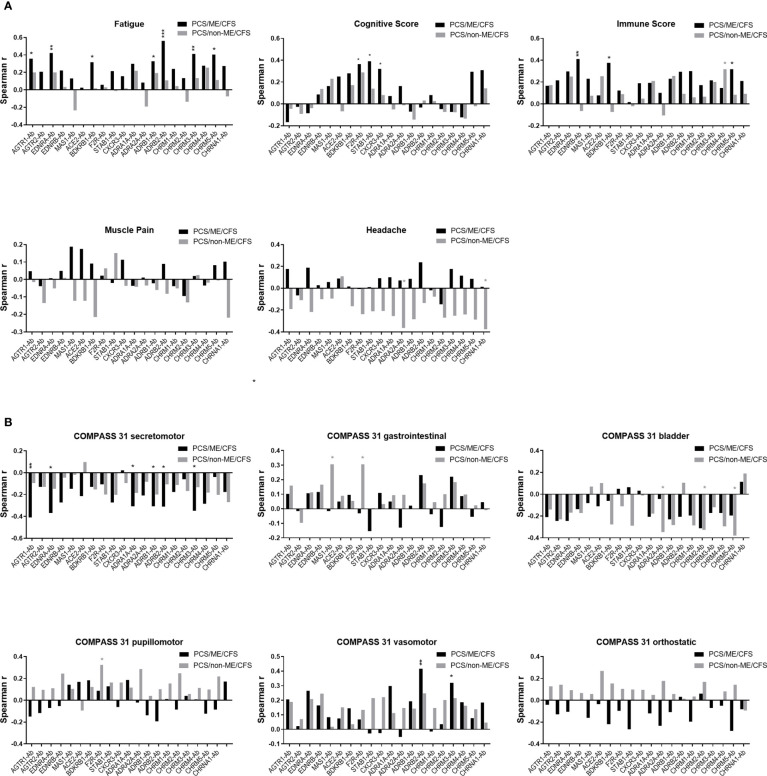
Most patients with Post COVID Syndrome (PCS) present with a plethora of symptoms without clear evidence of organ dysfunction. A subset of them fulfills diagnostic criteria of myalgic encephalomyelitis/chronic fatigue syndrome (ME/CFS). Symptom severity of ME/CFS correlates with natural regulatory autoantibody (AAB) levels targeting several G-protein coupled receptors (GPCR). In this exploratory study, we analyzed serum AAB levels against vaso- and immunoregulatory receptors, mostly GPCRs, in 80 PCS patients following mild-to-moderate COVID-19, with 40 of them fulfilling diagnostic criteria of ME/CFS. Healthy seronegative (n=38) and asymptomatic post COVID-19 controls (n=40) were also included in the study as control groups. We found lower levels for various AABs in PCS compared to at least one control group, accompanied by alterations in the correlations among AABs. Classification using random forest indicated AABs targeting ADRB2, STAB1, and ADRA2A as the strongest classifiers (AABs stratifying patients according to disease outcomes) of post COVID-19 outcomes. Several AABs correlated with symptom severity in PCS groups. Remarkably, severity of fatigue and vasomotor symptoms were associated with ADRB2 AAB levels in PCS/ME/CFS patients. Our study identified dysregulation of AAB against various receptors involved in the autonomous nervous system (ANS), vaso-, and immunoregulation and their correlation with symptom severity, pointing to their role in the pathogenesis of PCS.

Keywords: COVID-19; Chronic Fatigue Syndrome; G-protein coupled receptor; ME/CFS,; autoantibodies; autonomic nervous system; post COVID syndrome; renin-angiotensin system.


Conflict of interest statement

The authors declare that HH and KS-F are managing directors of CellTrend. CellTrend holds together with Charité a patent for the diagnostic use of AABs against ADRB2. CS has a consulting agreement with CellTrend. FP reports grants from the Guthy Jackson Charitable Foundation, during the conduct of the study. The remaining authors declare that the research was conducted in the absence of any commercial or financial relationships that could be construed as a potential conflict of interest. The handling editor MD declared a past co-authorship with the author YS.

Figures

Figure 1
Figure 1
Study workflow and description of autoantibody targets. (A) After data acquisition, different statistical analyses (written on the top) were carried out in order to characterize the signature of autoantibodies (AAB) against G protein coupled receptors (GPCRs) and COVID-19-associated molecules (e.g. renin-angiotensin system (RAS)) in Post COVID Syndrome (PCS) when compared with healthy controls (HC) and post COVID-19 healthy controls (PCHC). Created with Biorender. (B) The 10 squares on the left represent autonomic nervous system (ANS) related receptors, while the 10 on the right show non-ANS molecules and receptors (e.g. RAS, immune and circulatory systems). Blue edges in the network highlight the interactions among the AAB targets, while gray edges represent other interactions. Node colors map to Gene Ontology (GO) biological processes (BPs) and node size corresponds to number of interacting partners for each target. Circular nodes represent human and SARS-CoV-2 molecules (as well as two Spike (S) proteins with unspecified roles) that are described in the IMEx coronavirus interactome. Circular organization of the proteins on the top middle of the image represent interacting partners of the AAB targets (names are omitted, except for 3 proteins that link ACE2 via S). (C) Circular plot with targets and relevant pathways they are associated to. Edge colors differ between each pathway. Edges representing AAB pathways are named from A to J, and the corresponding name is present in the list.
Figure 2
Figure 2
Autoantibodies (-Ab) against G protein coupled receptors (GPCR) and COVID-19-associated molecules are dysregulated during Post COVID Syndrome (PCS). (A) Box plots of Ab investigated in PCS patients with and without ME/CFS and healthy controls post or without COVID-19 history (PCHC or HC). Significance determined by Kruskal Wallis test followed by Dunn test as post hoc. Dunn test p values were corrected for FDR. Adjusted p-values are being represented by: *p.adj < 0.05; **p.adj <0.01; ***p.adj < 0.001; ****p.adj < 0.0001. Boxes represent the median and interquartile range (IQR). (B) Forest plot of regression coefficients for the confounding factors age in years, gender (reference being female) and time post COVID-19 in months considering 95% confidence interval (CI). Red dots and CI indicate that variable has a positive influence in the Ab level, blue dots and CI indicate a negative influence and gray ones contain 0 in the confidence interval, therefore are taken as non significant.
Figure 3
Figure 3
Autoantibodies (-Ab) stratify patients by post-acute COVID-19 outcomes. (A) Principal component analysis (PCA) with spectral decomposition based on logarithmic values of 20 Abs show the stratification of the four studied groups. Variables pointing to the same sense of the corresponding principal components are positive correlated. Small ellipses are the concentration around the mean points of each group. (B) Graphs of variables (Abs) obtained by PCA of all individuals in this study. (C) Barplot with the contribution percentages of each variable to each dimension. A black dashed line is plotted on the 5% mark, and blue bars indicate a contribution higher than 5%.
Figure 4
Figure 4
Machine learning classification of study groups based on autoantibodies. (A) Receiver operating characteristic (ROC) curves of 20 antibodies (Abs) with an area under the curve (AUC) of 77% for healthy individuals and 77% for PCS patient group. (B) Stable curve showing number of trees and out-of-bag (OOB) error rate of 20.34%. (C) Variable importance score plot based on Gini decrease and number (no) of nodes, and the mean of minimum depth for each Ab, showing which variable presents a higher score in classifying COVID-19 post-acute infection outcomes. (D) Heatmap of the confusion matrix. Numbers represent the amount of occurrences that happened when training the random forest model in predicted (row) vs actual classification (column), therefore the blueish diagonal identifies the hits, while other cells are mismatches.
Figure 5
Figure 5
Autoantibody correlation signatures associate with post-acute infection outcome. Circular networks based on Spearman’s rank correlation for the level of the 20 autoantibodies (-Ab) in post COVID syndrome (PCS) patients with and without ME/CFS and healthy controls post or without COVID-19 history (PCHC or HC). There is a list with the abbreviations and the Abs names by the right side of the plot. Correlations greater than 0.6 are represented by the blue edges, and thicker edges imply greater correlations.
Figure 6
Figure 6
Correlation between autoantibody (-Ab) levels and clinical scores. Plots represent Spearman correlation coefficient (r) of correlation of Abs with (A) symptom scores and (B) autonomic symptom score assessed by COMPASS-31 questionnaire of PCS/non-ME/CFS (grey) and PCS/ME/CFS (black) patients. p values represented by: *p < 0.05, **p< 0.01 and ***p<0.001.

References

    1. Davis HE, Assaf GS, McCorkell L, Wei H, Low RJ, Re'em Y, et al. . Characterizing long COVID in an international cohort: 7 months of symptoms and their impact. EClinicalMedicine (2021), (38):101019. doi: 10.1016/j.eclinm.2021.101019 - DOI - PMC - PubMed
    1. Xie Y, Bowe B, Al-Aly Z. Burdens of post-acute sequelae of COVID-19 by severity of acute infection, demographics and health status. Nat Commun (2021) 12(1):6571. doi: 10.1038/s41467-021-26513-3 - DOI - PMC - PubMed
    1. Ceban F, Ling S, Lui LMW, Lee Y, Gill H, Teopiz KM, et al. . Fatigue and cognitive impairment in post-COVID-19 syndrome: A systematic review and meta-analysis. Brain Behav Immun (2021) 101:93–135. doi: 10.1016/j.bbi.2021.12.020 - DOI - PMC - PubMed
    1. Logue JK, Franko NM, McCulloch DJ, McDonald D, Magedson A, Wolf CR, et al. . Sequelae in adults at 6 months after COVID-19 infection. JAMA Netw Open (2021) 4(2):e210830. doi: 10.1001/jamanetworkopen.2021.0830 - DOI - PMC - PubMed
    1. Kedor C, Freitag H, Meyer-Arndt L, Wittke K, Hanitsch LG, Zoller T, et al. . A prospective observational study of post-COVID-19 chronic fatigue syndrome following the first pandemic wave in Germany and biomarkers associated with symptom severity. Nature communications (2022) 13(1):5104. doi: 10.1038/s41467-022-32507-6 - DOI - PMC - PubMed

Publication types