. 2022 Sep 27:9:965654.
doi: 10.3389/fnut.2022.965654. eCollection 2022.

Glucocorticoids in preterm human milk

Collaborators, Affiliations

Glucocorticoids in preterm human milk

Mariana Muelbert et al. Front Nutr. .

Abstract

Background: Glucocorticoids (GCs), cortisol and cortisone, are essential regulators of many physiological responses, including immunity, stress and mammary gland function. GCs are present in human milk (HM), but whether maternal and infant factors are associated with HM GC concentration following preterm birth is unclear.

Materials and methods: HM samples were collected on postnatal day 5 and 10 and at 4 months' corrected age (4m CA) in a cohort of moderate- and late-preterm infants. GCs in HM were measured by liquid chromatography-tandem mass spectrometry. Relationships between GCs in HM and both maternal and infant characteristics were investigated using Spearman's correlations and linear mixed models.

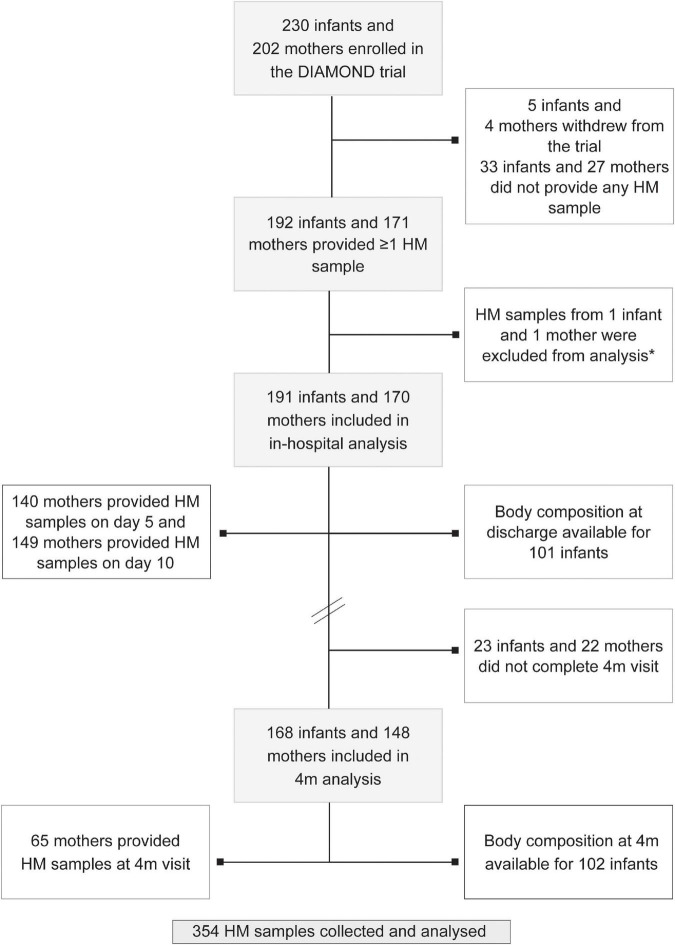
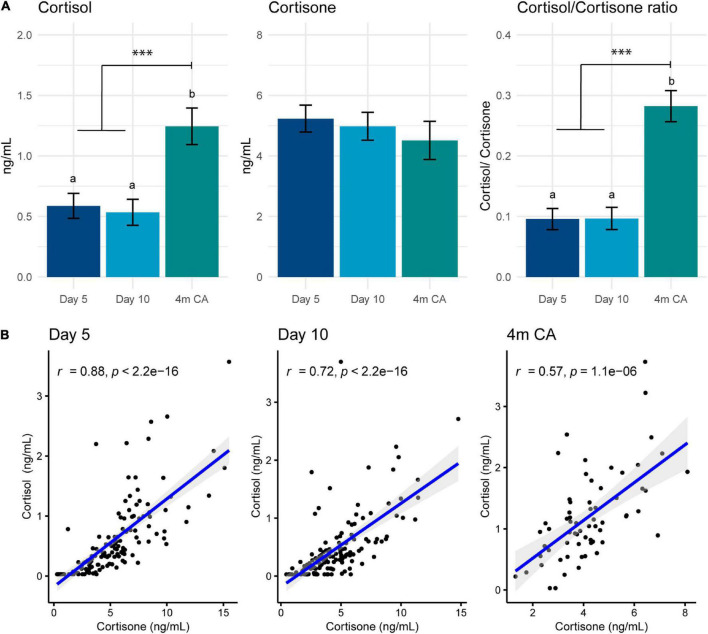
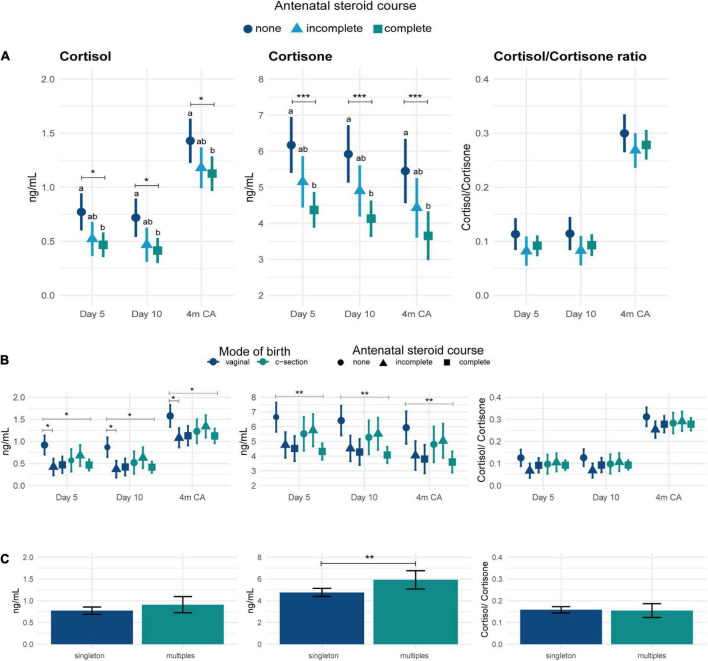
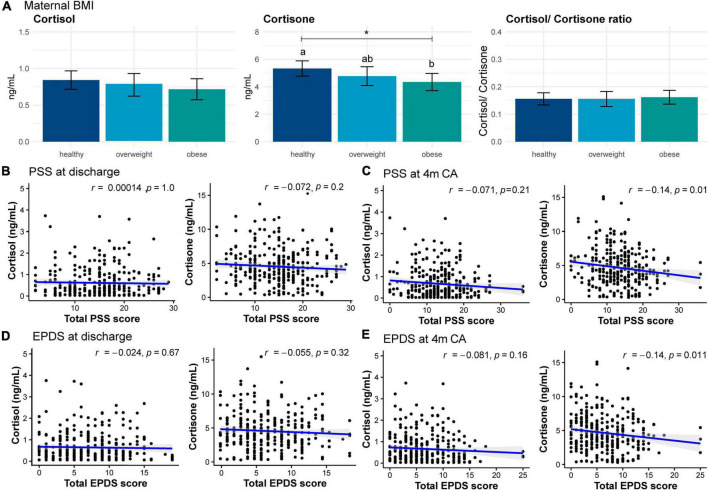
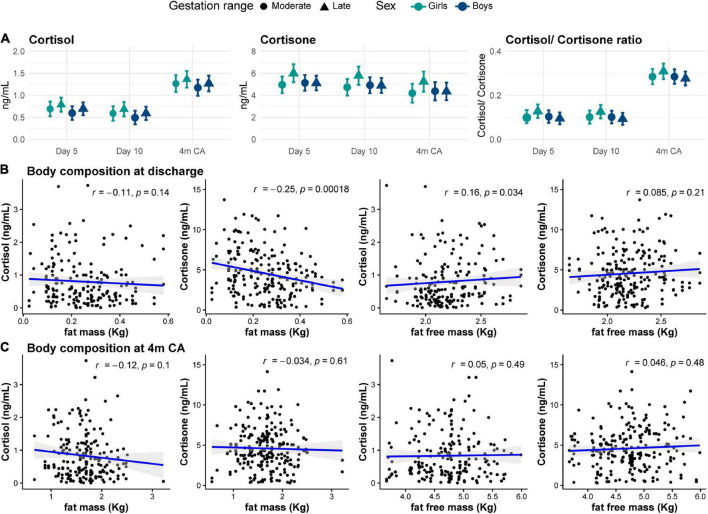
Results: 170 mothers of 191 infants provided 354 HM samples. Cortisol concentrations in HM increased from postnatal day 5-4m CA (mean difference [MD] 0.6 ± 0.1 ng/ml, p < 0.001). Cortisone concentration did not change across lactation but was higher than cortisol throughout. Compared to no antenatal corticosteroid (ANS), a complete course of ANS was associated with lower GC concentrations in HM through to 4m CA (cortisol: MD -0.3 ± 0.1 ng/ml, p < 0.01; cortisone MD -1.8 ± 0.4 ng/ml, p < 0.001). At 4m CA, higher maternal perceived stress was negatively associated with GC concentrations in HM (cortisol adjusted beta-coefficient [aβ] -0.01 ± 0.01 ng/ml, p = 0.05; and cortisone aβ -0.1 ± 0.03 ng/ml, p = 0.01), whereas higher postpartum depression and maternal obesity were associated with lower cortisone concentrations (aβ -0.1 ± 0.04 ng/ml p < 0.05; MD [healthy versus obese] -0.1 ± 0.04 ng/ml p < 0.05, respectively). There was a weak positive correlation between GC concentrations in HM and gestational age at birth (r = 0.1, p < 0.05). Infant birth head circumference z-score was negatively associated with cortisol concentrations (aβ -0.01 ± 0.04 ng/ml, p < 0.05). At hospital discharge, fat-free mass showed a weak positive correlation with cortisol concentrations (r = 0.2, p = 0.03), while fat mass showed a weak negative correlation with cortisone concentrations (r = -0.25, p < 0.001).

Conclusion: The mammary gland appears to protect the infant from cortisol through inactivation into cortisone. Maternal and infant characteristics were associated with concentration of GCs in HM, including ANS, stress and depression scores, obesity, gestational age and infant size. The effects of HM glucocorticoids on long-term health outcomes requires further research.

Keywords: antenatal corticosteroids; breastmilk; cortisol; cortisone; lactation; late preterm; moderate preterm; nutrition.


Conflict of interest statement

The authors declare that the research was conducted in the absence of any commercial or financial relationships that could be construed as a potential conflict of interest.

Figures

FIGURE 1
FIGURE 1
Study flowchart. Note that numbers do not add up as some mothers provided >1 sample and some mothers gave birth to multiples (twins and triplets). HM: human milk; 4m: 4 months follow-up visit. *Outlier sample excluded from analysis.
FIGURE 2
FIGURE 2
(A) Human milk concentrations of cortisol, cortisone and the cortisol-to-cortisone ratio at different lactation stages. Data are mean and standard error. Statistically significant differences are represented by different letters above the bars. ***p < 0.001 (B) Correlations between cortisol and cortisone at different lactation stages: postnatal day 5 (left), day 10 (middle), and 4 months’ corrected age (right). Blue line represents Spearman correlation coefficient and shaded area the 95% confidence interval. 4m CA: 4 months’ corrected age.
FIGURE 3
FIGURE 3
Concentrations of cortisol, cortisone and cortisol-to-cortisone ratio in human milk. (A) After different antenatal steroid courses and times of sample collection, (B) after different modes of birth (dark blue: vaginal birth; green: c-section) and antenatal steroid courses (circle: none; triangle: incomplete; square: complete) and time of sample collection, and (C) after singleton or multiple pregnancy. Data are mean concentration (ng/ml) and standard error. Statistically significant differences are represented by different letters above the symbols. *p < 0.05; **p < 0.01; ***p < 0.001. 4m CA: 4 months corrected age.
FIGURE 4
FIGURE 4
Cortisol and cortisone concentrations in human milk in women with different. (A) Body mass index (BMI), (B) Total Perceived Stress Score (PSS) at discharge, (C) Total PSS at 4 months, (D) Total Edinburgh Postnatal Depression Scale (EPDS) at discharge, and (E) Total EPDS at 4 months (4 m). Blue line and shaded area indicate regression line and 95% confidence interval, respectively. Data are mean concentration (ng/ml) and standard error. Statistically significant differences are represented by different letters above the bars. *p < 0.05.
FIGURE 5
FIGURE 5
(A) Cortisol and cortisone concentrations in human milk for moderate (circles) and late (triangles) preterm girls (green) and boys (blue) at each collection age. Data are mean concentration (ng/ml) and standard error. Correlation between human milk cortisol and cortisone concentrations and body composition (B) at hospital discharge and (C) at 4 months corrected age (4m CA). Blue line and shaded area indicate regression line and 95% confidence intervals.

Similar articles

Cited by

References

    1. Stuebe A. There is no formula for human milk. Breastfeed Med. (2020). 15:602. 10.1089/bfm.2020.29164.ams - DOI - PubMed
    1. Christian P, Smith ER, Lee SE, Vargas AJ, Bremer AA, Raiten DJ. The need to study human milk as a biological system. Am J Clin Nutr. (2021) 113:1063–72. 10.1093/ajcn/nqab075 - DOI - PMC - PubMed
    1. Geddes DT, Gridneva Z, Perrella SL, Mitoulas LR, Kent JC, Stinson LF, et al. 25 years of research in human lactation: from discovery to translation. Nutrients. (2021) 13:3071. 10.3390/nu13093071 - DOI - PMC - PubMed
    1. Hollanders JJ, Heijboer AC, van der Voorn B, Rotteveel J, Finken MJJ. Nutritional programming by glucocorticoids in breast milk: targets, mechanisms and possible implications. Best Pract Res Clin Endocrinol Metab. (2017) 31:397–408. 10.1016/j.beem.2017.10.001 - DOI - PubMed
    1. Hahn-Holbrook J, Saxbe D, Bixby C, Steele C, Glynn L. Human milk as “chrononutrition”: implications for child health and development. Pediatr Res. (2019) 85:936–42. 10.1038/s41390-019-0368-x - DOI - PubMed