

An interpretable stacking ensemble learning framework based on multi-dimensional data for real-time prediction of drug concentration: The example of olanzapine
- PMID: 36238557
- PMCID: PMC9552071
- DOI: 10.3389/fphar.2022.975855
An interpretable stacking ensemble learning framework based on multi-dimensional data for real-time prediction of drug concentration: The example of olanzapine
Abstract
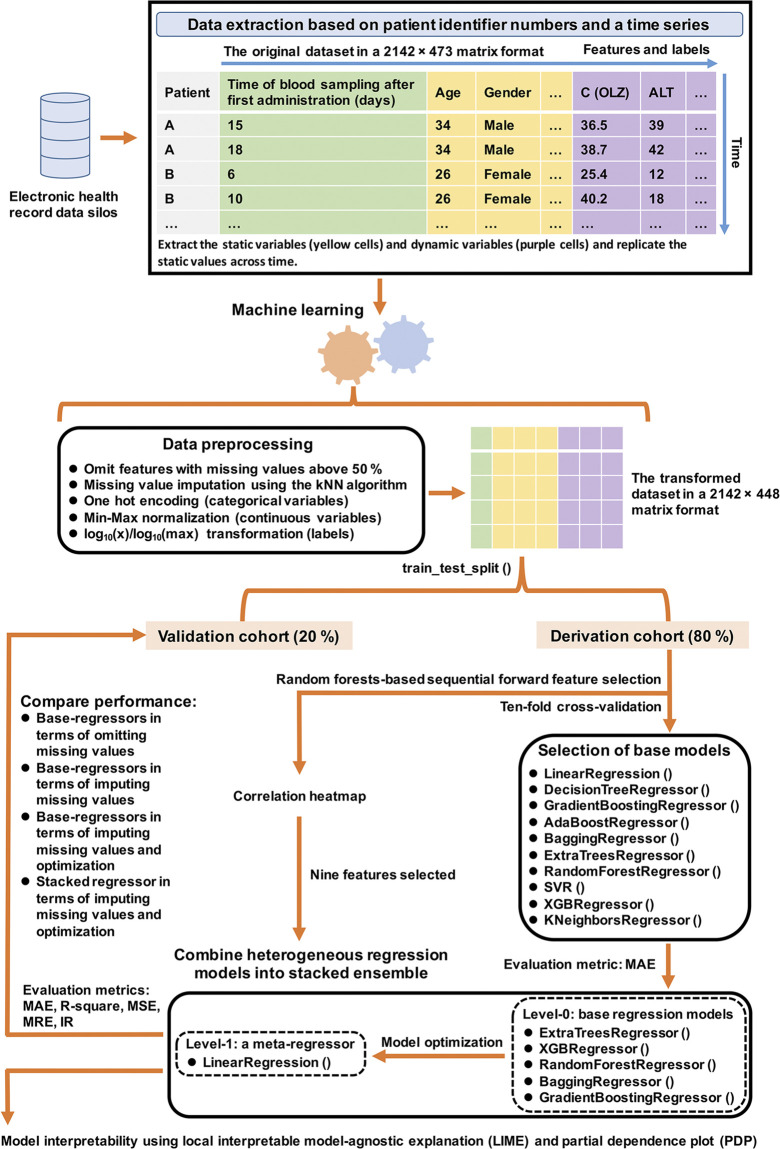
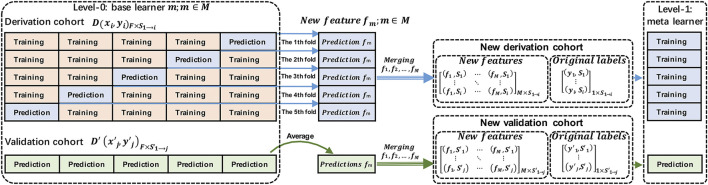
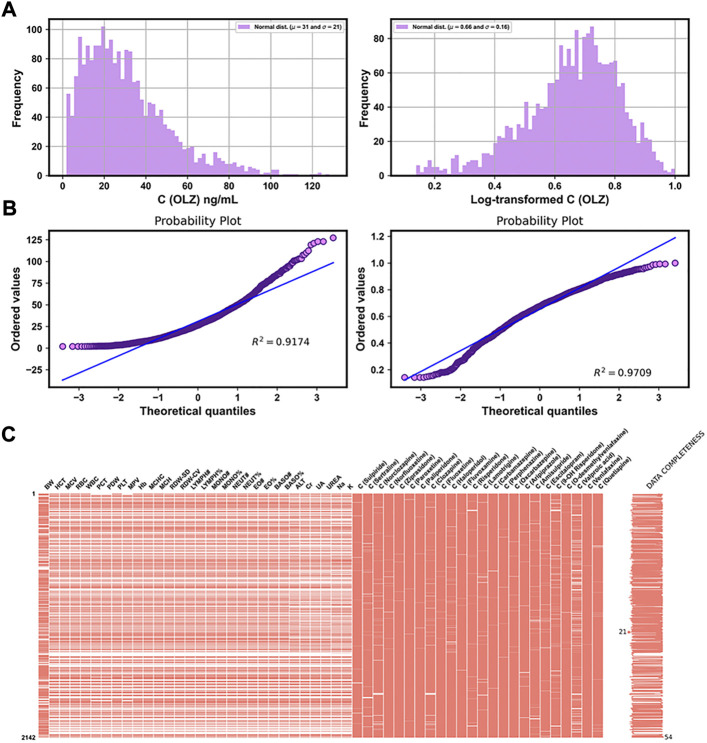
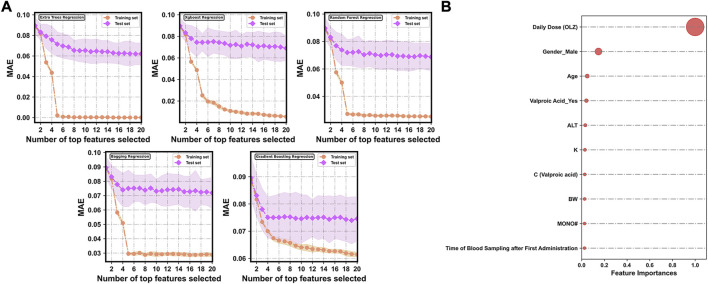
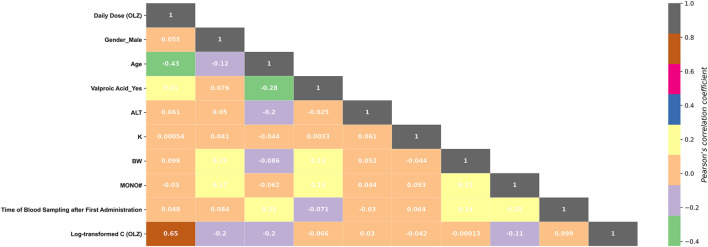
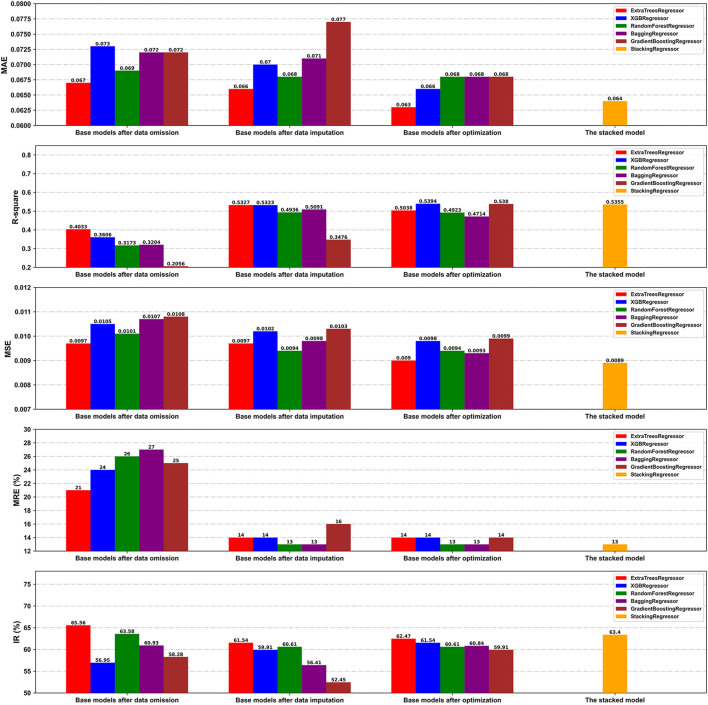
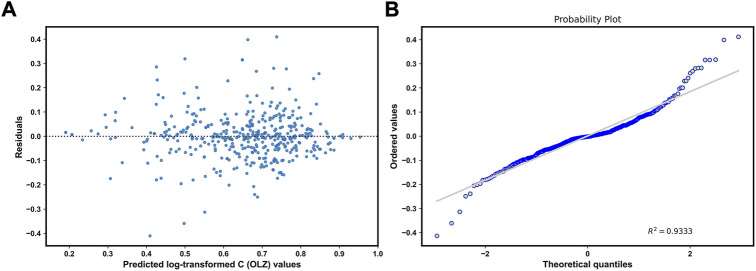
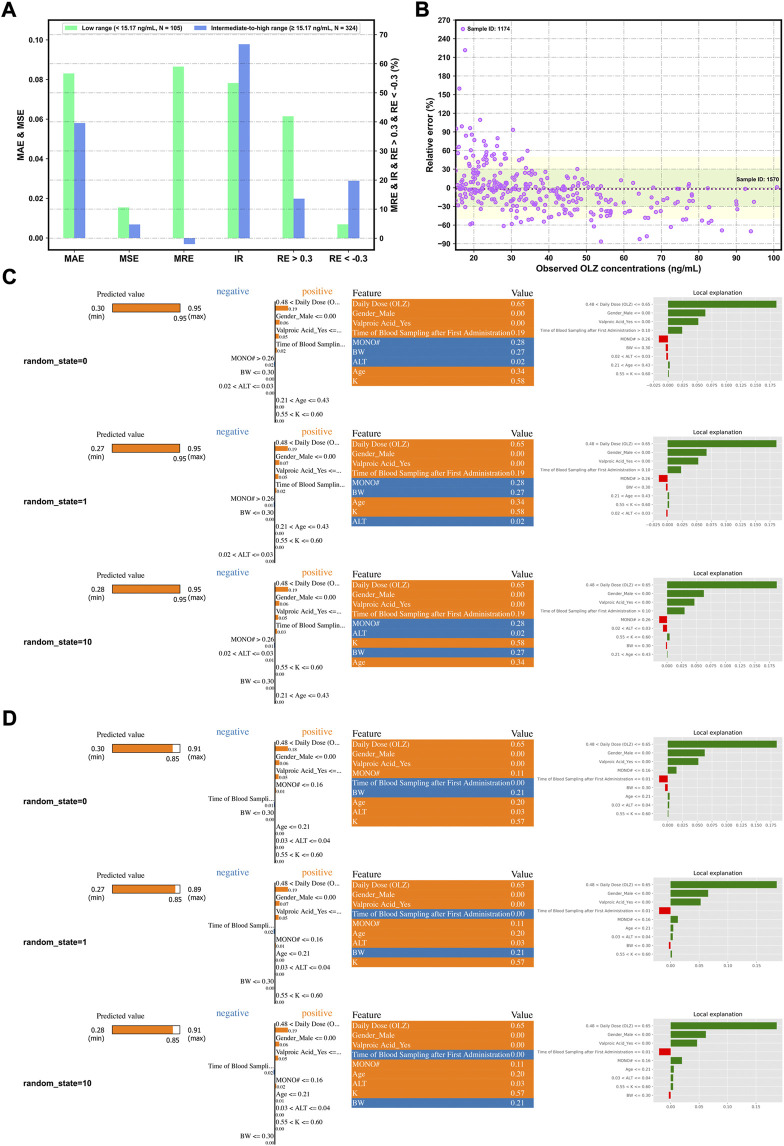
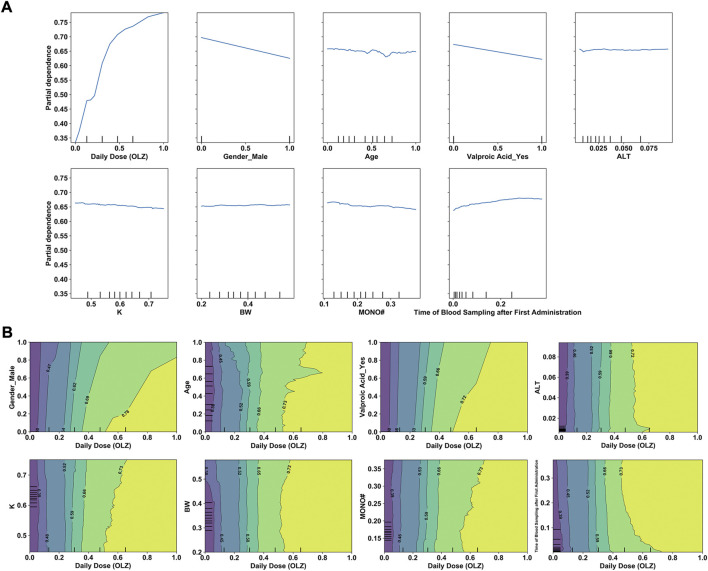
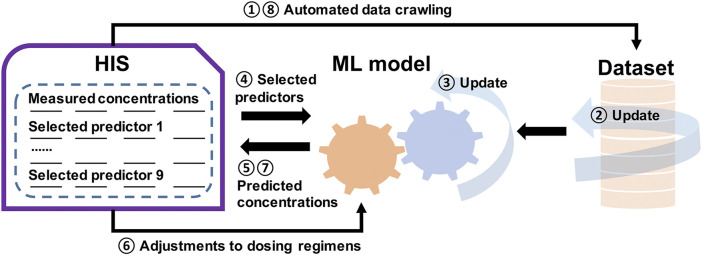
Background and Aim: Therapeutic drug monitoring (TDM) has evolved over the years as an important tool for personalized medicine. Nevertheless, some limitations are associated with traditional TDM. Emerging data-driven model forecasting [e.g., through machine learning (ML)-based approaches] has been used for individualized therapy. This study proposes an interpretable stacking-based ML framework to predict concentrations in real time after olanzapine (OLZ) treatment. Methods: The TDM-OLZ dataset, consisting of 2,142 OLZ measurements and 472 features, was formed by collecting electronic health records during the TDM of 927 patients who had received OLZ treatment. We compared the performance of ML algorithms by using 10-fold cross-validation and the mean absolute error (MAE). The optimal subset of features was analyzed by a random forest-based sequential forward feature selection method in the context of the top five heterogeneous regressors as base models to develop a stacked ensemble regressor, which was then optimized via the grid search method. Its predictions were explained by using local interpretable model-agnostic explanations (LIME) and partial dependence plots (PDPs). Results: A state-of-the-art stacking ensemble learning framework that integrates optimized extra trees, XGBoost, random forest, bagging, and gradient-boosting regressors was developed for nine selected features [i.e., daily dose (OLZ), gender_male, age, valproic acid_yes, ALT, K, BW, MONO#, and time of blood sampling after first administration]. It outperformed other base regressors that were considered, with an MAE of 0.064, R-square value of 0.5355, mean squared error of 0.0089, mean relative error of 13%, and ideal rate (the percentages of predicted TDM within ± 30% of actual TDM) of 63.40%. Predictions at the individual level were illustrated by LIME plots, whereas the global interpretation of associations between features and outcomes was illustrated by PDPs. Conclusion: This study highlights the feasibility of the real-time estimation of drug concentrations by using stacking-based ML strategies without losing interpretability, thus facilitating model-informed precision dosing.
Keywords: drug concentration; electronic health record; interpretability; machine learning; model-informed precision dosing; olanzapine; stacking; therapeutic drug monitoring.
Copyright © 2022 Zhu, Hu, Xiao, Huang, Wen and Shang.
Conflict of interest statement
The authors declare that the research was conducted in the absence of any commercial or financial relationships that could be construed as a potential conflict of interest. The reviewer XM declared a shared parent affiliation with the authors at the time of review.
Figures
Similar articles
-
Integrating machine learning with electronic health record data to facilitate detection of prolactin level and pharmacovigilance signals in olanzapine-treated patients.Front Endocrinol (Lausanne). 2022 Oct 13;13:1011492. doi: 10.3389/fendo.2022.1011492. eCollection 2022. Front Endocrinol (Lausanne). 2022. PMID: 36313772 Free PMC article.
-
Enhancing the Predictive Performance of Molecularly Imprinted Polymer-Based Electrochemical Sensors Using a Stacking Regressor Ensemble of Machine Learning Models.ACS Sens. 2025 Apr 25;10(4):3123-3133. doi: 10.1021/acssensors.5c00364. Epub 2025 Apr 17. ACS Sens. 2025. PMID: 40241481
-
Stacked Ensemble with Machine Learning Regressors on Optimal Features (SMOF) of hyperspectral sensor PRISMA for inland water turbidity prediction.Environ Sci Pollut Res Int. 2024 Dec;31(57):65464-65480. doi: 10.1007/s11356-024-35481-2. Epub 2024 Nov 25. Environ Sci Pollut Res Int. 2024. PMID: 39581926
-
Ensemble Learning for Disease Prediction: A Review.Healthcare (Basel). 2023 Jun 20;11(12):1808. doi: 10.3390/healthcare11121808. Healthcare (Basel). 2023. PMID: 37372925 Free PMC article. Review.
-
Emerging therapeutic drug monitoring technologies: considerations and opportunities in precision medicine.Front Pharmacol. 2024 Mar 13;15:1348112. doi: 10.3389/fphar.2024.1348112. eCollection 2024. Front Pharmacol. 2024. PMID: 38545548 Free PMC article. Review.
Cited by
-
Ensemble Learning, Deep Learning-Based and Molecular Descriptor-Based Quantitative Structure-Activity Relationships.Molecules. 2023 Mar 6;28(5):2410. doi: 10.3390/molecules28052410. Molecules. 2023. PMID: 36903654 Free PMC article. Review.
-
Enhanced forecasting of emergency department patient arrivals using feature engineering approach and machine learning.BMC Med Inform Decis Mak. 2024 Dec 18;24(1):377. doi: 10.1186/s12911-024-02788-6. BMC Med Inform Decis Mak. 2024. PMID: 39696224 Free PMC article.
-
MolToxPred: small molecule toxicity prediction using machine learning approach.RSC Adv. 2024 Jan 30;14(6):4201-4220. doi: 10.1039/d3ra07322j. eCollection 2024 Jan 23. RSC Adv. 2024. PMID: 38292268 Free PMC article.
-
Estimating the volume of penumbra in rodents using DTI and stack-based ensemble machine learning framework.Eur Radiol Exp. 2024 May 15;8(1):59. doi: 10.1186/s41747-024-00455-z. Eur Radiol Exp. 2024. PMID: 38744784 Free PMC article.
-
Optimizing PGRs for in vitro shoot proliferation of pomegranate with bayesian-tuned ensemble stacking regression and NSGA-II: a comparative evaluation of machine learning models.Plant Methods. 2024 May 31;20(1):82. doi: 10.1186/s13007-024-01211-5. Plant Methods. 2024. PMID: 38822411 Free PMC article.
References
-
- Akter S., Shekhar H. U., Akhteruzzaman S. (2021). Application of biochemical tests and machine learning techniques to diagnose and evaluate liver disease. Adv. Biosci. Biotechnol. 12, 154–172. 10.4236/abb.2021.126011 - DOI
-
- Arnaiz J. A., Rodrigues-Silva C., Mezquida G., Amoretti S., Cuesta M. J., Fraguas D., et al. (2021). The usefulness of olanzapine plasma concentrations in monitoring treatment efficacy and metabolic disturbances in first-episode psychosis. Psychopharmacol. (Berl) 238 (3), 665–676. 10.1007/s00213-020-05715-5 - DOI - PubMed
LinkOut - more resources
Full Text Sources
Research Materials