. 2022 Sep 27:13:1000322.
doi: 10.3389/fmicb.2022.1000322. eCollection 2022.

Characterization and subcellular localization of Alongshan virus proteins

Affiliations

Characterization and subcellular localization of Alongshan virus proteins

Yinghua Zhao et al. Front Microbiol. .

Abstract

Alongshan virus (ALSV) in the Jingmenvirus group within the family Flaviviridae is a newly discovered tick-borne virus associated with human disease, whose genome includes four segments and encodes four structural proteins (VP1a, VP1b, VP2, VP3, and VP4) and two non-structural proteins (NSP1 and NSP2). Here, we characterized the subcellular distribution and potential function of ALSV proteins in host cells. We found that viral proteins exhibited diverse subcellular distribution in multiple tissue-deriving cells and induced various morphological changes in the endoplasmic reticulum (ER), and NSP2, VP1b, VP2, and VP4 were all co-localized in the ER. The nuclear transfer and co-localization of VP4 and calnexin (a marker protein of ER), which were independent of their interaction, were unique to HepG2 cells. Expression of NSP1 could significantly reduce mitochondria quantity by inducing mitophagy. These findings would contribute to better understanding of the pathogenesis of emerging segmented flaviviruses.

Keywords: Alongshan virus; characterization; segmented flavivirus; subcellular localization; viral proteins.


Conflict of interest statement

The authors declare that the research was conducted in the absence of any commercial or financial relationships that could be construed as a potential conflict of interest.

Figures
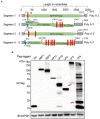
Figure 1
Figure 1
Construction of expression vectors for ALSV proteins. (A) Schematic genome organization and putative proteomic maps of ALSV, the open reading frame (ORF) is shown in the green box. The transmembrane area is displayed in red box, and the signal peptide is displayed in blue box. (B) Immunoblot analysis of ALSV protein expression. The ALSV proteins plasmids were separately transfected into HEK293T cells, and the Flag-vec was used as a control. At 24 h post-transfection (hpt), cellular lysis was measured by immunoblot with Flag antibody, GAPDH as a loading control. The red arrows, respectively, indicate VP3 and VP4 bands which consistent with the calculated molecular weights.
Figure 2
Figure 2
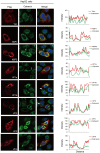
The ER subcellular localization of ALSV proteins in HEK293T cells. HEK293T cells were transfected with the plasmids expressing Flag-NSP1, NSP2, VP1a, VP1b, VP2, VP3, VP4 or vector. After 24 h, the cells were immune-stained with anti-Flag (red) and anti-calnexin (green) antibodies and counterstained with DAPI to examine chromosomes (blue). (Right) ImageJ line scan analysis of the intensity profiles of the viral protein (red) and the calnexin (green) along the plotted lines. The distance in the x-axis represents the length of the plotted lines, and the consistency of the change trend of intensity profiles is proportional to the degree of co-localization of the two proteins.
Figure 3
Figure 3
The ER colocalization of ALSV proteins in HepG2 cells. HepG2 cells were transfected with the plasmids expressing Flag-tagged viral proteins or empty vector. After 24 h, cells were immune-stained with anti-Flag antibody (red), anti-calnexin antibody (green), and DAPI (blue). The ImageJ line scan analyses are shown on the right. The distance in the x-axis represents the length of the plotted lines, and the consistency of the change trend of intensity profiles is proportional to the degree of co-localization of the two proteins.
Figure 4
Figure 4
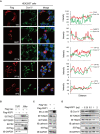
VP1a and VP4 induce calnexin transfer into the nucleus in HepG2 cells. (A,B) HepG2 (A) and HEK293T cells (B) were transfected with the plasmids expressing Flag-tagged VP1a, VP4 or empty vector. At 24 hpt, the cells were subjected to immunofluorescence with anti-calnexin (green), anti-Flag (red) antibodies and DAPI (blue). (C, D) HepG2 (C) and HEK293T (D) cells were transfected with the indicated plasmids. After 24 h, cells were treated using the nuclear and cytoplasmic protein extraction kit and the purified protein fractions were subjected to immunoblots with the indicated antibodies. (E) HepG2 cells were transfected with Flag-tagged VP1a, VP4 or vector plasmids. At 24 hpt, the cells were subjected to immunofluorescence with anti-B23 (red) and anti-Flag (green) antibodies. (F) HepG2 (left) and HEK293T (right) cells were transfected with Flag-tagged VP1a, VP4 or vector plasmids. At 24 hpt, anti-Flag immunoprecipitates were analyzed by immunoblots.
Figure 5
Figure 5
NSP1 reduced mitochondria quantity by inducing mitophagy. (A) HEK293T cells were transfected with the plasmids expressing Flag-NSP1, VP1a, VP1b or VP3. At 24 hpt, the cells were subjected to immunofluorescence with anti-Flag (red), anti-Cox IV (green) antibodies and DAPI (blue). The ImageJ line scan analyses are shown on the right. The distance in the x-axis represents the length of the plotted lines, and the consistency of the change trend of intensity profiles is proportional to the degree of co-localization of the two proteins. (B) The Flag-tagged NSP1 or vector plasmids were transfected into HEK293T cells. At 24 hpt, the cells suffered from mitochondria isolation and were measured by immunoblot with the indicated antibodies. (C) HEK293T cells were transfected with the indicated plasmids, 24 h later, cells proteins were analyzed by immunoblot. (D) HEK293T cells in a 24-well plate were transfected with the increasing amount of Flag-NSP1 (0.25, 0.5, 1and 2 μg) plasmid. At 24 hpt, the expression levels of indicated proteins were analyzed by immunoblot.
Figure 6
Figure 6
ALSV infection induces calnexin nuclear transfer and mitophagy. (A) HepG2 cells were infected with ALSV at MOI of 10. At 48 h post infection (hpi), the cells were subjected to immunofluorescence with anti-calnexin (green) antibody and DAPI (blue). (B) HepG2 cells were infected with ALSV. At 48 hpi, the cells were subjected to cell fractionation and immunoblot assay. Hela (C) or Vero (D) cells were infected with ALSV, the cells at the indicated hours post infection were analyzed by immunoblot.

Similar articles

Cited by

References

    1. Agarwal A., Alam M. F., Basu B., Pattanayak S., Asthana S., Syed G. H., et al. (2022). Japanese encephalitis virus NS4A protein interacts with PTEN-induced kinase 1 (PINK1) and promotes mitophagy in infected cells. Microbiol. Spectr. 10:e0083022. doi: 10.1128/spectrum.00830-22, PMID: - DOI - PMC - PubMed
    1. Ambrose R. L., Mackenzie J. M. (2011). West Nile virus differentially modulates the unfolded protein response to facilitate replication and immune evasion. J. Virol. 85, 2723–2732. doi: 10.1128/JVI.02050-10, PMID: - DOI - PMC - PubMed
    1. Bagchi P. (2020). Endoplasmic reticulum in viral infection. Int. Rev. Cell Mol. Biol. 350, 265–284. doi: 10.1016/bs.ircmb.2019.10.005 - DOI - PubMed
    1. Barbier V., Lang D., Valois S., Rothman A. L., Medin C. L. (2017). Dengue virus induces mitochondrial elongation through impairment of Drp1-triggered mitochondrial fission. Virology 500, 149–160. doi: 10.1016/j.virol.2016.10.022, PMID: - DOI - PMC - PubMed
    1. Bertero E., Maack C. (2018). Calcium signaling and reactive oxygen species in mitochondria. Circ. Res. 122, 1460–1478. doi: 10.1161/CIRCRESAHA.118.310082 - DOI - PubMed

LinkOut - more resources