. 2022 Sep;2(10):e558.
doi: 10.1002/cpz1.558.

An In Vivo Mouse Model for Chronic Inflammation-Induced Immune Suppression: A "Factory" for Myeloid-Derived Suppressor Cells (MDSCs)

Affiliations

An In Vivo Mouse Model for Chronic Inflammation-Induced Immune Suppression: A "Factory" for Myeloid-Derived Suppressor Cells (MDSCs)

Kerem Ben-Meir et al. Curr Protoc. 2022 Sep.

Abstract

Myeloid-derived suppressor cells (MDSCs) represent a heterogeneous population of immature myeloid cells known to play a role in perpetuating a wide range of pathologies, such as chronic infections, autoimmune diseases, and cancer. MDSCs were first identified in mice by the markers CD11b+ Gr1+ , and later, based on their morphology, they were classified into two subsets: polymorphonuclear MDSCs, identified by the markers CD11b+ Ly6G+ Ly6CLow , and monocytic MDSCs, detected as being CD11b+ Ly6G- Ly6CHi . MDSCs are studied as immunosuppressive cells in various diseases characterized by chronic inflammation and are associated with disease causes/triggers such as pathogens, autoantigens, and cancer. Therefore, different diseases may diversely affect MDSC metabolism, migration, and differentiation, thus influencing the generated MDSC functional features and ensuing suppressive environment. In order to study MDSCs in a pathology-free environment, we established and calibrated a highly reproducible mouse model that results in the development of chronic inflammation, which is the major cause of MDSC accumulation and immune suppression. The model presented can be used to study MDSC phenotypes, functional diversity, and plasticity. It also permits study of MDSC migration from the bone marrow to peripheral lymphatic and non-lymphatic organs and MDSC crosstalk with extrinsic factors, both in vivo and ex vivo. Furthermore, this model can serve as a platform to assess the effects of anti-MDSC modalities. © 2022 The Authors. Current Protocols published by Wiley Periodicals LLC. Basic Protocol: Repetitive M.tb immunizations for the induction of chronic inflammation Alternate Protocol 1: Creating a lower grade of inflammation by changing the site of immunization Alternate Protocol 2: In vivo evaluation of immune status Support Protocol 1: Preparation of reconstituted M.tb aliquots and M.tb-IFA emulsions for each of the three injections Support Protocol 2: Preparation of an ovalbumin lentiviral expression vector Support Protocol 3: Fluorescence titering assay for the lentiviral expression vector Support Protocol 4: Spleen excision, tissue dissociation, and preparation of a single-cell suspension Support Protocol 5: Labeling of splenocytes with CFSE proliferation dye.

Keywords: M-MDSCs; PMN-MDSCs; chronic inflammation; immune suppression; myeloid cells.


Conflict of interest statement

The authors declare no conflict of interest.

Figures
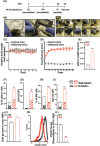
Figure 1
Figure 1
A model system for pathology‐free chronic inflammation associated with MDSC‐mediated immune suppression. (A) Timeline of injections. Mice are subjected to repetitive M.tb immunizations. The first injection is administered subcutaneously (SC); the second, intra‐footpad (IFP); and the third, intraperitoneally (IP). (B) Pictures of mice in the presented model, from left to right: IFP (second) injection, measurement of paw size using a caliper, and daily follow‐up of the injected paws. Numbers in the upper left corner of the small pictures indicate the days of follow‐up. (C) Mouse weight, normalized to the average group weight on the first day of the experiment. (D) Paw measurements of mice from day 7. Each line represents a mouse. (E) Spleen weight at day 16. t‐test, ***p < 0.001. (F and G) Spleen CD11b+Ly6G+Ly6CHi (PMN‐MDSCs) and CD11b+Ly6GLy6CHi (M‐MDSCs) cell percentages (F) and total number (G). The calculation is performed by counting the total cell number obtained from the spleens and multiplying by cell percentages. One‐way ANOVA, **p < 0.01, ***p < 0.001. (H and I) CD11b+Ly6G+Ly6CHi (PMN‐MDSCs) and CD11b+Ly6GLy6CHi (M‐MDSCs) cell percentages from BM derived from one tibia of control and inflamed mice (H) and (I) total cell number. The calculation is performed by counting the total cell number obtained from the BM and multiplying by cell percentages. One‐way ANOVA, **p < 0.01, ***p < 0.001. (J) CD3ε levels in splenic T cells (CD3ε+ cells) from control and inflamed mice. t‐test, *p < 0.05. (K) Flow cytometry analysis of CD247 expression in splenic CD3ε+ T cells. Each histogram represents a mouse. Control group in black, inflamed in red. (L) CD247 levels normalized to CD3ε levels. t‐test, p < 0.001. For all presented experiments, a representative experiment is shown. Control group: N = 5, Inflamed group: N = 10.
Figure 2
Figure 2
MDSCs isolated from inflamed mice show suppressive function. (A and B) CD247 downregulation ex vivo: T cells isolated from spleens of control mice were co‐cultured with or without MDSCs (CD11b+Gr1+) isolated from spleens of inflamed mice at a T cell/MDSC ratio of 1:2. After 20 hr, the cells were washed, stained for extracellular CD3ε and intracellular CD247, and subjected to flow cytometry. CD247 levels were normalized to CD3ε levels, as shown in (A). The mean ± SEM of three biological repeats is shown. Representative histograms of the expression levels of CD3ε (left panel) and CD247 (right panel) are presented in (B). Black: T cells. Red: T cells + MDSCs. Each histogram represents one technical replicate of one of the three biological repeats. t‐test, p < 0.01. (C and D) T‐cell suppression ex vivo: T cells isolated from spleens of control mice were CFSE labeled, activated with anti‐CD3 and anti‐CD28 antibodies, and co‐cultured with or without MDSCs (CD11b+Gr1+) isolated from spleens of inflamed mice at T cell/MDSC ratios of 1:0.5 and 1:2. After 72 hr, the cells were washed, stained for APC‐Thy1.2 (a T‐cell marker), and subjected to flow cytometry. The CFSE fluorescence intensity of Thy1.2+ cells was assessed. Mean ± SEM percentages of gated T cells from the different treatments are shown in (C). (D) shows representative histograms (T cell/MDSC ratios: left panel, 1:0.5, and right panel, 1:2). Each histogram represents one technical replicate of three biological repeats Gray: non‐activated T cells, Blue: activated T cells. Red: activated T cells + MDSCs. Columns are an average of three replicates of three biological repeats. One‐way ANOVA, *p < 0.05, ***p < 0.001.
Figure 3
Figure 3
Deviation from the model, replacing the IFP injection with a side‐flank SC injection. (A) Timeline of injections. Mice were subjected to consecutive M.tb immunizations. The first injection was administered SC; the second, IFP or in the side flank, SC, as indicated; and the third, IP. (B and C) The percentage of MDSCs (CD11b+Gr1+) in the spleen (B) and BM (C) of the different experimental groups is presented. (D) CD247 expression levels in splenic T cells are presented as normalized to CD3ε levels. Representative data from one experiment are shown. Control group (black): N = 4 mice, IFP group (red): N = 4, SC group (blue): N = 10). Mean ± SEM. One‐way ANOVA, **p < 0.01, ***p < 0.001.
Figure 4
Figure 4
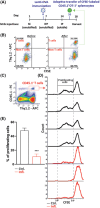
In vivo evaluation of immune status. (A) Scheme of the experiment timeline. Inflamed or non‐inflamed mice were immunized with an OVA‐albumin expression vector. On day 16, mice were adoptively transferred with 4 × 10⁶ CFSE‐labeled CD45.1+OT‐I+ splenocytes. Two days later, spleens were harvested, and cells were subjected to flow cytometry. (B) Flow cytometry of spleen cells before and after CFSE staining as elaborated in Support Protocol 5. Indicated in the plots are the T‐cell population (Thy1.2 positive) and non‐T cells (Thy1.2 negative). (C) Representative plot and gating strategy for CD45.1+Thy1.2+ T cells among total splenocytes. (D) CFSE fluorescence of the gated CD45.1+ T cells. CFSELow cells are gated as proliferating cells, as indicated in the top histogram. Each histogram represents a single mouse. Control group (in black): N = 4, Inflamed group (in red): N = 3. (E) Percentage of proliferating cells gated on CD45.1+ T cells, presented as the mean ± SEM. t‐test, p < 0.001.
Figure 5
Figure 5
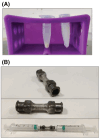
Sonication and emulsion of M.tb. (A) M.tb before (left tube) and after (right tube) sonication. As explained in detail in Support Protocol 1, reconstituted 10 mg/ml M.tb solution was sonicated 10 times until fully solubilized. After sonication, both tubes were vortexed for 10 s and inserted into the purple tube stand. The picture was taken after 30 s of sedimentation. (B) Female‐to‐female Luer adaptor. As explained in detail in Support Protocol 1, a metal female‐to‐female Luer adaptor can be made from two metal needles soldered together.

References

    1. Ashkenazi‐Preiser, H. , Mikula, I. , Baniyash, M. , & Baniyash, M. (2021). The diverse roles of myeloid derived suppressor cells in mucosal immunity. Cellular Immunology, 365, 104361. doi: 10.1016/j.cellimm.2021.104361 - DOI - PubMed
    1. Baniyash, M. (2016). Myeloid‐derived suppressor cells as intruders and targets: Clinical implications in cancer therapy. Cancer Immunology, Immunotherapy, 65, 857–867. doi: 10.1007/s00262-016-1849-y - DOI - PMC - PubMed
    1. Baniyash, M. , Sade‐Feldman, M. , & Kanterman, J. (2014). Chronic inflammation and cancer: Suppressing the suppressors. Cancer Immunology, Immunotherapy: CII, 63, 11–20. doi: 10.1007/s00262-013-1468-9 - DOI - PMC - PubMed
    1. Ben‐meir, K. , Twaik, N. , & Baniyash, M. (2018). Plasticity and biological diversity of myeloid derived suppressor cells. Current Opinion in Immunology, 51, 154–161. doi: 10.1016/j.coi.2018.03.015 - DOI - PubMed
    1. Bronstein‐Sitton, N. , Cohen‐Daniel, L. , Vaknin, I. , Ezernitchi, A. V. , Leshem, B. , Halabi, A. , … Baniyash, M. (2003). Sustained exposure to bacterial antigen induces interferon‐γ‐dependent T cell receptor ζ down‐regulation and impaired T cell function. Nature Immunology, 4, 957–964. doi: 10.1038/ni975 - DOI - PubMed

LinkOut - more resources