. 2023 Jan 2;222(1):e202112108.
doi: 10.1083/jcb.202112108. Epub 2022 Oct 14.

The GARP complex prevents sterol accumulation at the trans-Golgi network during dendrite remodeling

Affiliations

The GARP complex prevents sterol accumulation at the trans-Golgi network during dendrite remodeling

Caitlin E O'Brien et al. J Cell Biol. .

Abstract

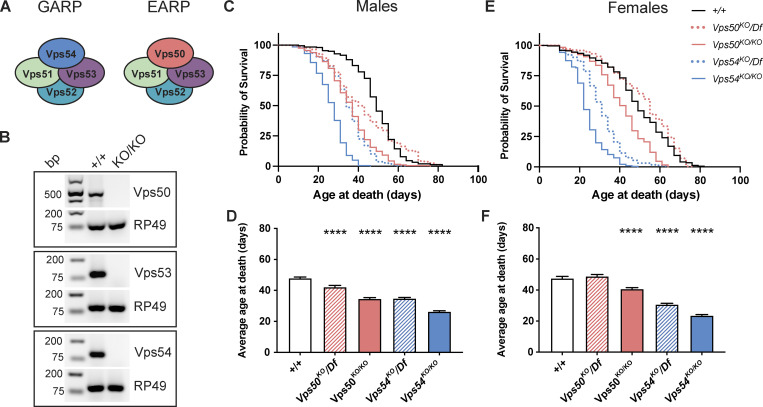
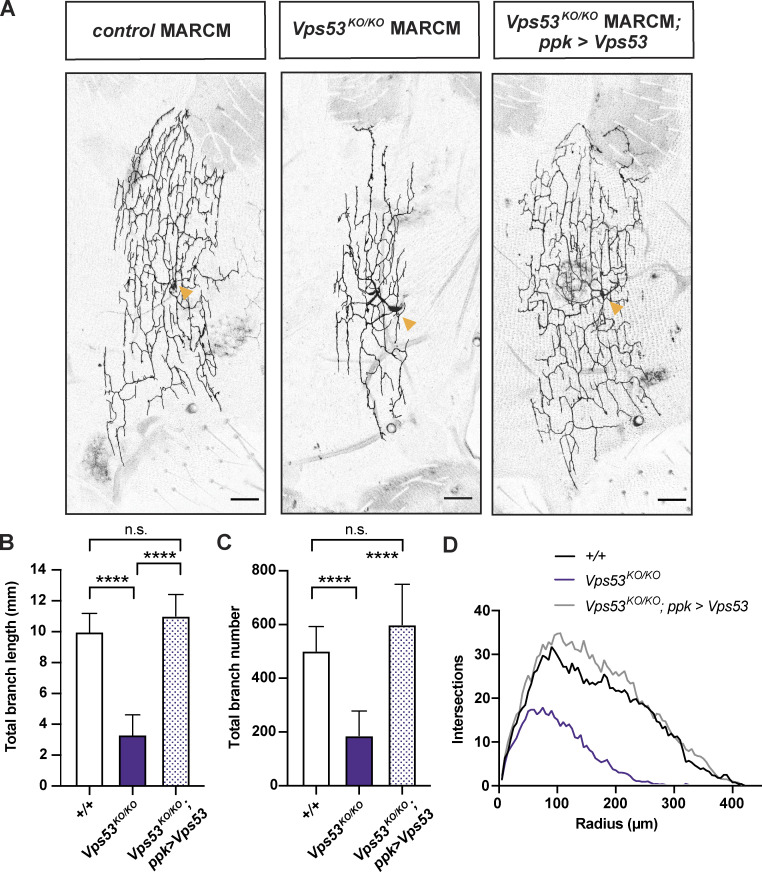
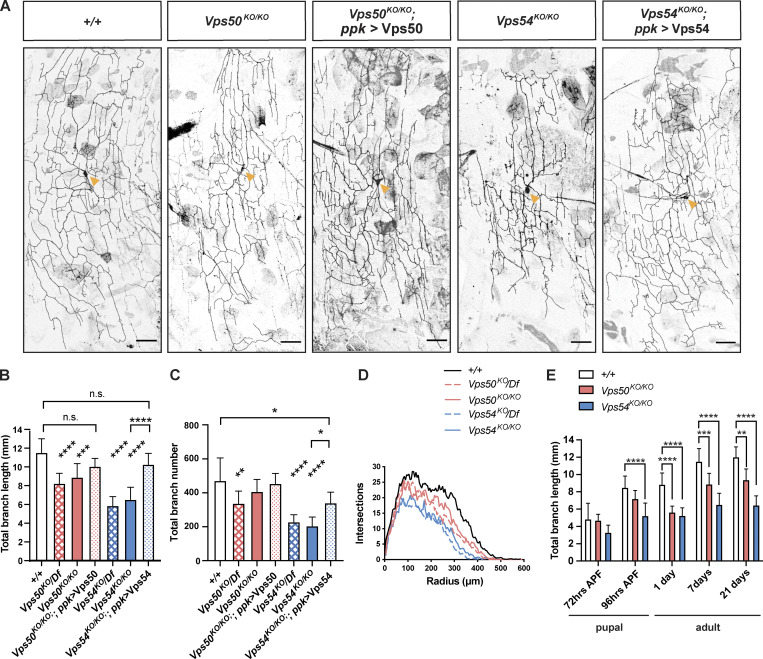
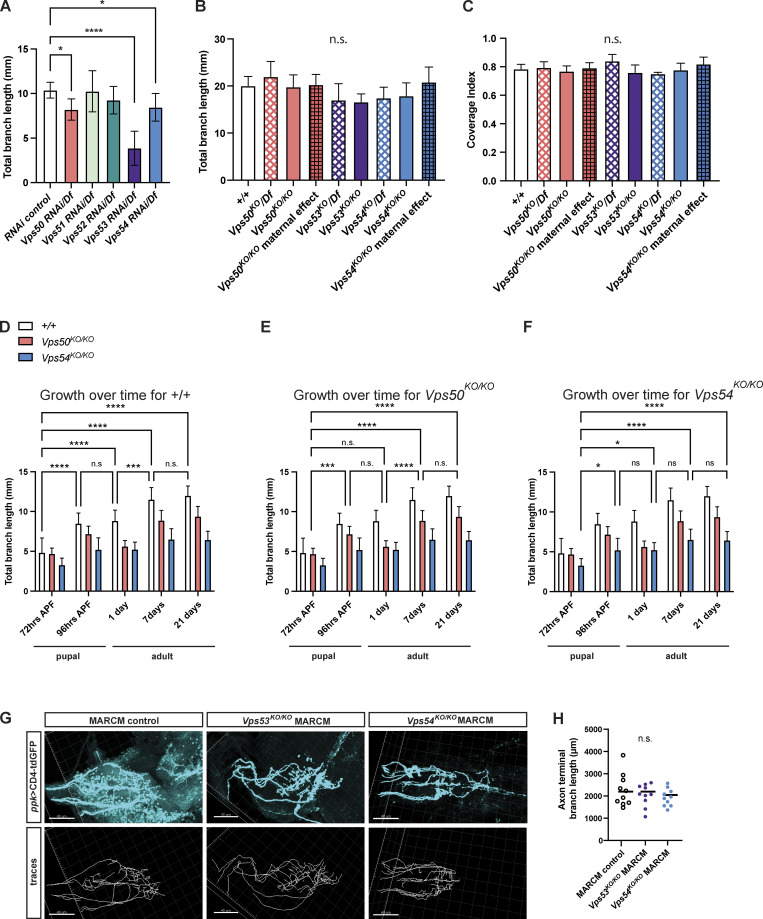
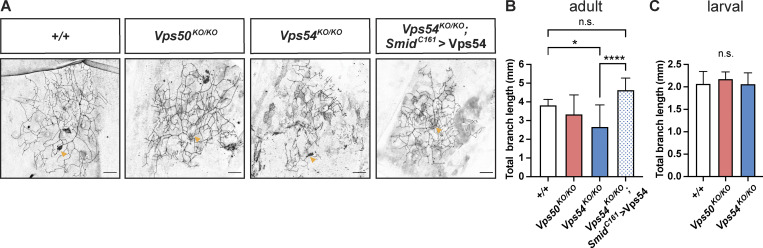
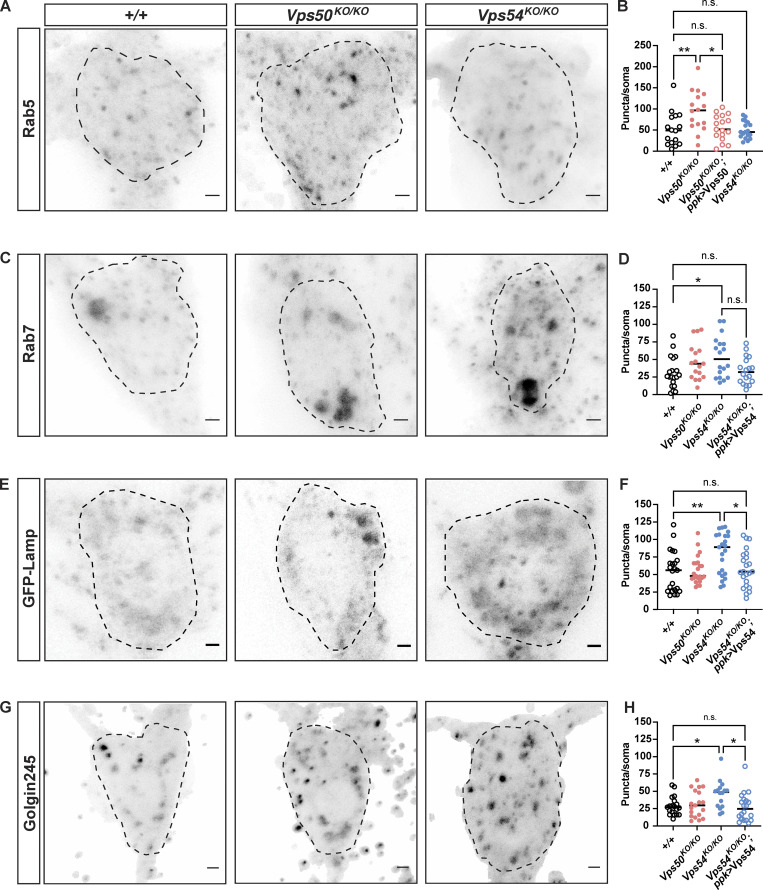
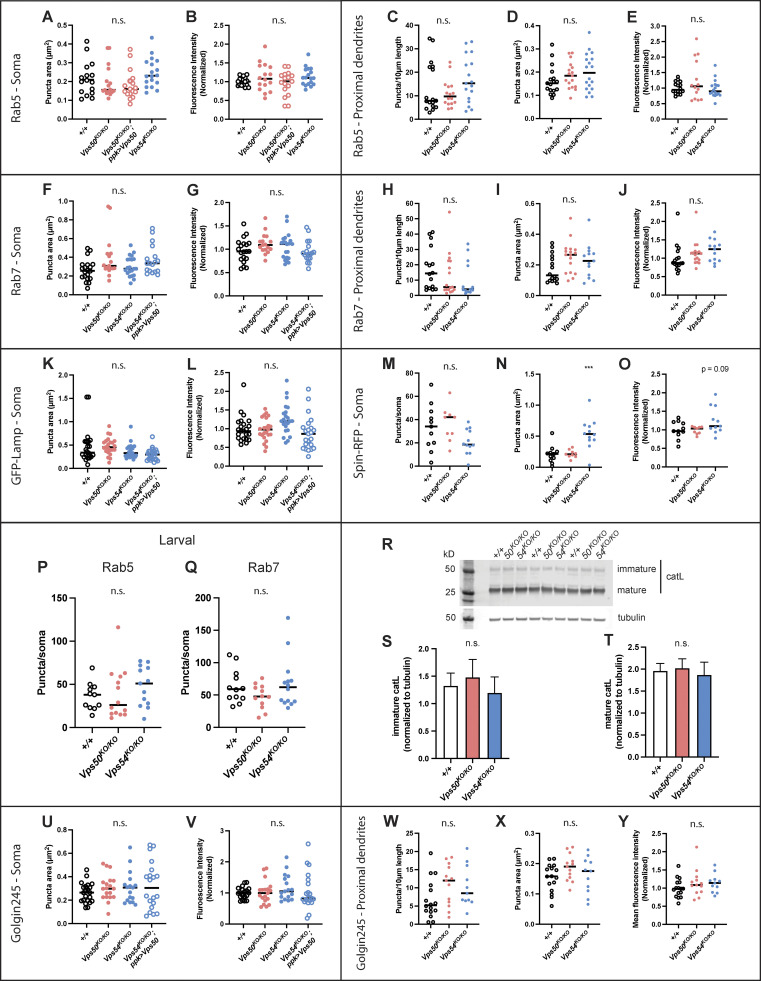
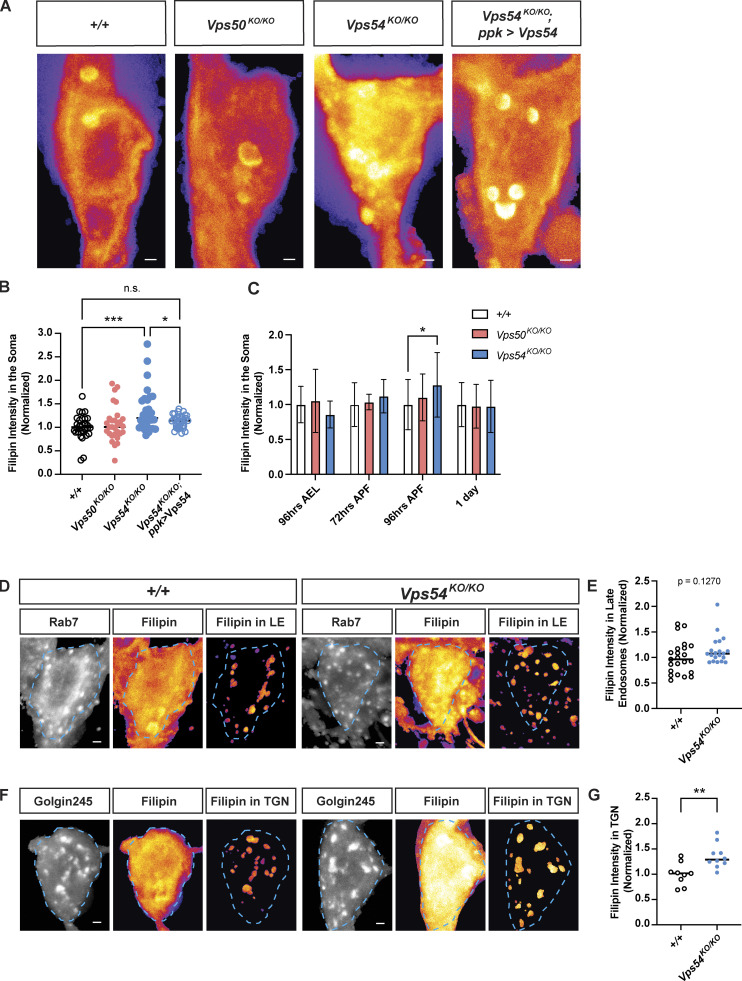
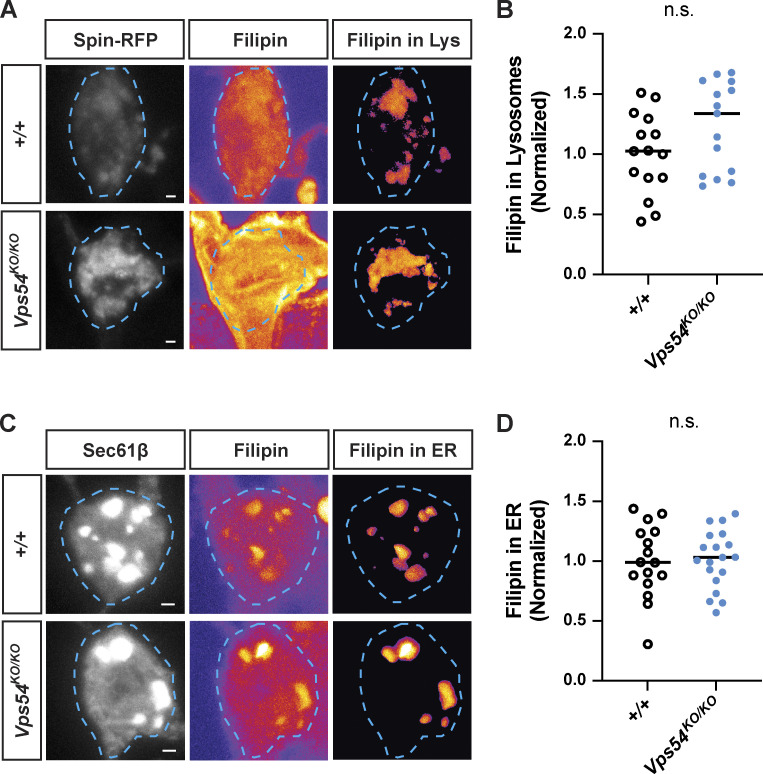
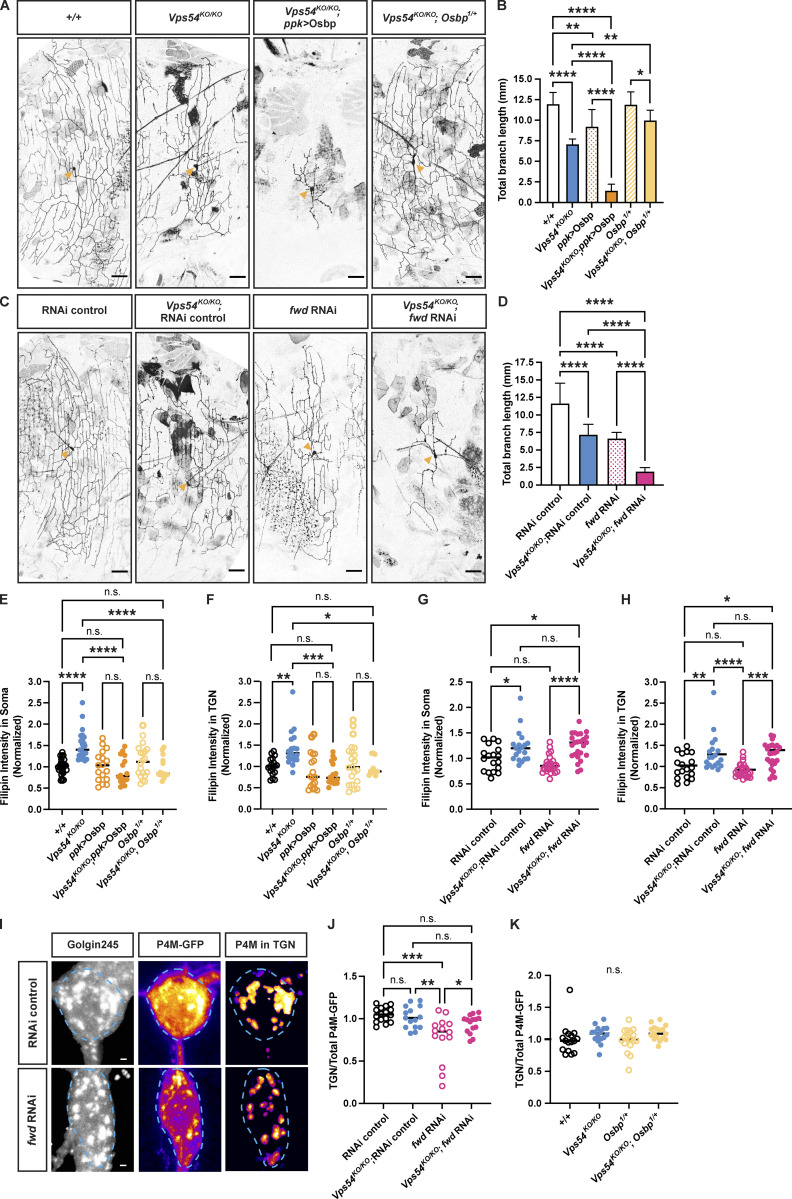
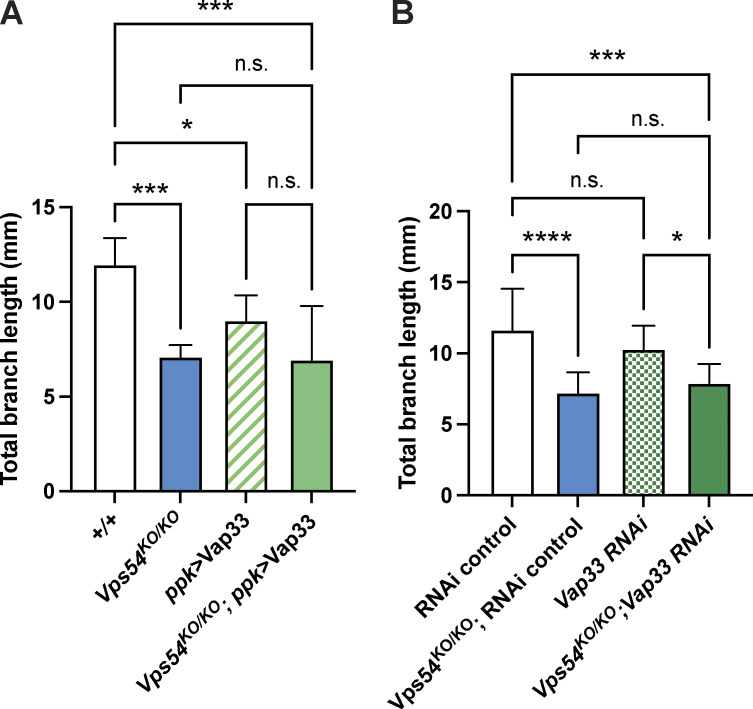
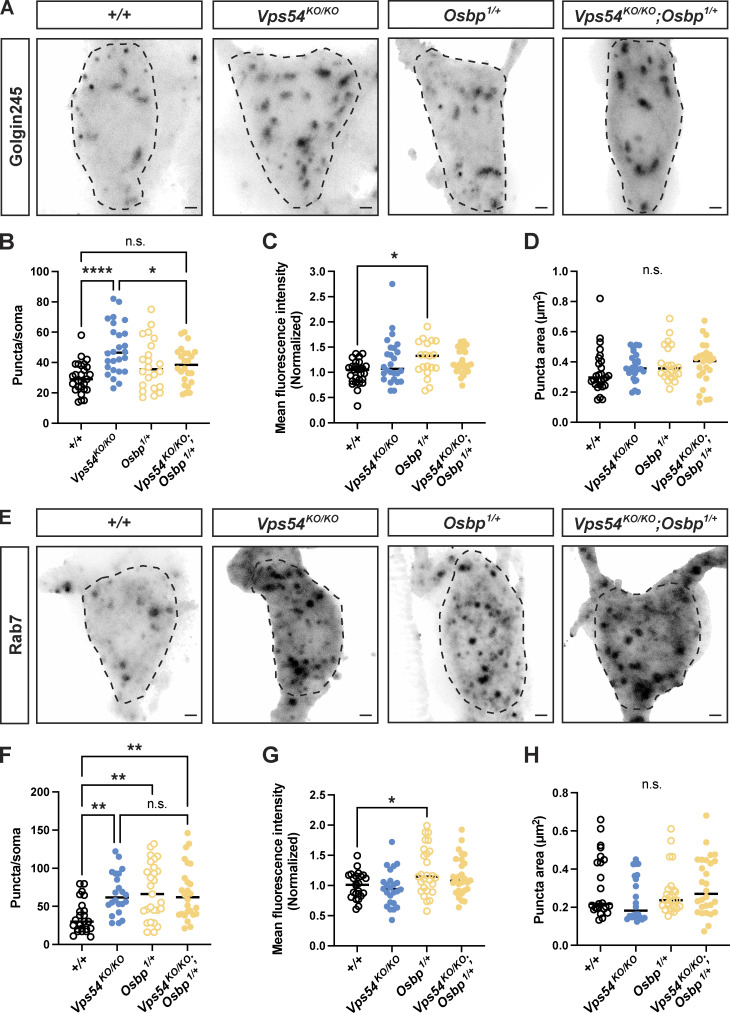
Membrane trafficking is essential for sculpting neuronal morphology. The GARP and EARP complexes are conserved tethers that regulate vesicle trafficking in the secretory and endolysosomal pathways, respectively. Both complexes contain the Vps51, Vps52, and Vps53 proteins, and a complex-specific protein: Vps54 in GARP and Vps50 in EARP. In Drosophila, we find that both complexes are required for dendrite morphogenesis during developmental remodeling of multidendritic class IV da (c4da) neurons. Having found that sterol accumulates at the trans-Golgi network (TGN) in Vps54KO/KO neurons, we investigated genes that regulate sterols and related lipids at the TGN. Overexpression of oxysterol binding protein (Osbp) or knockdown of the PI4K four wheel drive (fwd) exacerbates the Vps54KO/KO phenotype, whereas eliminating one allele of Osbp rescues it, suggesting that excess sterol accumulation at the TGN is, in part, responsible for inhibiting dendrite regrowth. These findings distinguish the GARP and EARP complexes in neurodevelopment and implicate vesicle trafficking and lipid transfer pathways in dendrite morphogenesis.


Figures

Figure 1.
Figure 1.
Reduced lifespan of GARP knockout flies. (A) Cartoon depicting the GARP and EARP complexes. (B) RT-PCR from control (+/+) and KOs. RNA was extracted from whole larvae, reverse transcribed, and equal amounts of cDNA were used for RT-PCR. RP49 is used as a reference gene. Bp = base pairs. (C and D) Survival curves and average age at death ± SEM for male flies of the indicated genotypes. N > 200 flies/genotype. Survival curves were analyzed by Log-Rank Mantel-Cox test with Bonferroni multiple comparisons correction. ****P < 0.0001 for all genotypes compared to control except Vps50KO/Df (not significant—n.s.). Average age at death compared to +/+ was analyzed by one-way ANOVA with Dunnett’s post-test. ****P < 0.0001. (E and F) Survival curves and average age at death ± SEM for female flies of the indicated genotypes. N > 188 flies/genotype. Survival curves were analyzed as in C. ****P < 0.0001 for all genotypes compared to control except Vps50KO/Df (n.s.). Average age at death analyzed as in D. ****P < 0.0001. Source data are available for this figure: SourceData F1.
Figure S1.
Figure S1.
Generation of GARP and EARP knockout flies. (A) General schematic of CRISPR knockout strategy. Guide RNAs recognize sequences around PAM sites (yellow triangles). DsRed cassette flanked by loxP sites was knocked-in in place of the gene of interest to generate DsRed+ knockout (KO) lines. DsRed cassette was removed by crossing to a Cre recombinase line to generate the final knockouts. (B, D, and F) Schematic of Vps50, Vps53, and scattered (Vps54) wild-type genes and knockouts, respectively. Genes are shown in their relative orientation in the genome. Black lines above indicate hybridization sites for genotyping primers. (C, E, and G) Agarose gel of genotyping PCR for Vps50, Vps53, and Vps54 knockout lines, respectively. +/+ = w1118. For Vps50 and Vps54, DNA was isolated from adult males. Because Vps53KO is lethal in the pupal stage, DNA was isolated from wandering third instar larvae. Bp = base pairs. (H) Western blot of head lysates from control, Vps54KO/+ and Vps54KO/KO larvae probed with antibodies raised against Vps54/scattered and tubulin (loading control). See Table S1 for cloning and genotyping primer sequences. Source data are available for this figure: SourceData FS1.
Figure 2.
Figure 2.
Vps53KO/KO MARCM clonal neurons have smaller dendritic arbors. (A) Representative maximum z-projections of MARCM control FRT40A, Vps53KO/KO, and Vps53KO/KO; ppk > Vps53 c4da neuron clones labeled with ppk-Gal4, UAS-CD4-tdGFP. Images were collected from 7-d-old male pharate adults. Yellow arrows point to the soma. Scale bar = 50 μm. (B) Quantification of total dendrite branch length, ****P < 0.0001, n.s. P = 0.1797. (C) Quantification of total branch number, ****P < 0.0001, n.s. P = 0.2579. Both total dendrite branch length and number were analyzed by one-way ANOVA with Tukey’s post-test. Data presented as mean ± SD. (D) Sholl analysis. Curves are the average number of intersections/radius. For B–D, MARCM control FRT40A n = 8 independent neurons; Vps53KO/KO n = 13 independent neurons; and Vps53KO/KO; ppk > Vps53 n = 11 independent neurons. Flies were collected from at least three independent experiments.
Figure 3.
Figure 3.
Both the GARP and EARP complexes are necessary for dendrite arborization in class 4 da neurons. (A) Representative maximum intensity z-projections of class IV da neurons labeled with ppk-Gal4, UAS-CD4-tdTomato from 7-d-old male pharate adults. Yellow arrows point to the soma. Scale bar = 50 μm. Both total dendrite branch length and number were analyzed by one-way ANOVA with Tukey’s post-test. Data presented as mean ± SD. (B) Quantification of total dendrite length ***P = 0.0001, ****P < 0.0001, +/+ vs. Vps50KO/KO; ppk > Vps50, P = 0.278, +/+ vs. Vps54KO/KO; ppk > Vps54, P = 0.3165m, Vps50KO/KO vs. Vps54KO/KO ***P = 0.0003. (C) Quantification of total dendrite branch number. +/+ vs. Vps54KO/KO; ppk > Vps54, *P = 0.0107, Vps54KO/KO vs. Vps54KO/KO; ppk > Vps54, *P = 0.0178), +/+ vs. Vps50KO/KO **P = 0.009, ****P < 0.0001, Vps50KO/KO vs. Vps54KO/KO ****P < 0.0001, remaining n.s. comparisons P > 0.27. (D) Sholl analysis. Curves are the average number of intersections/radius. For B–D, n = 7–12 independent neurons/genotype. (E) Quantification of total dendrite branch length over development from 72 h APF to 21 d after eclosion. Analyzed by two-way ANOVA with Tukey’s post-test. Data presented as mean ± SD.**P < 0.01, ***P < 0.001, ****P < 0.0001. Please see Fig. S2, D–F for additional statistics and Table S2 for the full list of P values for the comparisons in E. +/+ n = 10 independent neurons/timepoint; Vps50KO/KO n = 9–11 independent neurons/timepoint; Vps54KO/KO n = 10–12 independent neurons/timepoint. For B–E, flies were collected from at least three independent experiments.
Figure S2.
Figure S2.
Additional support for developmental emergence of a dendritic, but not axonal, phenotype. (A) Quantification of total dendrite branch length of c4da neurons expressing RNAi against GARP and EARP complex components in 7 d adult males. RNAi are driven by ppk-Gal4 in a heterozygous chromosomal deficiency background, n = 7–13 independent neurons/genotype. RNAi control vs. Vps50 RNAi/Df *P = 0.0217, RNAi control vs. Vps54 RNAi/Df *P = 0.0238, RNAi control vs. Vps53 RNAi/Df ****P < 0.0001, remaining comparisons, P > 0.31. (B) Total dendrite branch length of c4da neurons from 3rd instar larvae 96 h after egg lay (AEL). For maternal effect samples, we examined homozygous KO flies from homozygous KO females crossed to heterozygous KO males. Comparison of each genotype to +/+ P > 0.16. (C) Coverage index (neuron area/receptive field area) of neurons from 96 h AEL larvae. Comparison of each genotype to +/+, P > 0.11. For B and C, n = 6–9 neurons/genotype. A–C were analyzed by one-way ANOVA with Tukey’s post-test. Data presented as mean ± SD. (D–F) Additional analysis for data in Fig. 3 E. Graphs show statistics comparing total dendrite length across timepoints for (D) +/+, (E) Vps50KO/KO, and (F) Vps54KO/KO. Analyzed by two-way ANOVA with Tukey’s post-test. Data presented as mean ± SD. Please see Table S2 for the list of P-values. (G and H) Representative images of axon terminals of FRT40A MARCM control, Vps53KO/KO MARCM, and Vps54KO/KO MARCM clones from 6- to 8-d-old adult ventral nerve cord. Top, CD4-tdGFP labeling the neuronal membrane. Bottom: traces of axon terminals. Scale bar = 40 μm. (H) Quantification of axon terminal branch length, n = 10 independent clones/genotype. Analyzed by one-way ANOVA with Tukey’s post-test, n.s. P > 0.41. Samples for all experiments were collected from at least three independent experiments.
Figure 4.
Figure 4.
Loss of the GARP complex also impairs class I da neuron dendrite remodeling. (A) Representative maximum intensity z-projections of c1da neurons from +/+ (UAS-CD4-tdTomato/+; SmidC161 Gal4/+), Vps50KO/KO (Vps50KO, UAS-CD4-tdTomato/Vps50KO; SmidC161 Gal4/+), Vps54KO/KO (Vps54KO, UAS-CD4-tdTomato/Vps54KO; SmidC161 Gal4/+), and Vps54KO/KO, Smid161>Vps54 (Vps54KO, UAS-CD4-tdTomato/Vps54KO; SmidC161 Gal4/UAS-Vps54) pharate adults (0–8 h after eclosion). Yellow arrows point to the soma. Scale bar = 25 μm. (B) Quantification of total dendrite length of adult c1da neurons. *P = 0.0222, ****P < 0.0001, n.s. P > 0.16. (C) Quantification of larval c1da neurons (96 h AEL) labeled with Gal4221>UAS-CD4-tdGFP, all comparisons n.s. P > 0.78. Both B and C were analyzed by one-way ANOVA with Tukey’s post-test. Data presented as mean ± SD. N = 10 independent neurons/genotype. Samples were collected from at least three independent experiments.
Figure 5.
Figure 5.
Complex-specific impairments in organelle populations. (A) Maximum intensity z-projections of endogenous Rab5 staining in neurons from 1-d-old flies. Dashed lines indicate soma area. Scale bars = 2.5 μm. (B) Quantification of the number of Rab5 puncta/soma, n = 16–18 independent samples/genotype. For all graphs in this figure, each data point represents the average of 1–3 cells/sample. Data for each organelle marker was obtained from at least three independent experiments. All organelle data were analyzed by one-way ANOVA with Tukey’s post-test. +/+ vs. Vps50KO/KO **P = 0.0061, Vps50KO/KO vs. Vps50KO/KO; ppk > Vps50 *P = 0.0106. All other comparisons, n.s. P > 0.96. (C) Maximum intensity z-projections of endogenous Rab7 staining. (D) Quantification of the number of Rab7 puncta/soma, n = 17–20 independent samples/genotype. +/+ vs. Vps50KO/KO *P = 0.0251, Vps54KO/KO vs. Vps54KO/KO; ppk > Vps54 n.s. P = 0.0746. All other comparisons n.s. P > 0.37. (E) Maximum intensity z-projections of the transgene UAS-GFP-Lamp expressed in c4da neurons from +/+ (ppk > GFP-Lamp), Vps50KO/KO (Vps50KO, UAS-GFP-Lamp/Vps50KO; ppk-Gal4, UAS-CD4-tdTomato/+), Vps54KO/KO (Vps54KO, UAS-GFP-Lamp/Vps54KO; ppk-Gal4, UAS-CD4-tdTomato/+), and Vps54KO/KO (Vps54KO, UAS-GFP-Lamp/Vps54KO; ppk-Gal4, UAS-CD4-tdTomato/UAS-Vps54). (F) Quantification of the number of GFP-Lamp puncta/soma, n = 23 independent samples/genotype. +/+ vs. Vps54KO/KO **P = 0.006, Vps54KO/KO vs. Vps54KO/KO; ppk > Vps54 *P = 0.0268. All other comparisons n.s. P > 0.99. (G) Maximum intensity z-projection of endogenous Golgin245 staining. (H) Quantification of the number Golgi245 puncta/soma, n = 18–21 independent samples/genotype. +/+ vs. Vps54KO/KO *P = 0.0425. Vps54KO/KO vs. Vps54KO/KO; ppk > Vps54 *P = 0.0173. All other comparisons n.s. P > 0.12. For additional organelle parameters, see Fig. S3.
Figure S3.
Figure S3.
Additional analyses of organelle phenotypes in Fig. 5. (A–E) Additional quantification of Rab5 data from Fig. 5, A and B. Quantification of (A) puncta area and (B) mean fluorescence intensity in the soma. n = 16–18 independent samples/genotype. For all graphs in this figure, each data point represents the average of 1–3 cells/sample. Data for each organelle marker was obtained from at least three independent experiments. All organelle data were analyzed by one-way ANOVA with Tukey’s post-test. All comparisons n.s. P > 0.10. Quantification of Rab5 (C) puncta number/10 μm of dendrite length, (D) puncta area, and (E) mean fluorescence intensity in proximal dendrites. All comparisons were n.s. P > 0.15. (F–J) Additional quantification of Rab7 data from Fig. 5, C and D, n = 17–20 independent samples/genotype. Quantification of (F) Rab7 puncta area. +/+ vs. Vps50KO/KO n.s. P = 0.0526. All other comparisons n.s. P > 0.14. (G) Rab7 mean fluorescence intensity in the soma. All comparisons n.s. P > 0.14. (H–J) Quantification of Rab7 in proximal dendrites. (H) Puncta number/10 μm of dendrite length, n.s. P > 0.34 for all comparisons. (I) Rab7 puncta area. +/+ vs. Vps50KO/KO puncta area n.s. P = 0.077. Other comparisons n.s. P > 0.25. (J) Rab7 mean fluorescence intensity, n.s. P > 0.25. (K and L) Additional quantification of GFP-Lamp data from Fig. 5, E and F. N = 23 independent samples/genotype. (K) GFP-Lamp puncta area +/+ vs. Vps54KO/KO; ppk > Vps54 n.s. P = 0.0581. All other comparisons n.s. P > 0.44. (L) GFP-Lamp mean fluorescence intensity. Vps54KO/KO vs. Vps54KO/KO; ppk > Vps54 **P = 0.0045. All other comparisons n.s. P > 0.10. (M–O) Quantification of spin-RFP puncta in the soma. N = 10–12 independent samples/genotype. (M) Spin-RFP puncta number/soma. All comparisons n.s. P > 0.07. (N) Spin-RFP puncta area +/+ vs. Vps54KO/KO ***P = 0.0003. +/+ vs. Vps50KO/KO n.s. P = 0.9942. (O) Quantification of spin-RFP mean fluorescence intensity. All comparisons n.s. P > 0.09. (P and Q) Quantification of endosomes from the soma of class IV da neurons from larvae 96 h after egg lay for (P) rab5 (n = 11–15 independent samples/genotype) and (Q) rab7 (n = 10–14 independent samples/genotype). (R) Representative Western blot of head lysates from 1 d old +/+, Vps50KO/KO and Vps54KO/KO flies probed with antibodies against cathepsin L and tubulin. (S and T) Quantification of the (S) immature and (T) mature forms of cathepsin L. Samples are technical triplicates from two independent experiments. Analyzed by one-way ANOVA with Tukey’s post-test, n.s. P > 0.23. U-Y Additional quantification of Golgin245 data from Fig. 5, G and H. N = 18–21 independent samples/genotype. (U and V) Quantification of Golgin245 (U) puncta area and (V) mean fluorescence intensity from the soma. All comparisons n.s. P > 0.5. (W–Y) Quantification of Golgin245 (W) puncta number/10 μm of dendrite length, (X) puncta area and (Y) mean fluorescence intensity in proximal dendrites. All comparisons n.s. P > 0.14. Source data are available for this figure: SourceData FS3.
Figure 6.
Figure 6.
Accumulation of free sterol at the TGN during dendrite regrowth in GARP deficient neurons. (A) Maximum intensity z-projections showing total filipin staining in the soma of +/+, Vps50KO/KO, Vps54KO/KO, and Vps54KO/KO; ppk > Vps54 neurons at 96 h APF. Scale bar = 1 μm. Images are pseudocolored with the fire LUT in which cooler colors indicate lower and hotter colors indicate higher fluorescence intensity values. Bright spots within the soma appear to overlap with the ER marker Sec61β (see Fig. S4, C and D). (B) Quantification of filipin fluorescence intensity at 96 h APF, n = 30–33 independent samples/genotype. Data were normalized to average control value for each experiment to account for inter-experimental differences in filipin intensity. Analyzed by one-way ANOVA with Tukey’s post-test. +/+ vs. Vps54KO/KO ***P = 0.0004, Vps54KO/KO vs. Vps54KO/KO; ppk > Vps54 *P = 0.0463. Other comparisons n.s. P > 0.45. (C) Quantification of filipin fluorescence intensity in +/+, Vps50KO/KO, Vps54KO/KO neurons across development. N ≥ 17 independent samples/genotype at each timepoint. Analyzed by two-way ANOVA with Šidák’s multiple comparison’s correction, *P = 0.0312. (D–G) Sterol levels in organelles. (D) For each genotype, left and middle panels show maximum intensity projections of Rab7 and filipin staining. To obtain the filipin signal from late endosomes, a mask was generated using the Rab7 z-stack and applied to the filipin z-stack. Right panel shows maximum intensity projection of the extracted filipin signal in Rab7+-late endosomes. Dashed line shows soma area. (E) Quantification of late endosome-associated filipin staining. Analyzed by two-sided Mann-Whitney U test, n.s. P = 0.1229. N = 20–23 independent samples/genotype. (F) As in D, except with Golgin245 to obtain filipin signal in the TGN. (G) Quantification of TGN-associated filipin signal. Analyzed by unpaired two-sided t test, **P = 0.0038. N = 9–10 independent samples/genotype. Samples were collected from at least three independent experiments.
Figure S4.
Figure S4.
Sterol accumulation in GARP deficient neurons. (A) Filipin staining in lysosomes. For each genotype, left and middle panels show maximum intensity projections of Spin-RFP and filipin staining from 96 h APF pupae. Filipin images are pesudocolored with the fire LUT which cooler colors indicate lower and hotter colors indicate higher fluorescence intensity values. Scale bar = 1 μm. To obtain the filipin signal from lysosomes, a mask was generated using the Spin-RFP z-stack and applied to the filipin z-stack. Right panel shows maximum intensity projection of the extracted filipin signal in Spin+-lysosomes. (B) Quantification of lysosome-associated filipin staining. Analyzed by two-sided Mann-Whitney U test, n.s. P = 0.1064. N = 15 independent samples/genotype. (C) As in A, except with Sec61β to obtain filipin signal in the ER. (D) Quantification of ER-associated filipin signal. Analyzed by unpaired two-sided t test, n.s. P = 0.9006. N = 16–19 independent samples/genotype.
Figure 7.
Figure 7.
Targeting specific lipid regulators at the TGN modulates GARP KO phenotypes. (A) Representative maximum intensity z-projections of c4da neurons from 7-d-old males showing the effect of Osbp manipulation in the Vps54KO/KO background. Scale bar = 50 μm. Yellow arrows point to the soma. (B) Quantification of total dendrite branch length. Data presented as mean ± SD. N ≥ 10 independent neurons/genotype except +/+ and Vps54KO/KO (both n = 6). Analyzed by one-way ANOVA with Tukey’s post-test. ****P < 0.0001. +/+ vs. ppk > Osbp **P = 0.0041. Vps54KO/KO vs. Vps54KO/KO; Osbp1/+ **P = 0.0027. Osbp1/+ vs. Vps54KO/KO; Osbp1/+ *P = 0.039. (C) Representative maximum intensity z-projections of c4da neurons from 7-d-old males showing the effect of fwd RNAi knockdown using the ppk-Gal4 to drive RNAi expression. (D) Quantification of total dendrite branch length. Data presented as mean ± SD. N ≥ 8–14 independent neurons/genotype. ****P < 0.0001. (E and F) Quantification of filipin fluorescence intensity showing the effect of Osbp manipulation in Vps54KO/KO neurons at 96 h APF. N ≥ 13 independent samples/genotype. Analyzed by one-way ANOVA with Šidák’s post-test. (E) Total filipin staining in the soma. +/+ vs. Vps54KO/KO, Vps54KO/KO vs. Vps54KO/KO; ppk > Osbp, and Vps54KO/KO vs. Vps54KO/KO; Osbp1/+ ****P < 0.0001. All other comparisons n.s. P > 0.76. (F) TGN-associated filipin staining. +/+ vs. Vps54KO/KO **P = 0.0079. Vps54KO/KO vs. Vps54KO/KO; ppk > Osbp ***P = 0.0001. Vps54KO/KO vs. Vps54KO/KO; Osbp1/+ *P = 0.0362. Other comparisons n.s. P > 0.83. (G and H) Quantification of filipin fluorescence intensity showing the effect of fwd knockdown in Vps54KO/KO neurons, n ≥ 18 independent samples/genotype. (G) Total filipin staining in the soma. RNAi control vs. Vps54KO/KO; RNAi control *P = 0.0275. RNAi control vs. Vps54KO/KO; fwd RNAi *P = 0.0123. fwd RNAi vs. Vps54KO/KO; fwd RNAi ****P, 0.0001. N.s. P > 0.38. (H) TGN-associated filipin staining. RNAi control vs. Vps54KO/KO; RNAi control **P = 0.0099. RNAi control vs. Vps54KO/KO; fwd RNAi *P = 0.0231. fwd RNAi vs. Vps54KO/KO; fwd RNAi ***P = 0.0002. N.s. P > 0.69. (I) Representative P4M-GFP images from RNAi control and fwd RNAi neurons. Left and middle panels show maximum intensity projections of Golgin245 and P4M-GFP, respectively. Right panel shows maximum intensity projection of extracted TGN-associated P4M-GFP signal. P4M-GFP images pseudocolored with the fire LUT. Dashed line shows soma area. Scale bar = 1 μm. (J) Quantification of TGN associated P4M-GFP fluorescence intensity from fwd RNAi samples. TGN P4M-GFP intensity levels normalized to total soma levels to account for variation in reporter expression. N = 15–16 independent samples/genotype. RNAi vs. fwd RNAi ***P = 0.0001. Vps54KO/KO; fwd RNAi vs. Vps54KO/KO; RNAi control **P = 0.0011. fwd RNAi vs. Vps54KO/KO; fwd RNAi *P = 0.0438. N.S. P > 0.23. (K) Same as in J but for Osbp samples, n.s. P > 0.22.
Figure S5.
Figure S5.
Changing Vap33 expression does not affect dendrites in Vps54KO/KO neurons Quantification of total dendrite branch length of class IV da neurons in 7-d-old adults. Analyzed by one-way ANOVA with Tukey’s post-test. Data presented as mean ± SD. (A) Effect of overexpression of Vap33 in c4da neurons. +/+ vs. Vps54KO/KO ***P = 0.0007. +/+ vs. ppk > Vap33 *P = 0.0265. +/+ vs. Vps54KO/KO; ppk > Vap33 ***P = 0.0001. Vps54KO/KO vs. Vps54KO/KO; ppk > Vap33 n.s. P = 0.9984. (B) Effect of Vap33 knockdown in c4da neurons. RNAi control vs. Vps54KO/KO; RNAi control ****P < 0.0001. RNAi control vs. Vps54KO/KO; Vap33 RNAi ***P = 0.0009. Vps54KO/KO; RNAi control vs. Vps54KO/KO; Vap33 RNAi n.s. P = 0.8367. N = 8–10 independent neurons for all genotypes except +/+ and Vps54KO/KO in A (n = 6 neurons for both).
Figure 8.
Figure 8.
Depletion of Osbp rescues TGN but not late endosomal morphology in GARP KO neurons. (A) Representative maximum intensity z-projections of endogenous Golgin245 staining from c4da neurons in pupae 96 h APF. Dashed line shows soma area. Scale bar = 1 μm. For B–D, n = 22–27 independent samples/genotype. All data in this figure were analyzed by one-way ANOVA with Tukey’s post-test. Samples were obtained from at least three independent experiments. (B) Quantification of the number of Golgin245 puncta/soma. +/+ vs. Vps54KO/KO ****P < 0.0001, Vps54KO/KO vs. Vps54KO/KO; Osbp1/+ *P = 0.0404. +/+ vs. Vps54KO/KO; Osbp1/+ n.s. P = 0.1728. (C) Golgin245 fluorescence intensity. +/+ vs. Osbp1/+ *P = 0.0406. +/+ vs. Vps54KO/KO n.s. P = 0.0808, +/+ vs. Vps54KO/KO; Osbp1/+ P = 0.0683. (D) Golgin puncta area. n.s. P > 0.24. (E) Representative maximum intensity z-projections of endogenous Rab7 staining from c4da neurons in pupae 96 h APF. (F–H) For F–H, n = 23–28 independent samples/genotype. (F) Quantification of the number of Rab7 puncta in the soma. +/+ vs. Vps54KO/KO **P = 0.0067. +/+ vs. Osbp1/+ **P = 0.0013. +/+ vs. Vps54KO/KO; Osbp1/+ **P = 0.0029. Other comparisons n.s. P > 0.98. (G) Rab7 fluorescence intensity. +/+ vs. Osbp1/+ **P = 0.0404. Other comparisons P > 0.11. (H) Rab7 puncta area. All comparisons, n.s. P > 0.36.

Comment in

  • Dendrite remodeling according to GARP.
    Shin GJ, Grueber WB. Shin GJ, et al. J Cell Biol. 2023 Jan 2;222(1):e202211072. doi: 10.1083/jcb.202211072. Epub 2022 Dec 22. J Cell Biol. 2023. PMID: 36547519 Free PMC article.

References

    1. Ascano, M., Richmond A., Borden P., and Kuruvilla R.. 2009. Axonal targeting of Trk receptors via transcytosis regulates sensitivity to neurotrophin responses. J. Neurosci. 29:11674–11685. 10.1523/JNEUROSCI.1542-09.2009 - DOI - PMC - PubMed
    1. Balakrishnan, S.S., Basu U., Shinde D., Thakur R., Jaiswal M., and Raghu P.. 2018. Regulation of PI4P levels by PI4KIIIα during G-protein coupled PLC signaling in Drosophila photoreceptors. J. Cell Sci. 131:jcs.217257. 10.1242/jcs.217257 - DOI - PMC - PubMed
    1. Bateman, J.R., Lee A.M., and Wu C.T.. 2006. Site-specific transformation of Drosophila via phiC31 integrase-mediated cassette exchange. Genetics. 173:769–777. 10.1534/genetics.106.056945 - DOI - PMC - PubMed
    1. van den Boomen, D.J.H., Sienkiewicz A., Berlin I., Jongsma M.L.M., van Elsland D.M., Luzio J.P., Neefjes J.J.C., and Lehner P.J.. 2020. A trimeric Rab7 GEF controls NPC1-dependent lysosomal cholesterol export. Nat. Commun. 11:5559. 10.1038/s41467-020-19032-0 - DOI - PMC - PubMed
    1. Castrillon, D.H., Gonczy P., Alexander S., Rawson R., Eberhart C.G., Viswanathan S., DiNardo S., and Wasserman S.A.. 1993. Toward a molecular genetic analysis of spermatogenesis in Drosophila melanogaster: Characterization of male-sterile mutants generated by single P element mutagenesis. Genetics. 135:489–505. 10.1093/genetics/135.2.489 - DOI - PMC - PubMed

Publication types