. 2023 Jan 4;29(1):244-260.
doi: 10.1158/1078-0432.CCR-22-2041.

Colorectal Cancer Metastases in the Liver Establish Immunosuppressive Spatial Networking between Tumor-Associated SPP1+ Macrophages and Fibroblasts

Affiliations

Colorectal Cancer Metastases in the Liver Establish Immunosuppressive Spatial Networking between Tumor-Associated SPP1+ Macrophages and Fibroblasts

Anuja Sathe et al. Clin Cancer Res. .

Abstract

Purpose: The liver is the most frequent metastatic site for colorectal cancer. Its microenvironment is modified to provide a niche that is conducive for colorectal cancer cell growth. This study focused on characterizing the cellular changes in the metastatic colorectal cancer (mCRC) liver tumor microenvironment (TME).

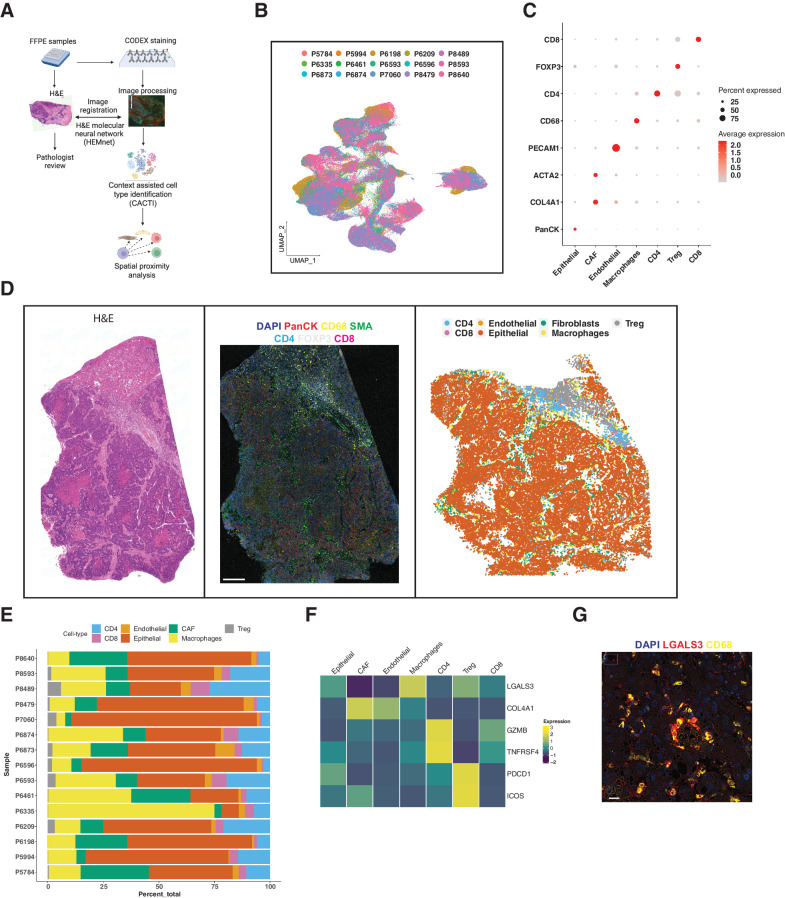
Experimental design: We analyzed a series of microsatellite stable (MSS) mCRCs to the liver, paired normal liver tissue, and peripheral blood mononuclear cells using single-cell RNA sequencing (scRNA-seq). We validated our findings using multiplexed spatial imaging and bulk gene expression with cell deconvolution.

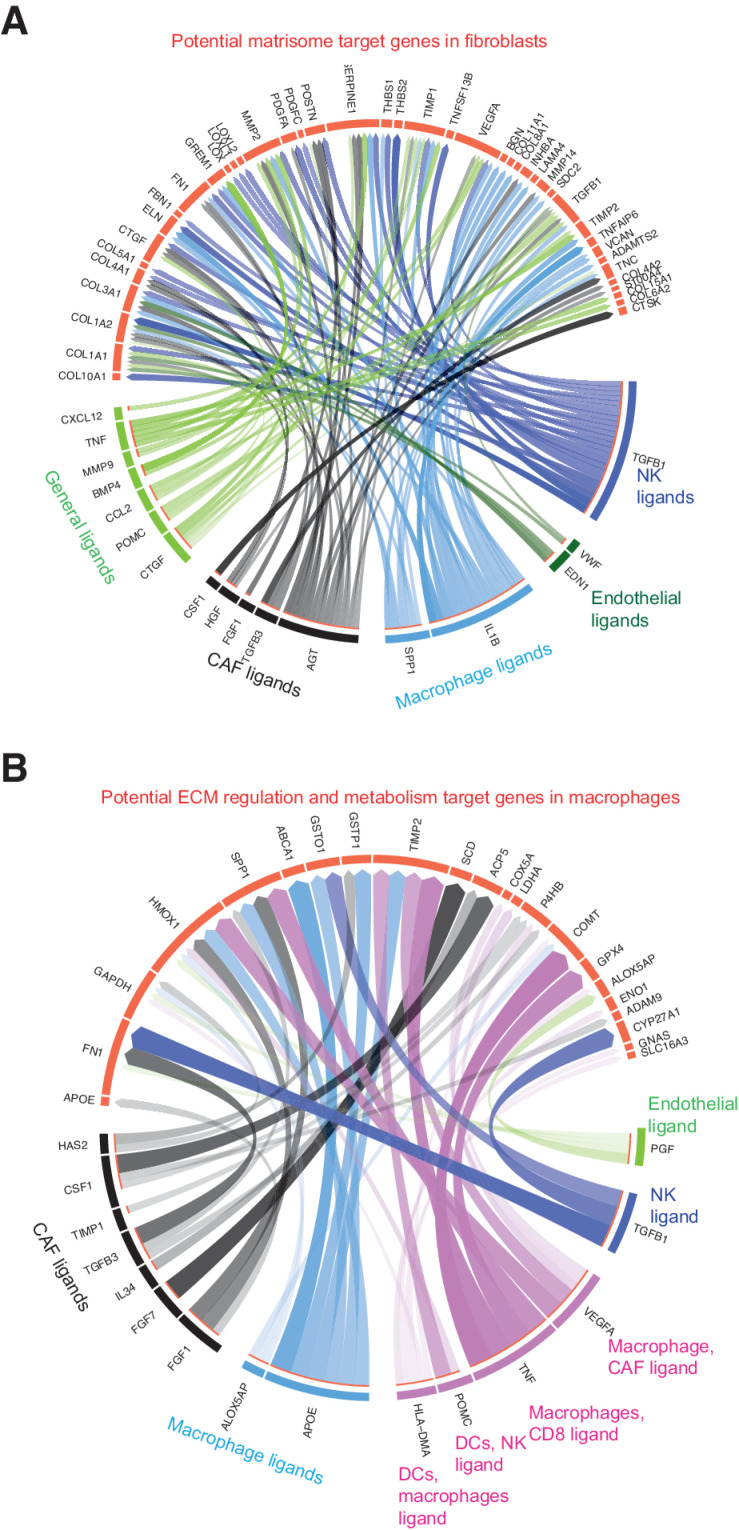
Results: We identified TME-specific SPP1-expressing macrophages with altered metabolism features, foam cell characteristics, and increased activity in extracellular matrix (ECM) organization. SPP1+ macrophages and fibroblasts expressed complementary ligand-receptor pairs with the potential to mutually influence their gene-expression programs. TME lacked dysfunctional CD8 T cells and contained regulatory T cells, indicative of immunosuppression. Spatial imaging validated these cell states in the TME. Moreover, TME macrophages and fibroblasts had close spatial proximity, which is a requirement for intercellular communication and networking. In an independent cohort of mCRCs in the liver, we confirmed the presence of SPP1+ macrophages and fibroblasts using gene-expression data. An increased proportion of TME fibroblasts was associated with the worst prognosis in these patients.

Conclusions: We demonstrated that mCRC in the liver is characterized by transcriptional alterations of macrophages in the TME. Intercellular networking between macrophages and fibroblasts supports colorectal cancer growth in the immunosuppressed metastatic niche in the liver. These features can be used to target immune-checkpoint-resistant MSS tumors.


Figures

Figure 1. A, Schematic representation of study design. B–C, UMAP representation of dimensionally reduced data following batch-corrected graph-based clustering of all data sets colored by (B) samples and (C) cell type. D, Dot plot depicting average expression levels of specific lineage-based marker genes together with the percentage of cells expressing the marker. E, Proportion of cell types detected from each sample. B–E, Data from seven mCRCs, five paired normal liver tissue and two paired PBMCs.
Figure 1.
A, Schematic representation of study design. B–C, UMAP representation of dimensionally reduced data following batch-corrected graph-based clustering of all data sets colored by (B) samples and (C) cell type. D, Dot plot depicting average expression levels of specific lineage-based marker genes together with the percentage of cells expressing the marker. E, Proportion of cell types detected from each sample. B–E, Data from seven mCRCs: five paired normal liver tissue and two paired PBMCs. (A, Created with BioRender.com.)
Figure 2. A–B, UMAP representation of dimensionally reduced data following batch-corrected graph-based clustering of all myeloid lineage cells annotated by (A) condition and (B) cluster numbers. C, Heat map depicting expression of five highest significantly expressed genes (adjusted P < 0.05) per cluster. D, Heat map depicting the expression of highest top 15 significantly expressed genes in normal and tumor macrophages (adjusted P < 0.05). E, Selected differentially enriched Reactome pathways in tumor macrophages. F, Violin plots depicting the expression of gene signatures of foam cells or scar-associated macrophages in normal and tumor macrophages with t test P value. A–C, Data from seven mCRCs, five paired normal liver tissue and two paired PBMCs. D–F, Data from seven mCRCs and five paired normal liver tissue.
Figure 2.
A–B, UMAP representation of dimensionally reduced data following batch-corrected graph-based clustering of all myeloid lineage cells annotated by (A) condition and (B) cluster numbers. C, Heat map depicting expression of five highest significantly expressed genes (adjusted P < 0.05) per cluster. D, Heat map depicting the expression of highest top 15 significantly expressed genes in normal and tumor macrophages (adjusted P < 0.05). E, Selected differentially enriched Reactome pathways in tumor macrophages. F, Violin plots depicting the expression of gene signatures of foam cells or scar-associated macrophages in normal and tumor macrophages with t test P value. A–C, Data from seven mCRCs: five paired normal liver tissue and two paired PBMCs. D–F, Data from seven mCRCs and five paired normal liver tissue.
Figure 3. A–C, UMAP representation of dimensionally reduced data following batch-corrected graph-based clustering of all stromal lineage cells annotated by (A) condition, (B) cell types, and (C) cluster numbers. D, Heat map depicting expression of five highest significantly expressed genes (adjusted P < 0.05) per stromal cell cluster. E, Violin plots depicting the expression of selected matrisome components in differentially expressed genes in CAFs. A–E, Data from seven mCRCs and five paired normal liver tissue.
Figure 3.
A–C, UMAP representation of dimensionally reduced data following batch-corrected graph-based clustering of all stromal lineage cells annotated by (A) condition, (B) cell types, and (C) cluster numbers. D, Heat map depicting expression of five highest significantly expressed genes (adjusted P < 0.05) per stromal cell cluster. E, Violin plots depicting the expression of selected matrisome components in differentially expressed genes in CAFs. A–E, Data from seven mCRCs and five paired normal liver tissue.
Figure 4. A–B, Predicted ligands that regulate respective target genes in (A) CAFs and (B) macrophages. Ligands are annotated by the cell type that expresses them. General ligands indicate ligands expressed by more than one cell type. Edges are scaled by the inferred regulatory potential of the interaction. A–B, Data from seven mCRCs and five paired normal liver tissue.
Figure 4.
A–B, Predicted ligands that regulate respective target genes in (A) CAFs and (B) macrophages. Ligands are annotated by the cell type that expresses them. General ligands indicate ligands expressed by more than one cell type. Edges are scaled by the inferred regulatory potential of the interaction. Data from seven mCRCs and five paired normal liver tissue.
Figure 5. A, Schematic representation of CODEX analysis. B, UMAP representation of dimensionally reduced CODEX data following batch-corrected graph-based clustering of 15 mCRCs colored by samples. C, Dot plot depicting average expression levels in 15 mCRCs of specific lineage-based marker proteins together with the percentage of cells expressing the marker. D, Example of the P7060 tumor with adjacent H&E section (left), CODEX staining of selected cell lineage markers (middle), and graphical representation of identified cell types in image data (right). Scale bar, 1.07 mm. E, Proportion of cell types detected from each sample. F, Heat map depicting average expression in 15 mCRCs of selected proteins across all samples in respective cell types. G, Example of P7060 tumor with CODEX staining of selected markers. Scale bar, 90 μm.
Figure 5.
A, Schematic representation of CODEX analysis. B, UMAP representation of dimensionally reduced CODEX data following batch-corrected graph-based clustering of 15 mCRCs colored by samples. C, Dot plot depicting average expression levels in 15 mCRCs of specific lineage-based marker proteins together with the percentage of cells expressing the marker. D, Example of the P7060 tumor with adjacent H&E section (left), CODEX staining of selected cell lineage markers (middle), and graphical representation of identified cell types in image data (right). Scale bar, 1.07 mm. E, Proportion of cell types detected from each sample. F, Heat map depicting average expression in 15 mCRCs of selected proteins across all samples in respective cell types. G, Example of P7060 tumor with CODEX staining of selected markers. Scale bar, 90 μm. (A, Created with BioRender.com.)
Figure 6. A, Schematic representation of deconvolution of cellular fractions from external bulk RNA-seq data set. B, Violin plot depicting the abundance of CAFs per patient with patients grouped according to overall survival subgroup. Data from 93 patients. Comparisons were made by ANOVA with Tukey HSD. C, Schematic representation of immunosuppressive macrophage–fibroblast networking in the mCRC TME.
Figure 6.
A, Schematic representation of deconvolution of cellular fractions from external bulk RNA-seq data set. B, Violin plot depicting the abundance of CAFs per patient with patients grouped according to overall survival subgroup. Data from 93 patients. Comparisons were made by ANOVA with Tukey HSD. C, Schematic representation of immunosuppressive macrophage–fibroblast networking in the mCRC TME. (A, Created with BioRender.com.)

References

    1. Andres A, Mentha G, Adam R, Gerstel E, Skipenko OG, Barroso E, et al. . Surgical management of patients with colorectal cancer and simultaneous liver and lung metastases. Br J Surg 2015;102:691–9. - PubMed
    1. Liu Q, Zhang H, Jiang X, Qian C, Liu Z, Luo D. Factors involved in cancer metastasis: a better understanding to "seed and soil" hypothesis. Mol Cancer 2017;16:176. - PMC - PubMed
    1. Pitroda SP, Khodarev NN, Huang L, Uppal A, Wightman SC, Ganai S, et al. . Integrated molecular subtyping defines a curable oligometastatic state in colorectal liver metastasis. Nat Commun 2018;9:1793. - PMC - PubMed
    1. Donadon M, Torzilli G, Cortese N, Soldani C, Di Tommaso L, Franceschini B, et al. . Macrophage morphology correlates with single-cell diversity and prognosis in colorectal liver metastasis. J Exp Med 2020;217:e20191847. - PMC - PubMed
    1. Huyghe N, Baldin P, Van den Eynde. M. Immunotherapy with immune checkpoint inhibitors in colorectal cancer: what is the future beyond deficient mismatch-repair tumours? Gastroenterol Rep (Oxf) 2020;8:11–24. - PMC - PubMed

Publication types