The role of depression in secondary HIV transmission among people who inject drugs in Vietnam: A mathematical modeling analysis
- PMID: 36240142
- PMCID: PMC9565425
- DOI: 10.1371/journal.pone.0275995
The role of depression in secondary HIV transmission among people who inject drugs in Vietnam: A mathematical modeling analysis
Abstract
Background: Among people who inject drugs (PWID), depression burden is high and may interfere with HIV prevention efforts. Although depression is known to affect injecting behaviors and HIV treatment, its overall impact on HIV transmission has not been quantified. Using mathematical modeling, we sought to estimate secondary HIV transmissions and identify differences by depression among PWID.
Methods: We analyzed longitudinal data from 455 PWID living with HIV in Vietnam during 2009-2013. Using a Bernoulli process model with individual-level viral load and behavioral data from baseline and 6-month follow-up visits, we estimated secondary HIV transmission events from participants to their potentially susceptible injecting partners. To evaluate differences by depression, we compared modeled transmissions per 1,000 PWID across depressive symptom categories (severe, mild, or no symptoms) in the three months before each visit.
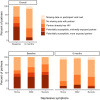
Results: We estimated a median of 41.2 (2.5th, 97.5th percentiles: 33.2-49.2) secondary transmissions from all reported acts of sharing injection equipment with 833 injecting partners in the three months before baseline. Nearly half (41%) of modeled transmissions arose from fewer than 5% of participants in that period. Modeled transmissions per 1,000 PWID in that period were highest for severe depressive symptoms (100.4, 80.6-120.2) vs. mild (87.0, 68.2-109.4) or no symptoms (78.9, 63.4-94.1). Transmission estimates fell to near-zero at the 6-month visit.
Conclusions: Secondary transmissions were predicted to increase with depression severity, although most arose from a small number of participants. Our findings suggest that effective depression interventions could have the important added benefit of reducing HIV transmission among PWID.
Conflict of interest statement
The authors have declared that no competing interests exist.
Figures


References
-
- Thomas M, Sahu D, Raj Y, Pandey A. A Probability Model for Estimating the Force of Transmission of HIV Infection and Its Application. Am J Math Stat. 2014;4(3):171–7.
-
- Degenhardt L, Peacock A, Colledge S, Leung J, Grebely J, Vickerman P, et al. Global prevalence of injecting drug use and sociodemographic characteristics and prevalence of HIV, HBV, and HCV in people who inject drugs: a multistage systematic review. Lancet Glob Heal. 2017;5(12):e1192–207. - PMC - PubMed
-
- UN Joint Programme on HIV/AIDS (UNAIDS). The Gap Report. 2014;(1):1–12. http://www.unaids.org/en/resources/documents/2014/20140716_UNAIDS_gap_re...
-
- UNODC. World Drug Report. 2016. https://www.unodc.org/wdr2016/
Publication types
MeSH terms
Grants and funding
LinkOut - more resources
Full Text Sources
Medical

