

The impact of COVID-19 pandemic on ridesourcing services differed between small towns and large cities
- PMID: 36240180
- PMCID: PMC9565726
- DOI: 10.1371/journal.pone.0275714
The impact of COVID-19 pandemic on ridesourcing services differed between small towns and large cities
Abstract
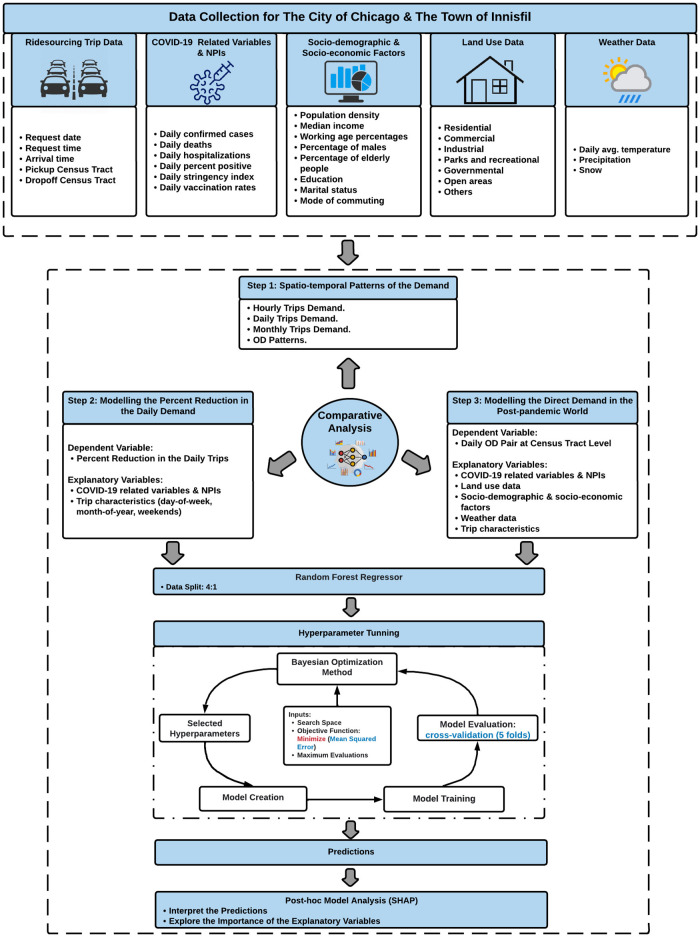
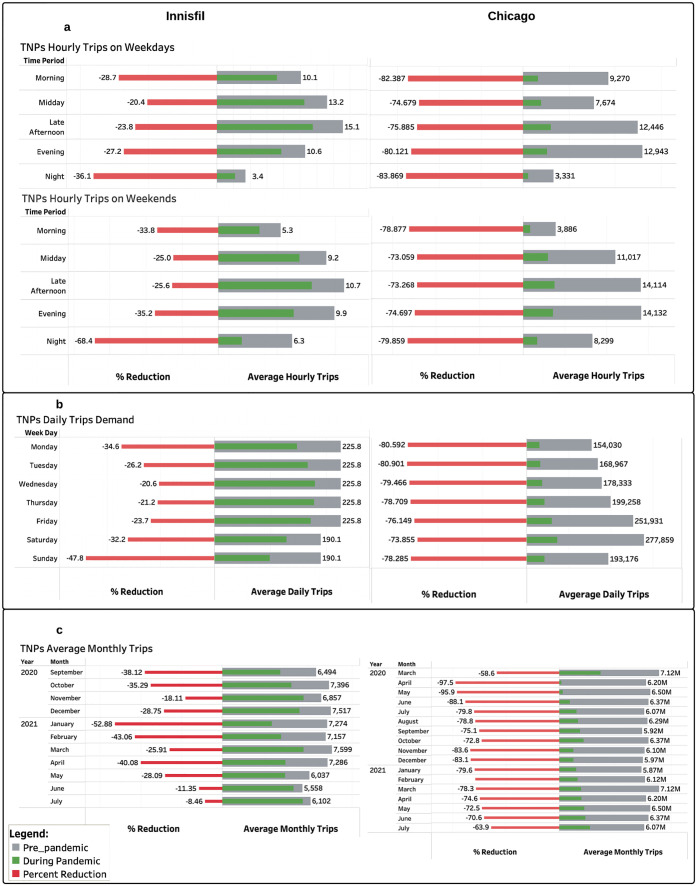
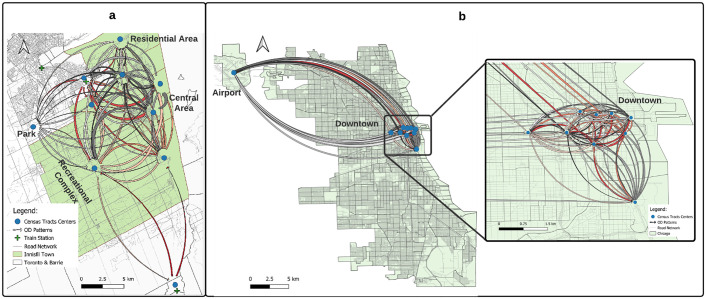
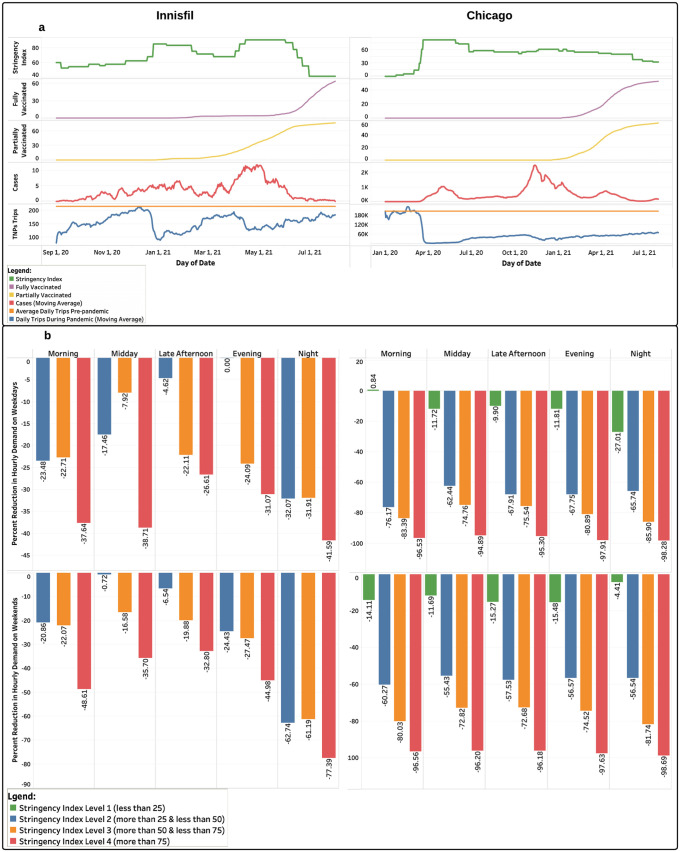
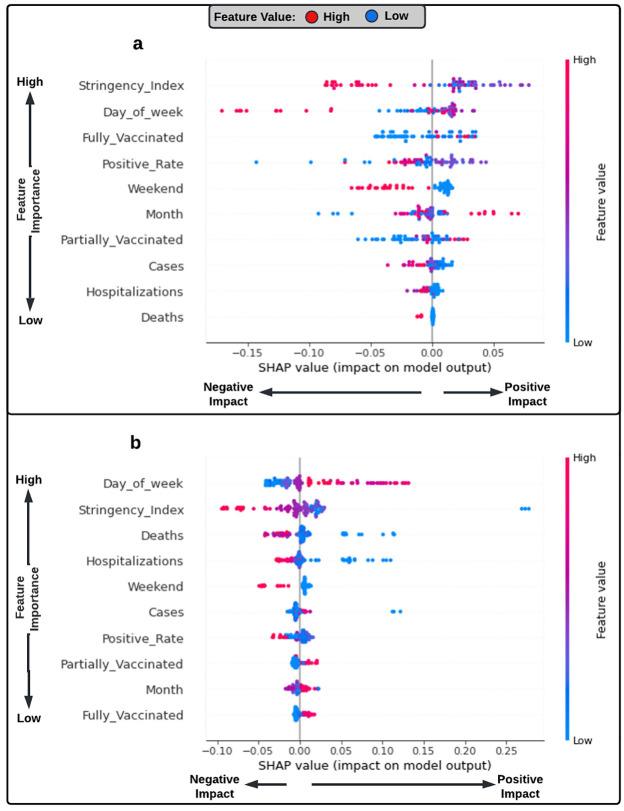
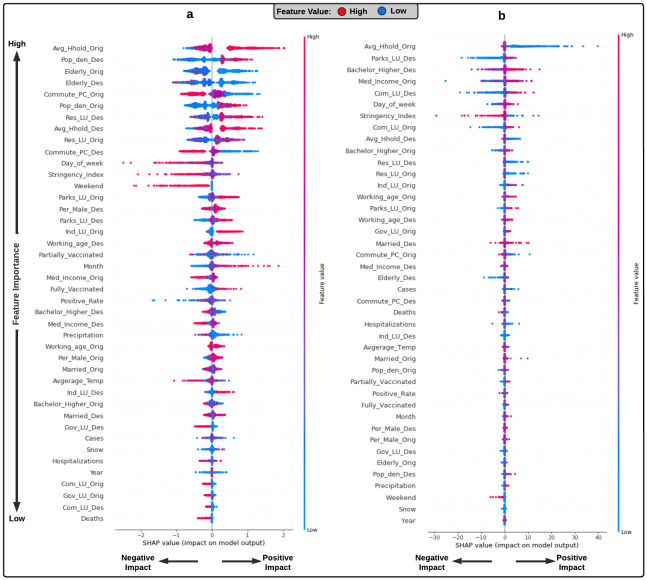
To curb the spread of the ongoing 2019 novel coronavirus (COVID-19), authorities have adopted several non-pharmaceutical (NPIs) and pharmaceutical interventions, which significantly affected our daily activities and mobility patterns. However, it is still unclear how severity of NPIs, COVID-19-related variables, and vaccination rates have affected demand for ridesourcing services, and whether these effects vary across small towns and large cities. We analyzed over 220 million ride requests in the City of Chicago (population: 2.7 million), Illinois, and 52 thousand in the Town of Innisfil (population: 37 thousand), Ontario, to investigate the impact of the COVID-19 pandemic on the ridesourcing demand in the two locations. Overall, the pandemic resulted in fewer trips in areas with higher proportions of seniors and more trips to parks and green spaces. Ridesourcing demand was adversely affected by the stringency index and COVID-19-related variables, and positively affected by vaccination rates. However, compared to Innisfil, ridesourcing services in Chicago experienced higher reductions in demand, were more affected by the number of hospitalizations and deaths, were less impacted by vaccination rates, and had lower recovery rates.
Conflict of interest statement
The authors have declared that no competing interests exist.
Figures
Similar articles
-
Historical redlining and park use during the COVID-19 pandemic: Evidence from big mobility data.J Expo Sci Environ Epidemiol. 2024 May;34(3):399-406. doi: 10.1038/s41370-023-00569-3. Epub 2023 Jun 24. J Expo Sci Environ Epidemiol. 2024. PMID: 37355763 Free PMC article.
-
Impact of COVID-19 on the mobility patterns: An investigation of taxi trips in Chicago.PLoS One. 2022 May 5;17(5):e0267436. doi: 10.1371/journal.pone.0267436. eCollection 2022. PLoS One. 2022. PMID: 35511884 Free PMC article.
-
City size and the spreading of COVID-19 in Brazil.PLoS One. 2020 Sep 23;15(9):e0239699. doi: 10.1371/journal.pone.0239699. eCollection 2020. PLoS One. 2020. PMID: 32966344 Free PMC article.
-
Untangling the changing impact of non-pharmaceutical interventions and vaccination on European COVID-19 trajectories.Nat Commun. 2022 Jun 3;13(1):3106. doi: 10.1038/s41467-022-30897-1. Nat Commun. 2022. PMID: 35661759 Free PMC article.
-
City-Scale Agent-Based Simulators for the Study of Non-pharmaceutical Interventions in the Context of the COVID-19 Epidemic: IISc-TIFR COVID-19 City-Scale Simulation Team.J Indian Inst Sci. 2020;100(4):809-847. doi: 10.1007/s41745-020-00211-3. Epub 2020 Nov 12. J Indian Inst Sci. 2020. PMID: 33199946 Free PMC article. Review.
Cited by
-
Sustainability analysis framework for on-demand public transit systems.Sci Rep. 2023 Aug 18;13(1):13488. doi: 10.1038/s41598-023-40639-y. Sci Rep. 2023. PMID: 37596316 Free PMC article.
References
-
- Sui Y, Zhang H, Song X, Shao F, Yu X, Shibasaki R, et al.. GPS data in urban online ride-hailing: A comparative analysis on fuel consumption and emissions. Journal of Cleaner Production. 2019. Aug 1;227:495–505. doi: 10.1016/j.jclepro.2019.04.159 - DOI
-
- Henao A, Marshall WE. The impact of ride hailing on parking (and vice versa). Journal of Transport and Land Use. 2019. Jan 1;12(1):127–47. doi: 10.5198/jtlu.2019.1392 - DOI
-
- Shen H, Zou B, Lin J, Liu P. Modeling travel mode choice of young people with differentiated E-hailing ride services in Nanjing China. Transportation research part D: transport and environment. 2020. Jan 1;78:102216. doi: 10.1016/j.trd.2019.102216 - DOI
-
- Gehrke SR, Felix A, Reardon TG. Substitution of ride-hailing services for more sustainable travel options in the greater Boston region. Transportation Research Record. 2019. Jan;2673(1):438–46. doi: 10.1177/0361198118821903 - DOI
Publication types
MeSH terms
LinkOut - more resources
Full Text Sources
Medical
