. 2022 Oct 14;8(41):eadd0422.
doi: 10.1126/sciadv.add0422. Epub 2022 Oct 14.

Sexually dimorphic activation of innate antitumor immunity prevents adrenocortical carcinoma development

Affiliations

Sexually dimorphic activation of innate antitumor immunity prevents adrenocortical carcinoma development

James J Wilmouth Jr et al. Sci Adv. .

Abstract

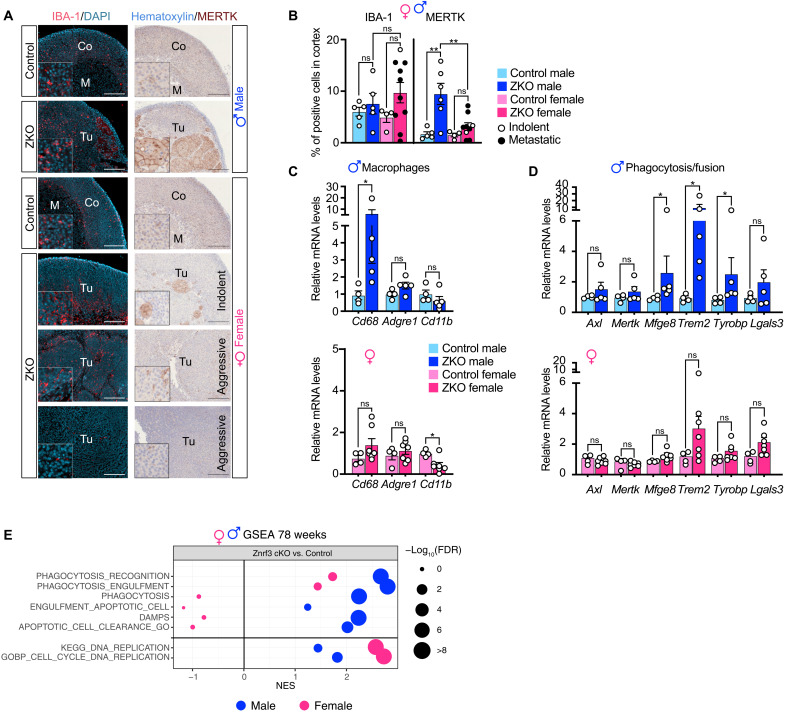
Unlike most cancers, adrenocortical carcinomas (ACCs) are more frequent in women than in men, but the underlying mechanisms of this sexual dimorphism remain elusive. Here, we show that inactivation of Znrf3 in the mouse adrenal cortex, recapitulating the most frequent alteration in ACC patients, is associated with sexually dimorphic tumor progression. Although female knockouts develop metastatic carcinomas at 18 months, adrenal hyperplasia regresses in male knockouts. This male-specific phenotype is associated with androgen-dependent induction of senescence, recruitment, and differentiation of highly phagocytic macrophages that clear out senescent cells. In contrast, in females, macrophage recruitment is delayed and dampened, which allows for aggressive tumor progression. Consistently, analysis of TCGA-ACC data shows that phagocytic macrophages are more prominent in men and are associated with better prognosis. Together, these data show that phagocytic macrophages are key players in the sexual dimorphism of ACC that could be previously unidentified allies in the fight against this devastating cancer.


Figures

Fig. 1.
Fig. 1.. Sexually dimorphic tumor progression in Znrf3 cKO adrenals.
(A) Female adrenal weights measured from 4 to 78 weeks in wild-type and Znrf3 cKO (ZKO) adrenals. (B) Rate of metastasis in 78-week-old Znrf3 cKO females. (C) Histology (top) and immunohistochemical (IHC) analysis of Ki67 expression (bottom) in 78-week-old female controls, Znrf3 cKO adrenals associated with metastasis formation, or indolent Znrf3 cKO adrenals. (D) Quantification of the Ki67 proliferation index as the ratio of positive cells over total nuclei in the cortex of 78-week-old control and Znrf3 cKO females. (E) Male adrenal weights measured from 4 to 78 weeks in wild-type and Znrf3 cKO (ZKO) adrenals. (F) Rate of metastasis in 78-week-old Znrf3 cKO males. (G) Histology (top) and IHC analysis of Ki67 expression (bottom) in 78-week-old male controls and Znrf3 cKO adrenals. (H) Quantification of the Ki67 proliferation index as the ratio of positive cells over total nuclei in the cortex of 78-week-old control and Znrf3 cKO males. (I) Kinetic analysis of the Ki67 proliferation index from 4 to 52 weeks in male and female control and Znrf3 cKO adrenals. (J) Kinetic analysis of the histological phenotype from 4 to 52 weeks in male and female control and Znrf3 cKO adrenals. Arrowheads in insets show multinucleated giant cells (MGCs) that accumulate in the inner cortex of mutant male mice and, to a lesser extent, mutant female mice. M, medulla; zF, zona fasciculata; zG, zona glomerulosa; Tu, tumor. Scale bars, 200 μm. Graphs represent means ± SEM. Statistical analyses were conducted by Mann-Whitney tests in (A), (D), (E), and (H) and by two-way ANOVA in (I). ns, not significant; *P < 0.05; **P < 0.01; ***P < 0.001; ****P < 0.0001.
Fig. 2.
Fig. 2.. Regression in male Znrf3 cKO adrenals is correlated with macrophage infiltration and fusion.
(A) GSEA of gene expression data from 4-, 6-, and 12-week-old control and Znrf3 cKO male adrenals. Plot represents the 35 gene sets from the C5 Gene Ontology database, with the highest enrichment score in Znrf3 cKO adrenals at 12 weeks. NES, normalized enrichment score. (B) Expression of cytokine/chemokine-coding genes in control and Znrf3 cKO adrenals at 4, 6, and 12 weeks. (C) IHC analysis of CD45 expression in adrenals from control and Znrf3 cKO (ZKO) mice at 4, 6, and 12 weeks. Stars show mononucleated leukocytes. (D) Stacked bar plots representing immune cell populations deconvoluted using CIBERSORTx and the LM22 expression matrix, from gene expression data in control and Znrf3 cKO male adrenals at 4, 6, and 12 weeks. WT, wild type. (E) GSEA of macrophage signatures derived from ImmuCC, LM22, and scRNA-seq of mouse adrenals (adrenal macs) (51) in 12-week-old male Znrf3 cKO adrenals. (F) Left: Dot plots of flow cytometry analysis of macrophage infiltration (defined as CD45+/CD64+/F4/80+ live cells) in 4- and 6-week-old control (top) and Znrf3 cKO (bottom) adrenals. Right: Quantification of absolute numbers of macrophages by flow cytometry. (G) IHC analysis of pan-macrophage markers IBA-1, F4/80, and CD68 in 4-, 6-, and 12-week-old control and Znrf3 cKO adrenals. (H) IHC for macrophage fusion–associated markers TREM2 and TYROBP in 6- and 12-week-old control and Znrf3 cKO adrenals. (I) High-magnification images of TREM2 and TYROBP staining showing fusion of mononucleated with multinucleated macrophages in Znrf3 cKO adrenals at 12 weeks. In (C) and (G) to (I), arrowheads show MGCs and stars show mononucleated macrophages. Co, cortex. Scale bars, 200 μm. Graphs represent means ± SEM. Statistical analyses in (F) were conducted by Mann-Whitney tests. *P < 0.05; **P < 0.01. DAPI, 4′,6-diamidino-2-phenylindole.
Fig. 3.
Fig. 3.. Infiltrating macrophages actively phagocytose steroidogenic cells.
(A) GSEA of gene expression data from 4-, 6-, and 12-week-old control and Znrf3 cKO male adrenals. The plot represents enrichment of phagocytosis/efferocytosis gene sets in Znrf3 cKO male adrenals. (B) Expression of key regulators of the phagocytic pathway in control and Znrf3 cKO male adrenals at 4, 6, and 12 weeks. (C) RT-qPCR analysis of the expression of phagocytosis-associated genes in control and Znrf3 cKO male adrenals at 12 weeks. (D) IHC for the phagocytosis receptor MERTK in control and Znrf3 cKO male adrenals at 4, 6, and 12 weeks. Arrowheads show multinucleated macrophages, and stars show mononucleated macrophages. (E and F) Evaluation of phagocytosis by IHC for 3βHSD (steroidogenic cells) and IBA-1 (E) or SF-1 (steroidogenic cells) and MERTK (F). Images were acquired by confocal microscopy, and phagocytic events were counted when steroidogenic markers were found within the boundaries of macrophage markers along the z-stack. Panels show representative zoomed-in images (×120) in 9-week-old (IBA-1) and 12-week-old (MERTK) Znrf3 cKO adrenals. White boxes show phagocytic events on the two-dimensional projection of z-stack and within the orthogonal projections (side images). Bottom graphs represent quantification of phagocytic events on 10 high-power fields (HPFs; ×40) per individual mouse from 4 to 9 weeks (IBA-1+ phagocytosis) and at 12 weeks (MERTKhigh phagocytosis). (G) IHC (MERTK and SF-1) and histological (H&E) analysis of Znrf3 cKO male mice that received control or pexidartinib-enriched chow from 3 to 12 weeks (left). Percentages of MERTK-positive and SF-1–positive cells, relative to total cortical cell numbers (DAPI+), are displayed on the graphs (right). Scale bar, 200 μm. Graphs represent means ± SEM. Statistical analyses in (C) and (E) to (G) were conducted by Mann-Whitney tests. *P < 0.05; **P< 0.01; ***P < 0.001; ****P < 0.0001.
Fig. 4.
Fig. 4.. Recruitment of phagocytic macrophages is delayed in females.
(A) IHC for IBA-1 in female control and Znrf3 cKO adrenals from 4 to 52 weeks. (B) Quantification of the IBA-1 index as the ratio of IBA-1+ cells over total nuclei in the cortex of control and Znrf3 cKO male (blue) and female (pink) mice. (C) GSEA of macrophage gene sets in male Znrf3 cKO compared with female Znrf3 cKO adrenals at 12 weeks. (D) GSEA of the cytokine gene set in Znrf3 cKO males and females compared with their respective control adrenals at 12 weeks. (E) Number of fused macrophages (at least two nuclei) in control and Znrf3 cKO male and female adrenals. (F) IHC for MERTK in control and Znrf3 cKO female adrenals. (G) Quantification of the MERTK+ index as the ratio of MERTK-positive cells over total nuclei in the cortex of control and Znrf3 cKO male (blue) and female (pink) mice. (H) Quantification of phagocytic events following IHC for IBA-1 and 3βHSD (IBA-1+ phagocytosis) or MERTK and SF-1 (MERTKhigh phagocytosis) in control and Znrf3 cKO females. Quantification was performed on 10 HPFs (×40) per individual mouse. (I) GSEA of phagocytosis/efferocytosis gene sets in Znrf3 cKO female adrenals compared with controls. (J) RT-qPCR analysis of the expression of phagocytosis- and macrophage fusion–associated genes in control and Znrf3 cKO female adrenals at 12 weeks. Scale bars, 200 μm. Graphs represent means ± SEM. Statistical analyses were conducted by two-way ANOVA in (B), (E), and (G) and by Mann-Whitney tests in (H) and (J). *P < 0.05; **P < 0.01; ***P < 0.001; ****P < 0.0001.
Fig. 5.
Fig. 5.. Androgens are sufficient to trigger early recruitment of phagocytic macrophages and regression of hyperplasia.
(A) Cartoon of the experimental setup. (B) IHC for MERTK in 12-week-old placebo- and testosterone-treated Znrf3 cKO females. An untreated 12-week-old Znrf3 cKO male was included as a reference. (C) Quantification of the MERTK+ index as the ratio of MERTK+ cells over total nuclei in the cortex of placebo- and testosterone-treated females at 12 weeks. (D) RT-qPCR analysis of the expression of macrophage-related genes in placebo- and testosterone-treated Znrf3 cKO female adrenals at 12 weeks. (E) RT-qPCR analysis of the expression of phagocytosis- and macrophage fusion–associated genes in placebo- and testosterone-treated Znrf3 cKO female adrenals at 12 weeks. (F) Adrenal weights from placebo- and testosterone-treated 12-week-old Znrf3 cKO females. Twelve-week-old untreated control males/females and Znrf3 cKO males/females from Fig. 1 (A and E) were included as a reference. Scale bar, 200 μm. Graphs represent means ± SEM. Statistical analyses in (C) to (E) were conducted by Mann-Whitney tests. In (F), statistical analyses were conducted by two-way ANOVA, followed by a Kruskal-Wallis post hoc test. *P < 0.05; **P < 0.01; ***P< 0.001; ****P < 0.0001.
Fig. 6.
Fig. 6.. Recruitment of phagocytic macrophages in male Znrf3 cKO mice is associated with sexually dimorphic induction of senescence.
(A) GSEA of senescence-associated gene sets in Znrf3 cKO male and female adrenals compared with their respective controls. (B) Quantification of the p21+ index as the ratio of p21-positive cells over total nuclei in the cortex of male and female control and Znrf3 cKO mice from 4 to 12 weeks. (C) Detection of the SA-βGal activity on frozen tissue sections from male and female control and ZKO at 4, 6, and 12 weeks. (D) Expression of SASP genes in 12-week-old male and female control and Znrf3 cKO adrenals. Genes were selected on the basis of significant deregulation in 12-week-old male Znrf3 cKO adrenals (FDR < 0.1) and sorted by log2 fold change (log2FC). (E) RT-qPCR analysis of SASP gene expression in control and Znrf3 cKO males (top) and females (bottom). (F) Detection of SA-βGal activity in the adrenals of Znrf3 cKO females that received placebo or testosterone treatment from 4 to 5 weeks. An untreated 6-week-old Znrf3 cKO male was included as a reference. (G) RT-qPCR analysis of SASP gene expression in placebo- and testosterone-treated Znrf3 cKO females from Fig. 5. (H) IHC for GFP (marking SF-1:Cre–mediated recombination of mTmG in steroidogenic cells), F4/80, and SA-βGal activity. Right panels show a high-magnification crop of the area delineated in white in left panels. Blue arrowheads show senescent GFP+ cells; brown arrowheads show F4/80+ macrophages. Scale bars, 200 μm (C to F) and 100 μm (H). Graphs represent means ± SEM. Statistical analyses were conducted by two-way ANOVA in (B) and by Mann-Whitney tests in (E). *P < 0.05; **P < 0.01; ***P < 0.001; ****P < 0.0001.
Fig. 7.
Fig. 7.. Aggressive tumorigenesis is associated with infiltration of nonphagocytic macrophages in female adrenals.
(A) IHC for IBA-1 and MERTK in control and Znrf3 cKO males/females at 78 weeks. For Znrf3 cKO females, the panels represent indolent tumors (no metastases) and aggressive tumors with or without macrophage infiltration. (B) Quantification of the IBA-1+ and MERTK+ index as the ratio of IBA-1–positive (left) or MERTK-positive (right) cells over total nuclei in the cortex of male and female control and Znrf3 cKO mice at 78 weeks. Values for primary tumors associated with metastases are shown as black dots. (C) RT-qPCR analysis of the expression of macrophage-related genes in control and Znrf3 cKO males (top) and control and Znrf3 cKO females (bottom) at 78 weeks. (D) RT-qPCR analysis of the expression of phagocytosis- and macrophage fusion–associated genes in control and Znrf3 cKO males (top) and control and Znrf3 cKO females (bottom) at 78 weeks. (E) GSEA of gene expression data (RNA sequencing) from 78-week-old control and Znrf3 cKO male and female adrenals. The plot represents enrichment of phagocytosis-associated gene sets and DNA replication–associated gene sets in Znrf3 cKO compared with controls (sex-matched). Scale bars, 200 μm. Graphs represent means ± SEM. Statistical analyses were conducted by two-way ANOVA in (B) and Mann-Whitney tests in (E). *P < 0.05; **P < 0.01.
Fig. 8.
Fig. 8.. Phagocytic macrophage signatures are prominent in male ACC patients and associated with better prognosis.
(A) Expression of a global macrophage gene signature in ACC patients from the TCGA program, dichotomized as patients with good (C1B) and poor (C1A) prognosis. (B) Expression of a global macrophage gene signature in ACC patients from the TCGA program, dichotomized as men and women. (C) Expression of a phagocytic macrophage gene signature in ACC patients from the TCGA program, dichotomized as men and women. (D) Expression of a phagocytic macrophage gene signature in ACC patients from the TCGA program, dichotomized as patients with good (C1B) and poor (C1A) prognosis. (E) Survival analysis of patients of the TCGA program, dichotomized as patients with high (purple) or low (green) expression of the phagocytic signature. (F) Volcano plot displaying differential gene expression between patients with high and low expression of the phagocytic signature. Purple dots represent genes with log2 fold change > 2 and FDR < 0.01. Green dots represent genes with log2 fold change ≤ 2 and FDR < 0.01. (G) GSEA of phagocytosis, senescence, and NFκB-associated gene sets in patients with high expression of the phagocytic signature compared with patients with low expression of the signature. (H) Stacked bar plots representing immune cell populations deconvoluted using CIBERSORTx and the LM22 expression matrix from gene expression data in ACC patients with low and high phagocytic signatures. Statistical analyses in (A) to (D) were conducted by Mann-Whitney tests. *P < 0.05; **P < 0.01; ****P < 0.0001.
Fig. 9.
Fig. 9.. Graphical abstract.
Inactivation of Znrf3 in steroidogenic cells of the mouse adrenal cortex is associated with sexually dimorphic tumor progression. Although female KOs develop metastatic carcinomas at 18 months, adrenal hyperplasia regresses in male KOs. This male-specific phenotype is associated with androgen-dependent induction of senescence, recruitment, and differentiation of highly phagocytic macrophages that clear out senescent cells. In contrast, in females, macrophage recruitment is delayed and dampened, which allows for aggressive tumor progression. Analysis of TCGA-ACC data shows that phagocytic macrophages are more prominent in men and associated with better prognosis. Together, these data show that phagocytic macrophages are key players in the sexual dimorphism of ACC and establish them as previously unidentified allies in the fight against this cancer.

References

    1. Dart A., Sexual dimorphism in cancer. Nat. Rev. Cancer 20, 627 (2020). - PubMed
    1. Clocchiatti A., Cora E., Zhang Y., Dotto G. P., Sexual dimorphism in cancer. Nat. Rev. Cancer 16, 330–339 (2016). - PubMed
    1. Shobab L., Burman K. D., Wartofsky L., Sex differences in differentiated thyroid cancer. Thyroid 32, 224–235 (2022). - PubMed
    1. Audenet F., Méjean A., Chartier-Kastler E., Rouprêt M., Adrenal tumours are more predominant in females regardless of their histological subtype: A review. World J. Urol. 31, 1037–1043 (2013). - PubMed
    1. Else T., Kim A. C., Sabolch A., Raymond V. M., Kandathil A., Caoili E. M., Jolly S., Miller B. S., Giordano T. J., Hammer G. D., Adrenocortical carcinoma. Endocr. Rev. 35, 282–326 (2014). - PMC - PubMed