. 2022 Oct 21;7(76):eabo3420.
doi: 10.1126/sciimmunol.abo3420. Epub 2022 Oct 14.

Depletion of exhausted alloreactive T cells enables targeting of stem-like memory T cells to generate tumor-specific immunity

Affiliations

Depletion of exhausted alloreactive T cells enables targeting of stem-like memory T cells to generate tumor-specific immunity

Simone A Minnie et al. Sci Immunol. .

Abstract

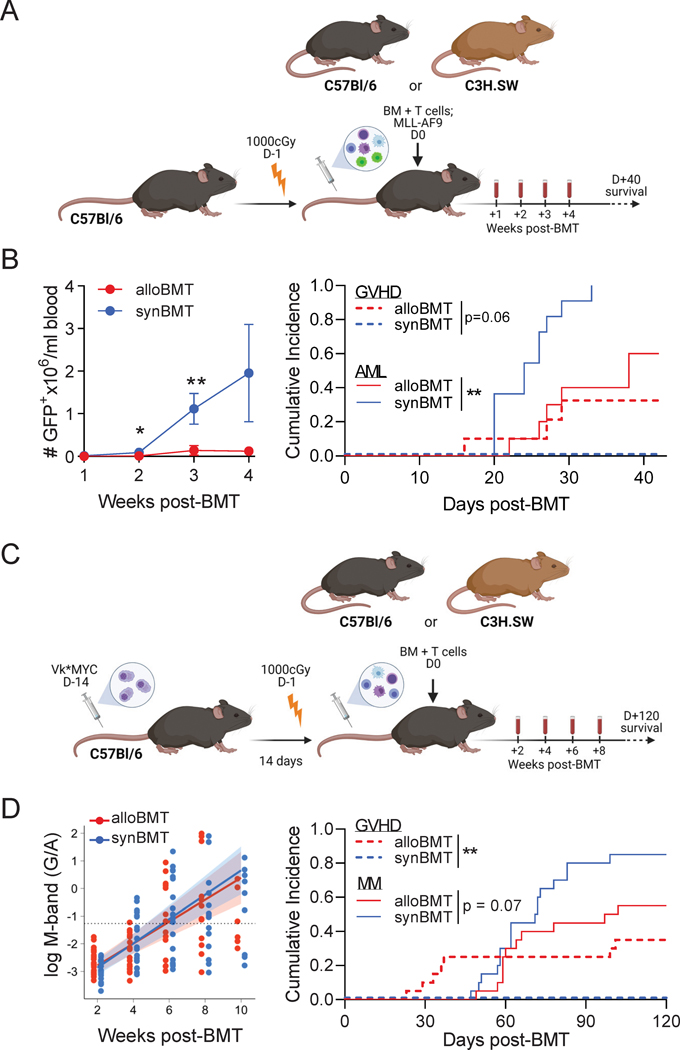
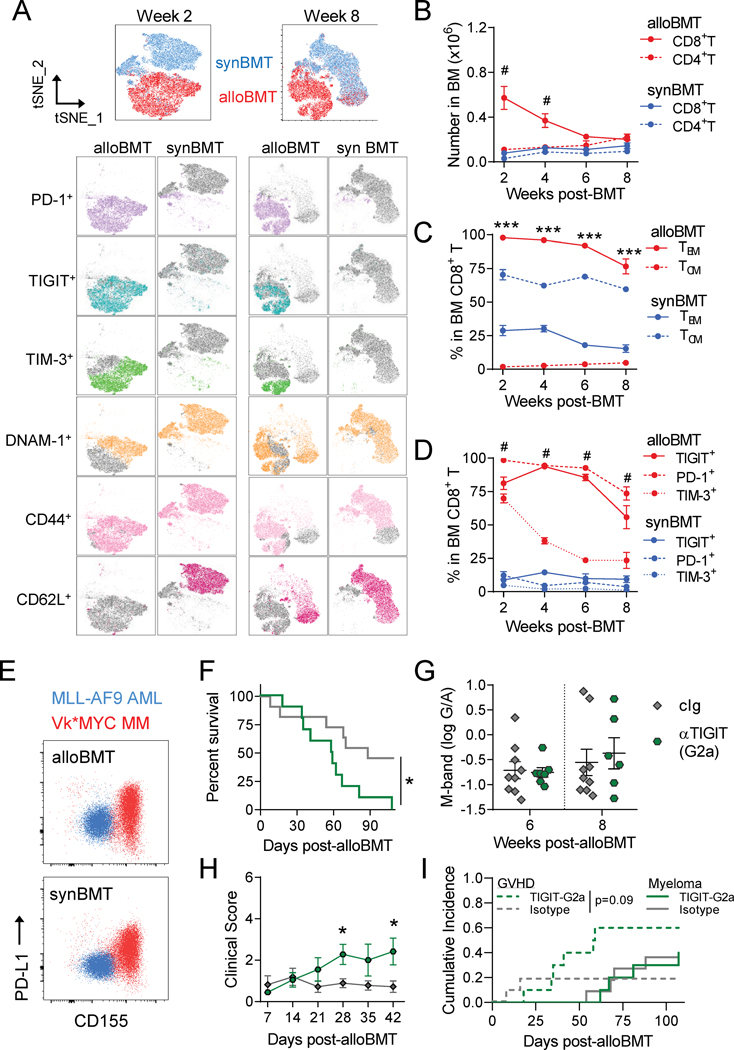
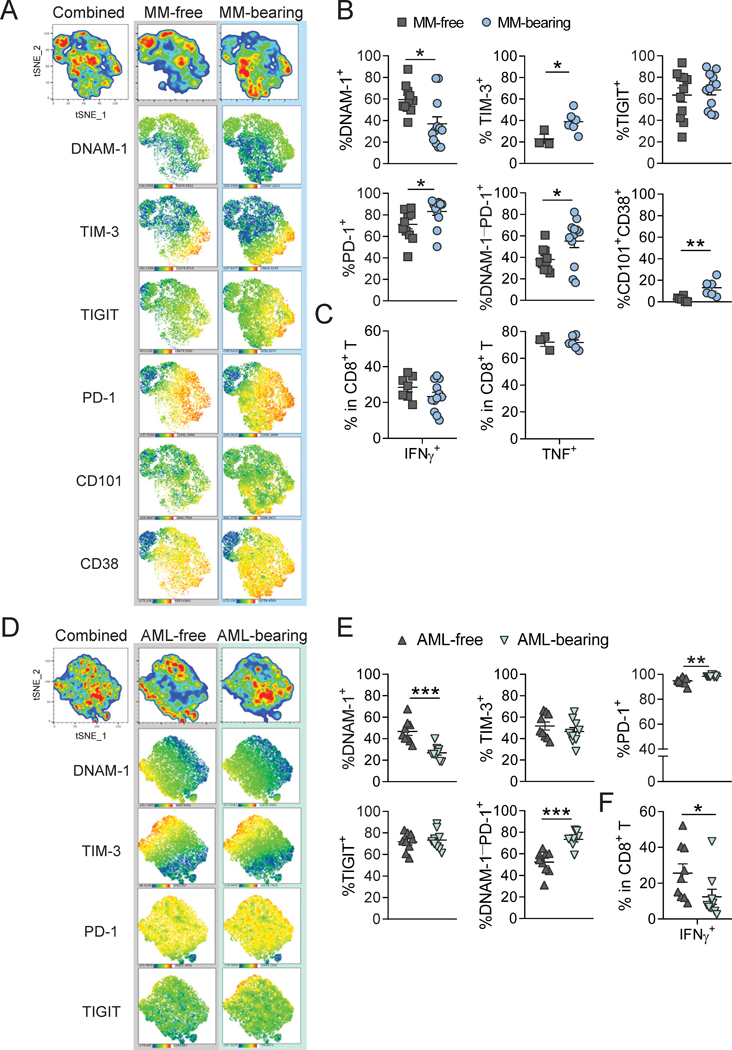
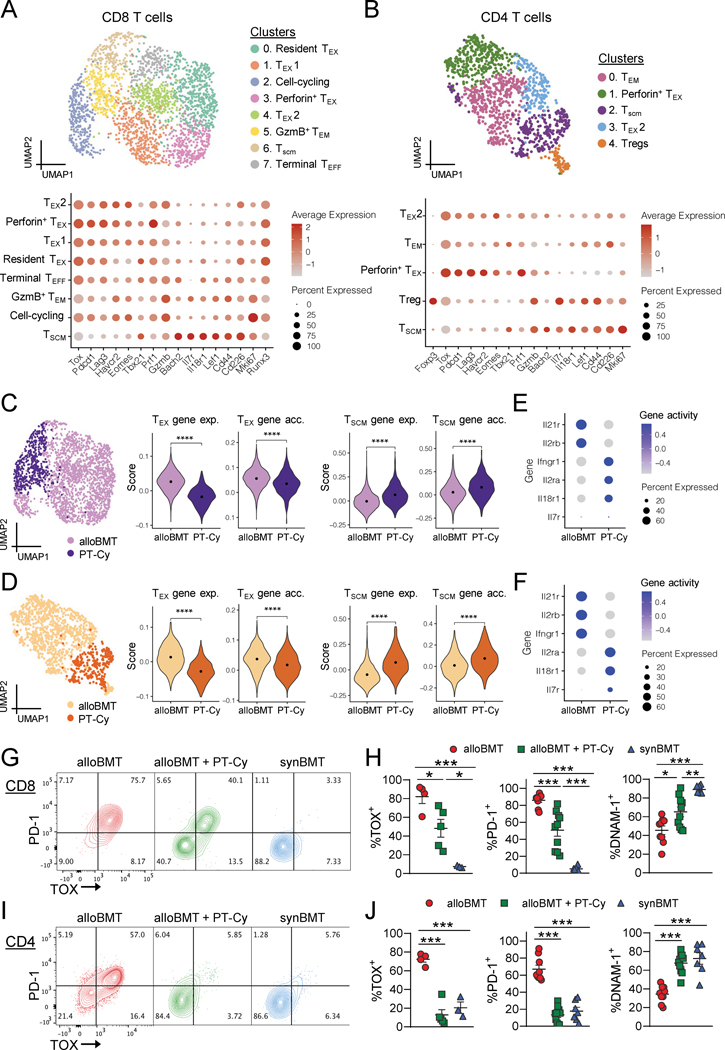
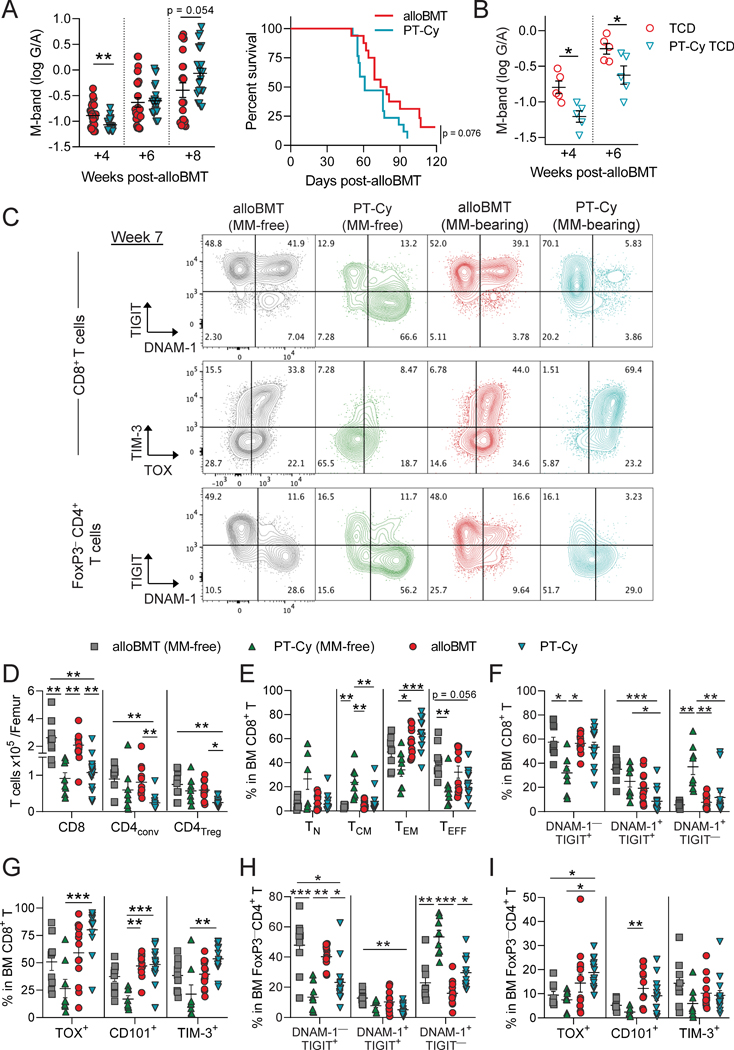
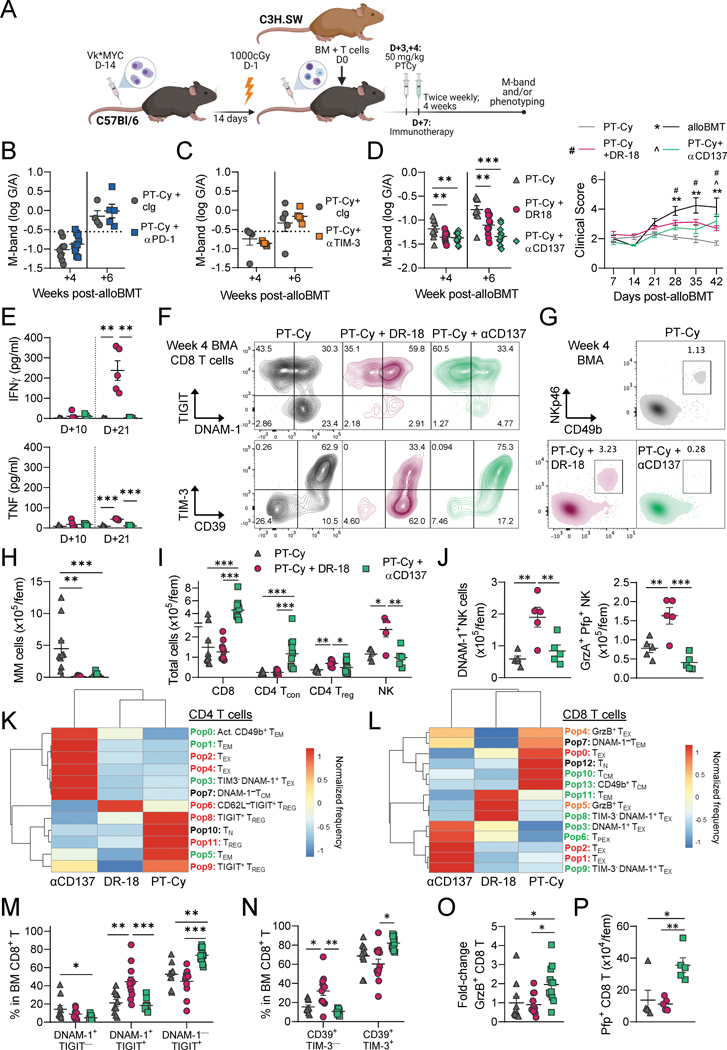
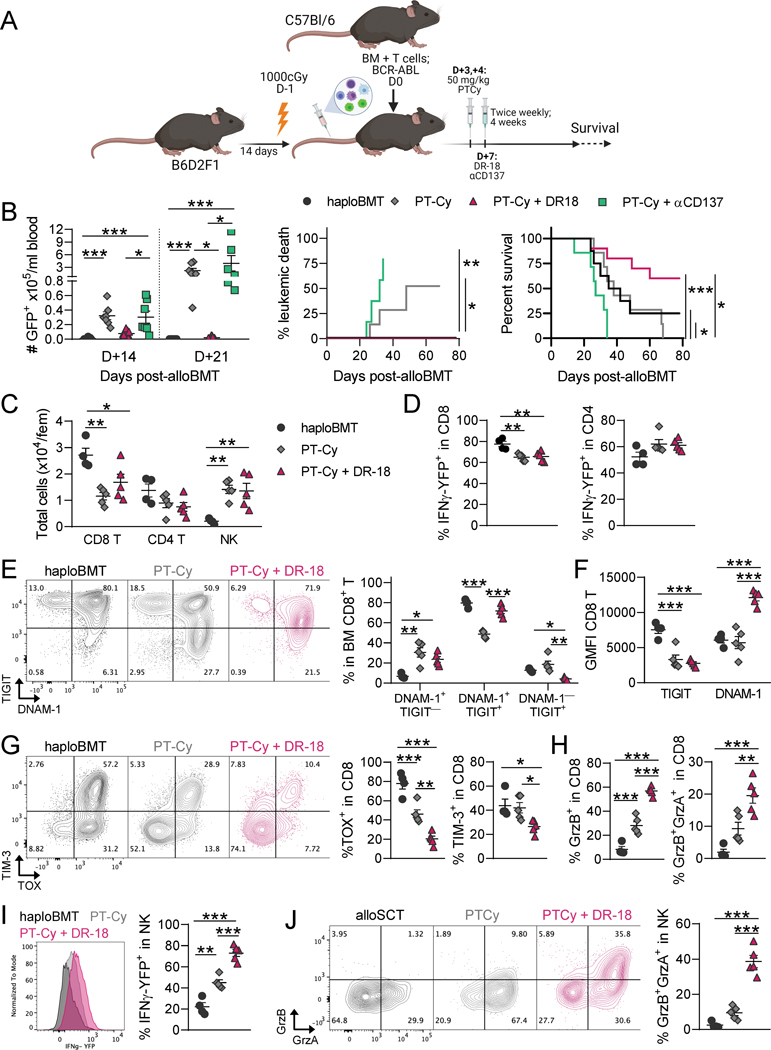
Some hematological malignancies such as multiple myeloma are inherently resistant to immune-mediated antitumor responses, the cause of which remains unknown. Allogeneic bone marrow transplantation (alloBMT) is the only curative immunotherapy for hematological malignancies due to profound graft-versus-tumor (GVT) effects, but relapse remains the major cause of death. We developed murine models of alloBMT where the hematological malignancy is either sensitive [acute myeloid leukemia (AML)] or resistant (myeloma) to GVT effects. We found that CD8+ T cell exhaustion in bone marrow was primarily alloantigen-driven, with expression of inhibitory ligands present on myeloma but not AML. Because of this tumor-independent exhaustion signature, immune checkpoint inhibition (ICI) in myeloma exacerbated graft-versus-host disease (GVHD) without promoting GVT effects. Administration of post-transplant cyclophosphamide (PT-Cy) depleted donor T cells with an exhausted phenotype and spared T cells displaying a stem-like memory phenotype with chromatin accessibility present in cytokine signaling genes, including the interleukin-18 (IL-18) receptor. Whereas ICI with anti-PD-1 or anti-TIM-3 remained ineffective after PT-Cy, administration of a decoy-resistant IL-18 (DR-18) strongly enhanced GVT effects in both myeloma and leukemia models, without exacerbation of GVHD. We thus defined mechanisms of resistance to T cell-mediated antitumor effects after alloBMT and described an immunotherapy approach targeting stem-like memory T cells to enhance antitumor immunity.


Conflict of interest statement

Competing interests: All other authors declare that they have no competing interests.

Figures

Figure 1:
Figure 1:. Graft-versus-tumor effects were subverted after alloBMT in myeloma-bearing but not leukemia-bearing recipients.
C57Bl/6 (B6) recipients injected with Vk*MYC myeloma (MM-bearing; D-14) or MLL-AF9 (AML-bearing; D0) were lethally irradiated and transplanted with 5 × 10⁶ BM with 0.5 × 10⁶ CD4+ + 0.5 × 10⁶ CD8+ T cells from B6 (synBMT) or C3H.SW (alloBMT) donors. (A) Experimental schematic. (B) AML-bearing recipients were bled weekly to quantify the total number of circulating GFP+ AML cells and competing risk analysis was performed to determine risk of death due to acute myeloid leukemia (AML) or GVHD. n = 11/group from 2 experiments. Mann-Whitney U test for AML burden. (C) Experimental schematic. (D) MM-bearing recipients were monitored for tumor burden using M-band (G/A). M-bands were modeled to calculate a predictive rate of tumor growth (solid line), with shaded confidence intervals and M-band relapse threshold shown as dotted line. Competing risk analysis was performed to determine risk of death due to myeloma (MM) or graft-versus-host disease (GVHD). n = 20/group from 3 experiments. * p<0.05, ** p<0.01.
Figure 2:
Figure 2:. Alloantigen-driven inhibitory receptor expression corresponded with ligand expression on myeloma and blockade exacerbated GVHD.
B6 recipients were transplanted with 5 × 10⁶ BM with 0.5 × 10⁶ CD4+ + 0.5 × 10⁶ CD8+ T cells from B6 (synBMT) or C3H.SW (alloBMT) donors. (A-D) BM was harvested, and T cells were phenotyped at 2, 4, 6, and 8 weeks post-transplant (n = 3–8 from 1–2 experiments). # p<0.05 when alloBMT and synBMT were compared using two-way ANOVA with Tukey’s multiple comparisons test. (A) t-SNE analysis identified CD8+ T cell clusters based on PD-1, TIGIT, TIM-3, DNAM-1, CD44 and CD62L expression at 2 weeks and 8 weeks post-transplant (n = 3–5). (B) CD4+ and CD8+ T cell number. (C) Frequency of effector CD8+ T cells (CD44+CD62L, TEM) and central memory T cells (CD44+CD62L+, TCM). (D) Frequency of TIGIT+, PD-1+, TIM3+ CD8+ T cells. (E) FACS plots of PD-L1 and CD155 expression on Vk12653 (red) and MLL-AF9 (blue). (F- I) Recipients were treated with 100 μg/mouse of anti-TIGIT (clone G2a; αTIGIT-G2a) or mIgG2a isotype control (cIg) twice a week from 2 weeks to 6 weeks post-transplant. (F) Median overall survival analyzed with Log-rank test, (G) M-band (log gamma/albumin) at 6 and 8 weeks after alloBMT, (H) clinical score and (I) competing risk analysis. (n = 10/group from 2 experiments). Data represent mean ± SEM. Two-way ANOVA with Tukey’s multiple comparisons test. *p<0.05, ***p<0.001.
Figure 3:
Figure 3:. CD8+ T cell exhaustion was primarily driven by alloantigen and not tumor antigen after alloBMT.
B6 recipients were transplanted with 5 × 10⁶ BM with 0.5 × 10⁶ CD4+ + 0.5 × 10⁶ CD8+ T cells from C3H.SW (alloBMT) donors. (A-C) Myeloma-bearing (MM-bearing) or naïve (MM-free) recipients were sacrificed at 8 weeks post-transplant and BM was harvested to assess CD8+ T cell phenotype. (A) representative t-SNE analysis of PD-1, TIGIT, TIM-3, DNAM-1, CD101 and CD38 expression and (B) frequency of DNAM-1+, TIM-3+, TIGIT+, PD-1+, DNAM-1PD-1+ and CD101+CD38+ cells within CD8+ T cells. (C) Frequency of IFNγ and TNF-expressing cells within CD8+ T cells after PMA/ionomycin re-stimulation. (n = 11–12/group from 2 experiments; TNF and TIM-3 n = 3–6/group from 1 experiment). (D-F) MLL-AF9-bearing (AML-bearing) or naïve (AML-free) mice were sacrificed 4 weeks post-transplant and BM was harvested to assess CD8+ T cell phenotype. (D) t-SNE analysis of PD-1, TIGIT, TIM-3 and DNAM-1 expression and (E) frequency of DNAM-1+, TIM-3+, PD-1+, TIGIT+ and DNAM-1PD-1+ cells within CD8+ T cells. (F) Frequency of IFNγ-expressing cells within CD8+ T cells after PMA/ionomycin re-stimulation. (n = 9/group from 2 experiments). Data represent mean ± SEM. Mann-Whitney U test or Student’s t-test were used for numerical values. * p<0.05, ** p<0.01, *** p<0.001.
Figure 4:
Figure 4:. PT-Cy reduced alloreactive T cell exhaustion and enhanced stemness in bone marrow
B6 recipients were transplanted with 5 × 10⁶ BM with 0.5 × 10⁶ CD4+ + 0.5 × 10⁶ CD8+ T cells from C3H.SW donors (alloBMT) or B6 donors (synBMT). Some alloBMT recipients were treated with 50 mg/kg cyclophosphamide on D+3 and D+4 after transplantation (alloBMT + PTCy). Mice were sacrificed 14 days after transplant and BM was harvested and pooled from 4 mice per group. (A-F) CD8+ and CD4+ T cells were sort purified from BM of alloBMT and alloBMT + PT-Cy recipients and nuclei were processed for 10x genomics multiome sequencing. (A) WNN embedding of combined ATAC and RNA data of CD8+ cells colored by cluster (top) than annotated using CD8+ T cell specific markers (bottom). (B) CD4+ T cells clustered and annotated in a manner analogous to (A). (C) Embedding in (A) colored by experimental group (left). Centered and scaled cumulative gene expression (abbrev. ‘exp’) and gene accessibility (abbrev. ‘acc’, using gene activity score) of TEX and TSCM genes in CD8+ T cells by experimental group (right). Wilcoxon Rank Sum test. (D) Embedding in (B) colored by experimental group (left). Centered and scaled cumulative gene expression (abbrev. ‘exp’) and gene accessibility of TEX and TSCM genes in CD4+ T cells by experimental group (right). Wilcoxon Rank Sum test. (E-F) Gene accessibility scores of key cytokine receptor genes by experiment group in (E) CD8+ T cells and (F) CD4+ T cells. (G-J) Representative flow cytometry plots of PD-1 versus TOX expression in CD8+ and CD4+ conventional (FoxP3) T cells. (H) Frequency of TOX+, PD-1+ and DNAM-1+ within CD8+ T cells (J) and CD4+ conventional T cells. (n = 7–10 /group from 2 experiments, TOX n = 3 – 5 /group from 1 experiment). Data represent mean ± SEM. One-way ANOVA with Tukey’s multiple comparisons test. * p<0.05, ** p<0.01, ***p<0.001, ****p<0.0001.
Figure 5:
Figure 5:. PT-Cy enabled the generation of myeloma-driven CD8+ T cell exhaustion.
B6 MM-bearing recipients were transplanted with 5 × 10⁶ BM with 0.5 × 10⁶ CD8+ and 0.5 × 10⁶ CD4+ T cells from C3H.SW donors. (A) MM-bearing recipients of T cell replete grafts were untreated (alloBMT) or administered 50 mg/kg cyclophosphamide on D+3 and D+4 (PT-Cy) and monitored for myeloma burden using M-band (log G/A; n = 24 from 4 experiments; Mann-Whitney U test) and survival (n = 17 from 3 experiments; Log-rank test). (B) MM-bearing recipients of T cell deplete BM grafts (TCD) were treated as above and monitored for M-band (n = 5 from 1 experiment; Student’s t-test). (C-I) MM-bearing and MM-naive recipients were treated as above and BM was harvested at 7 weeks post-transplant for immunophenotyping using flow cytometry (n = 8 – 14 from 2 experiments). (C) Representative contour plots. (D) CD8+, conventional CD4+ (FoxP3), and regulatory CD4+ T cell enumeration per femur. (E) Frequency of naïve T (TN; CD44CD62L), central memory T (TCM; CD44+CD62L+), effector memory T (TEM; CD44+CD62L), and effector T (TEFF; CD44CD62L), (F) DNAM-1 and TIGIT expressing cells, and (G) TOX+, CD101+ and TIM-3+ cells within CD8+ T cells. (H) Frequency of DNAM-1 and TIGIT expressing cells and (I) TOX+, CD101+ and TIM-3+ cells within conventional CD4+ T cells. Data represent mean ± SEM. One-way ANOVA with Tukey’s multiple comparisons test or Kruskal-Wallis test with Dunn’s multiple comparisons test. * p < 0.05 ** p < 0.01 *** p <0.001
Figure 6:
Figure 6:. Agonist immunotherapy promoted GVM after PT-Cy.
B6 MM-bearing recipients were transplanted with 5 × 10⁶ BM and 1 × 10⁶ CD8+ and 1 × 10⁶ CD4+ T cells from C3H.SW donors. Recipients were administered 50 mg/kg cyclophosphamide on D+3 and D+4 and then either a vehicle control or immunotherapy from D+7 for 4 weeks. (A) Experimental design. (B) M-band of recipients treated with rIgG2a (PT-Cy) or anti-PD-1 (PT-Cy + αPD-1). n = 10 from 2 experiments at 4 weeks; n = 5 from 1 experiment at 6 weeks. (C) M-band of recipients treated with rIgG2a (PT-Cy) or anti-TIM-3 (PT-Cy + αTIM-3). n = 5 from 1 experiment. (D-P) MM-bearing recipients were treated with PBS (PT-Cy), or 8 μg/dose DR-18 (PT-Cy + D-18), or 100 μg/dose anti-CD137 (PT-Cy + αCD137). Bone marrow aspirates (BMA) were performed at 4 weeks post-transplant from one femur. Mice were then sacrificed at 6 weeks post-alloBMT and BM from both femurs was harvested. n = 10–12 from 2 experiments unless otherwise stated. (D) M-band at 4 and 6 weeks post-alloBMT and GVHD clinical (including alloBMT mice not treated with PTCy; n = 5 from 1 experiment). (E) IFNγ and TNF (pg/ml) in serum at D+10 and D+21 after alloBMT (n = 5 from 1 experiment). (F) Concatenated contour plots of TIGIT versus DNAM-1, and TIM-3 versus CD39 expression on CD8+ T cells from BMA (representative of 2 experiments). (G) Concatenated density plots of NK cell frequency (Nkp46+ CD49b+) within white blood cells from BMA. (H) Myeloma and (I) T and NK cell total numbers per femur at week 6. (J) Number of DNAM-1+ and granzyme A+ perforin+ (GrzA+Pfp+) NK cells (n = 5/group from 1 experiment). (K-L) FlowSOM clustering was performed on concatenated (K) CD4+ and (L) CD8+ T cells at week 6 post-transplant. Heatmaps depict relative frequencies of populations across treatment groups. Populations are colored based on expected anti-tumor properties. Green = activated effector or memory populations, orange = cytolytic, red = exhausted/suppressive and black = unknown. (M) Frequency of DNAM-1 and TIGIT and (N) CD39 and TIM-3 expressing cells within CD8+ T cells at week 6. (O) Fold change in granzyme B (GrzB+) expression on CD8+ T cells and (P) total number of perforin-expressing (Pfp+; n = 5/group from 1 experiment) CD8+ T cells at week 6 post-transplant. Data represent mean ± SEM. One-way ANOVA with Tukey’s multiple comparisons test or Kruskal-Wallis test with Dunn’s multiple comparisons test. * p < 0.05 ** p < 0.01 *** p <0.001.
Figure 7:
Figure 7:. DR-18 promotes GVL after haploidentical transplantation.
B6D2F1 recipients were lethally irradiated and transplanted with 5 × 10⁶ BM and 2 × 10⁶ T cells from HULK (IFNγ-YFP x IL-10-GFP x FoxP3-RFP) donors and 1 × 10⁶ BCR-ABL-NUP98hox9 leukemia cells. Recipients were untreated (haploBMT) or administered 50 mg/kg PT-Cy on D+3 and D+4 (PT-Cy) with or without decoy resistant IL-18 (PT-Cy + DR-18; 8μg twice weekly from D+7 to week 5) or CD137 agonist antibody (PT-Cy + αCD137; 100 μg twice weekly from D+7 to week 5). (A) Experimental design. (B) Number of GFP+ leukemia cells in blood, leukemic death and overall median survival. (C-J) Mice with <5% leukemia cells in BM were sacrificed at 21 days after transplantation and BM was analyzed (n = 4–5; 1 experiment). (C) Total numbers of CD8+ T, CD4+ T, and NK cells. (D) Percentage of IFNγ-producing CD8+ and CD4+ T cells. (E) Co-expression of DNAM-1 and TIGIT and (F) MFI on CD8+ T cells. (G) Expression of TIM-3 and TOX on CD8+ T cells. (H) Granzyme A and B expression in CD8+ T cells. (I) IFNγ and (J) granzyme A and B production in NK cells. One-way ANOVA with Tukey’s multiple comparisons test and Log-rank for survival. Data is mean ± SEM * p<0.05, **p<0.01, ***p<0.001

References

    1. Blank CU, Haining WN, Held W, Hogan PG, Kallies A, Lugli E, Lynn RC, Philip M, Rao A, Restifo NP, Schietinger A, Schumacher TN, Schwartzberg PL, Sharpe AH, Speiser DE, Wherry EJ, Youngblood BA, Zehn D, Defining ‘T cell exhaustion’. Nature Reviews Immunology, (2019). - PMC - PubMed
    1. Chung DJ, Pronschinske KB, Shyer JA, Sharma S, Leung S, Curran SA, Lesokhin AM, Devlin SM, Giralt SA, Young JW, T-cell Exhaustion in Multiple Myeloma Relapse after Autotransplant: Optimal Timing of Immunotherapy. Cancer Immunol Res 4, 61–71 (2016). - PMC - PubMed
    1. Minnie SA, Kuns RD, Gartlan KH, Zhang P, Wilkinson AN, Samson L, Guillerey C, Engwerda C, MacDonald KPA, Smyth MJ, Markey KA, Vuckovic S, Hill GR, Myeloma escape after stem cell transplantation is a consequence of T-cell exhaustion and is prevented by TIGIT blockade. Blood 132, 1675–1688 (2018). - PubMed
    1. Zelle-Rieser C, Thangavadivel S, Biedermann R, Brunner A, Stoitzner P, Willenbacher E, Greil R, Johrer K, T cells in multiple myeloma display features of exhaustion and senescence at the tumor site. J Hematol Oncol 9, 116 (2016). - PMC - PubMed
    1. Haslam A, Prasad V, Estimation of the Percentage of US Patients With Cancer Who Are Eligible for and Respond to Checkpoint Inhibitor Immunotherapy Drugs. JAMA network open 2, e192535 (2019). - PMC - PubMed

Publication types