. 2022 Oct 13;185(21):3931-3949.e26.
doi: 10.1016/j.cell.2022.09.025.

GPC3-Unc5 receptor complex structure and role in cell migration

Affiliations

GPC3-Unc5 receptor complex structure and role in cell migration

Onno Akkermans et al. Cell. .

Abstract

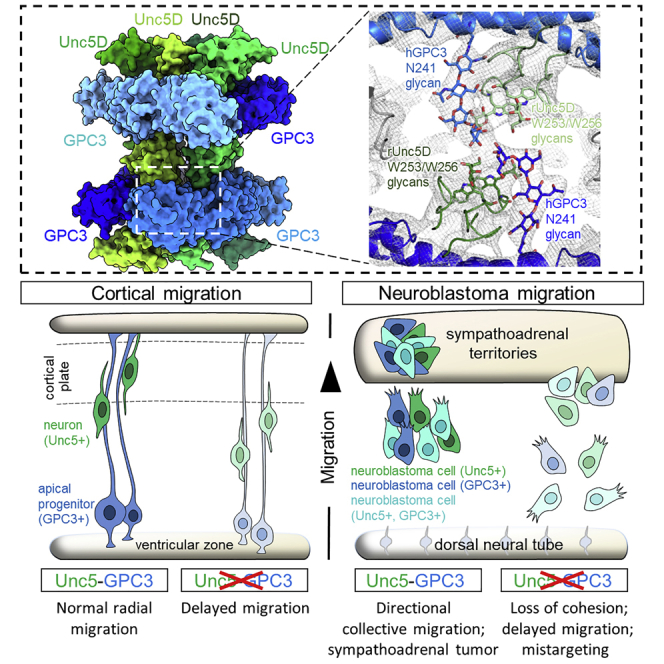
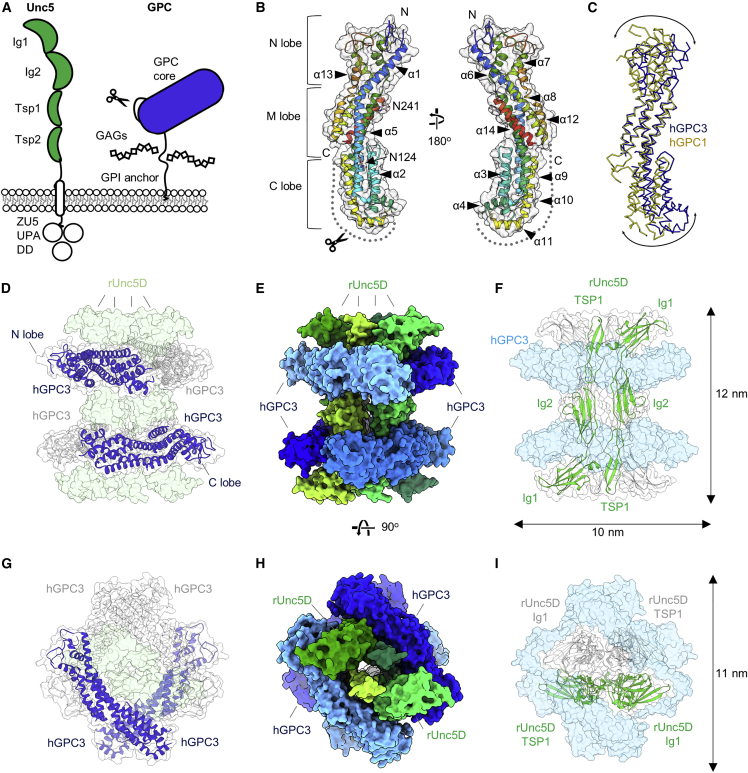
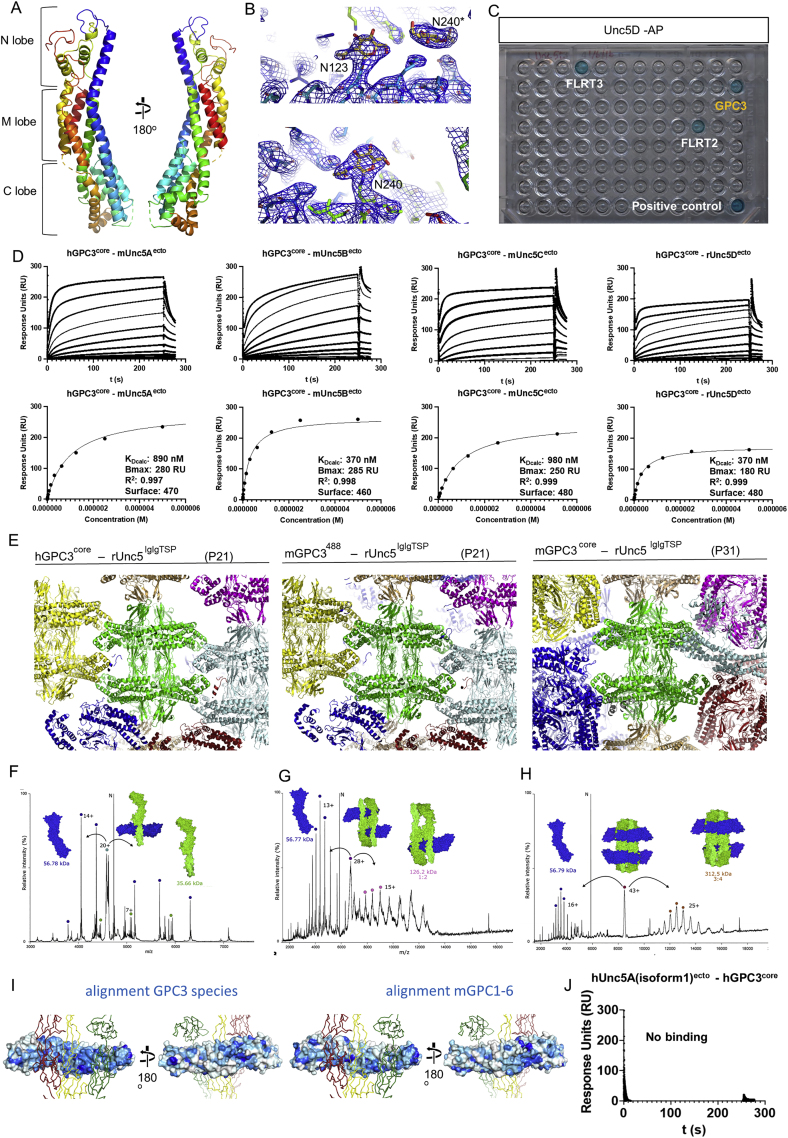
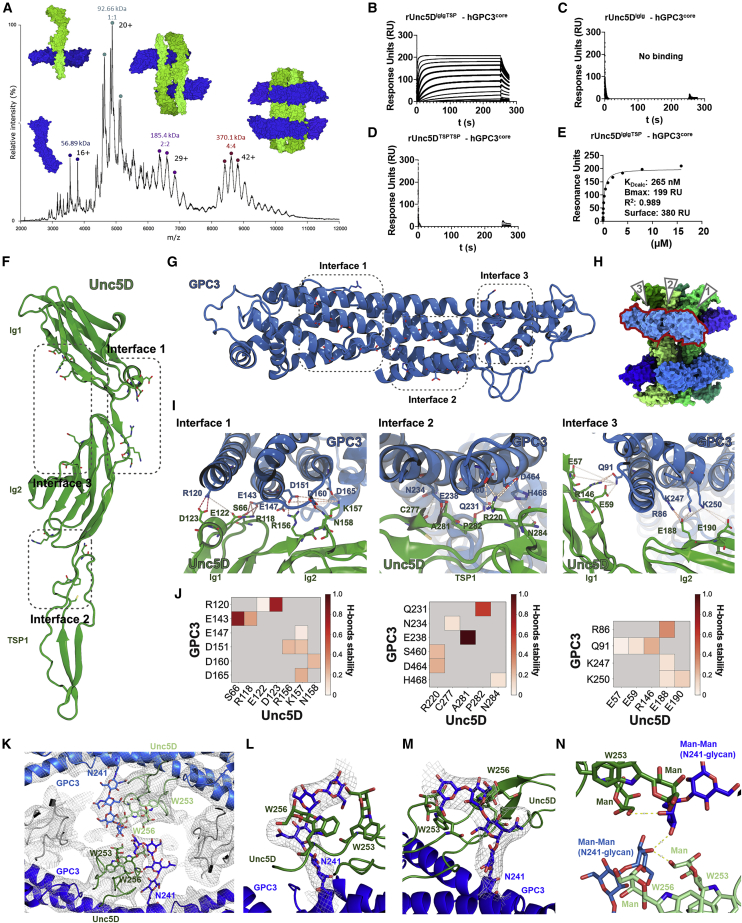
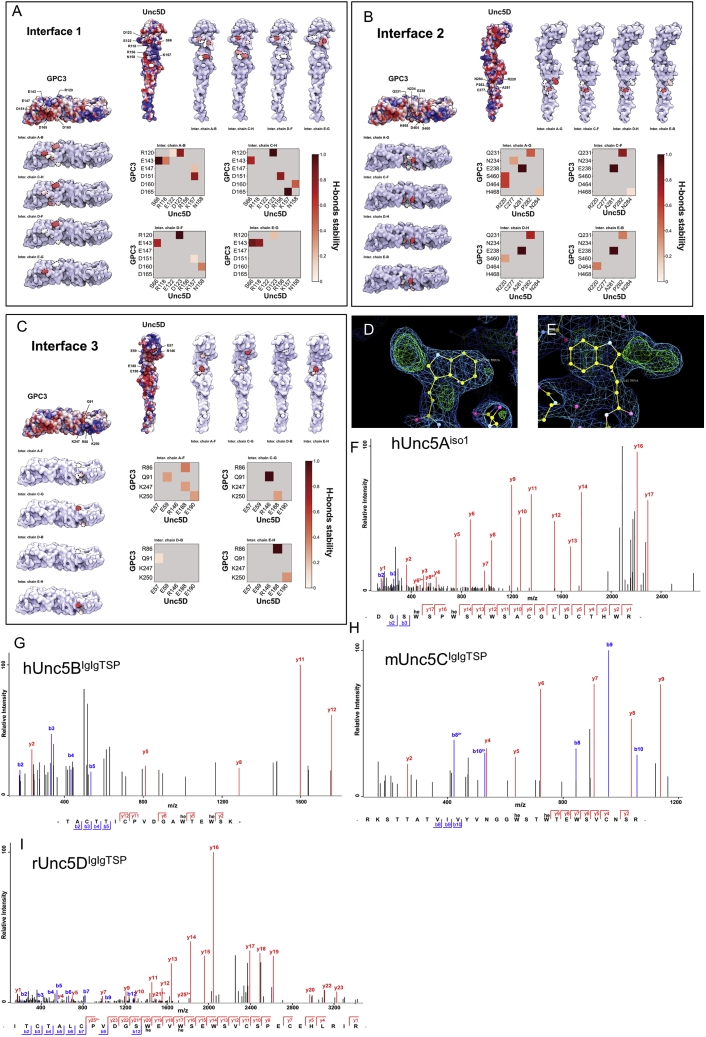
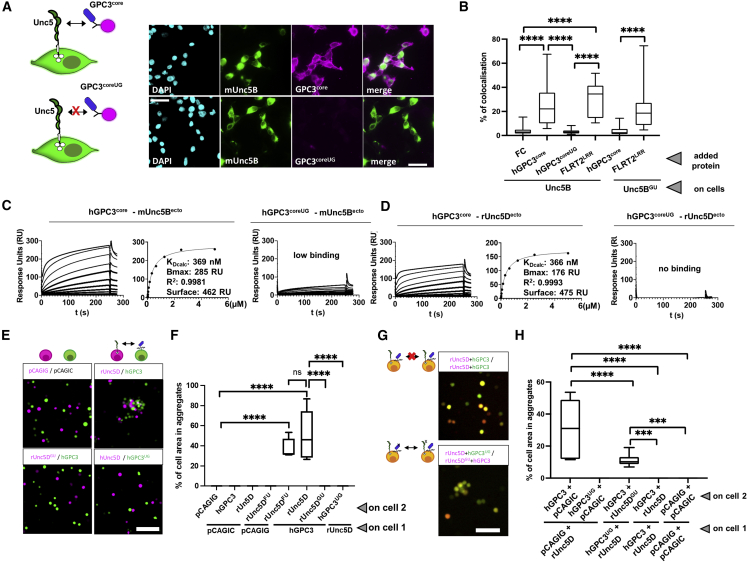
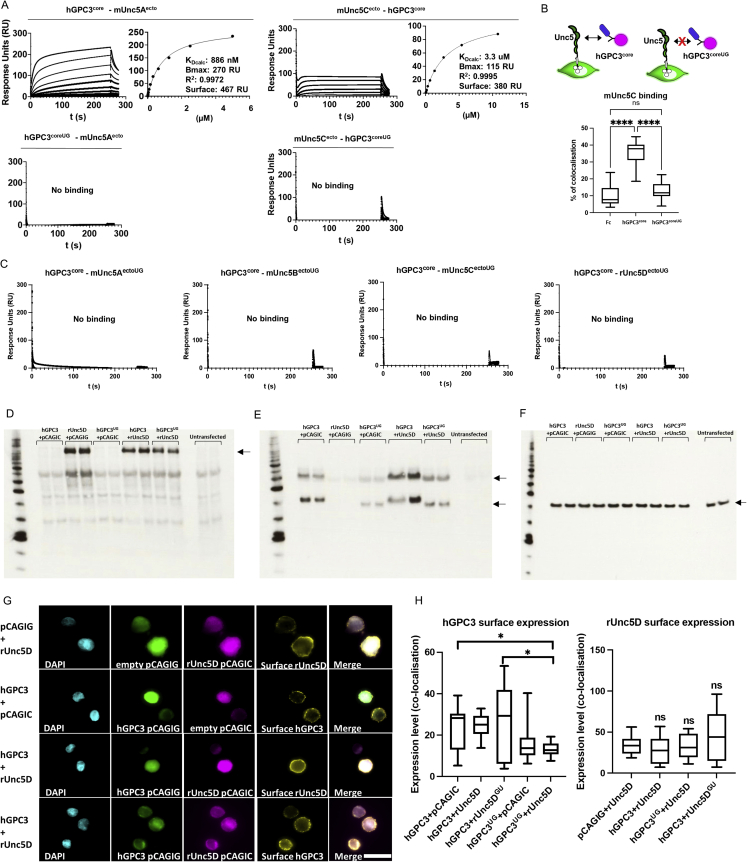
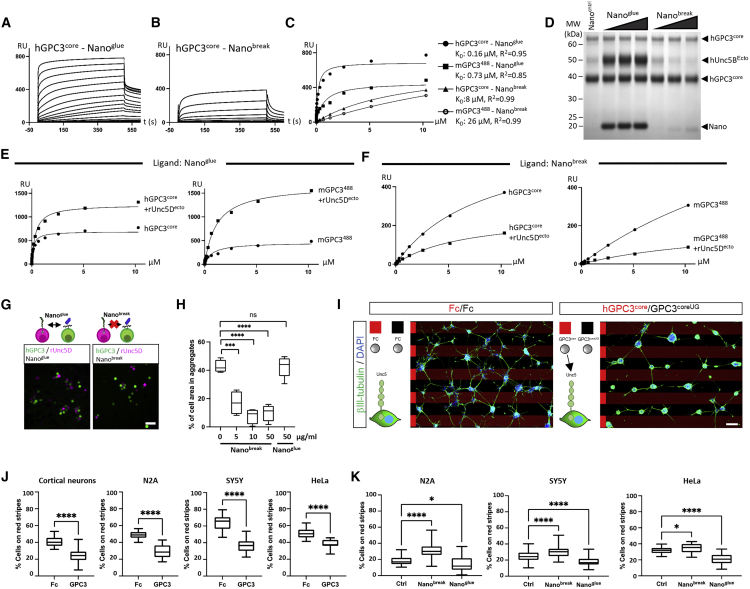
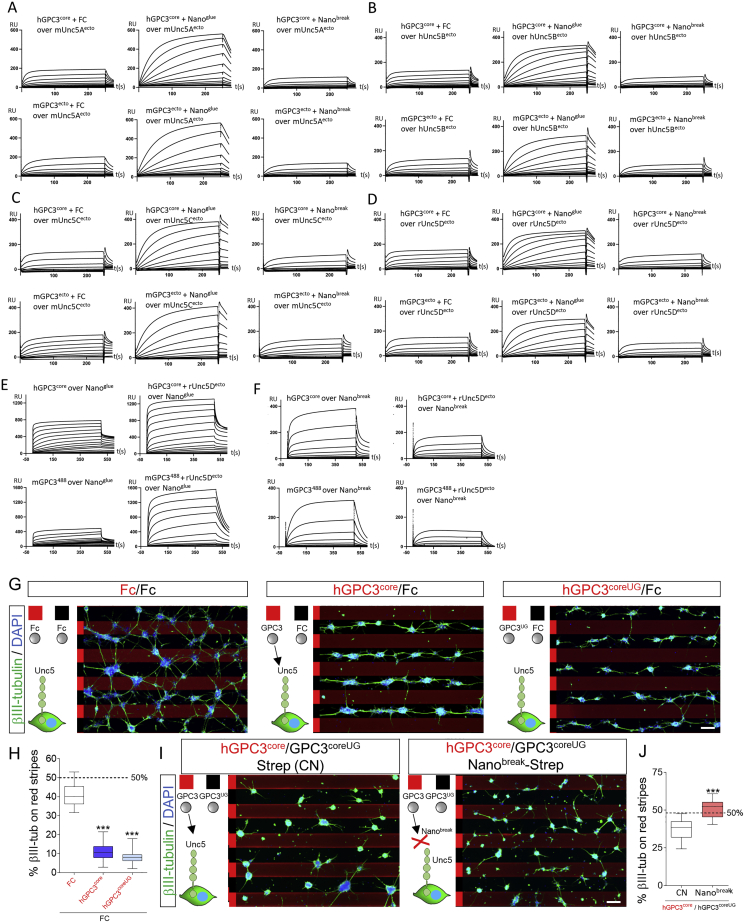
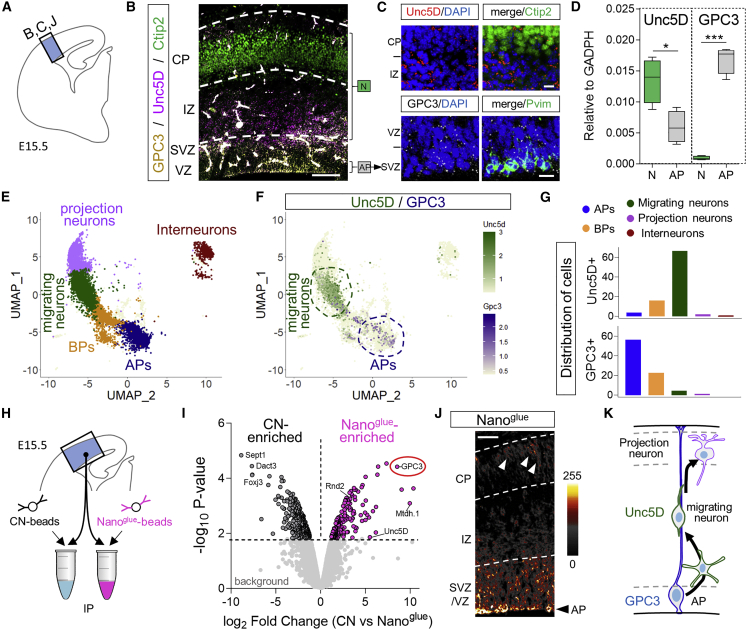
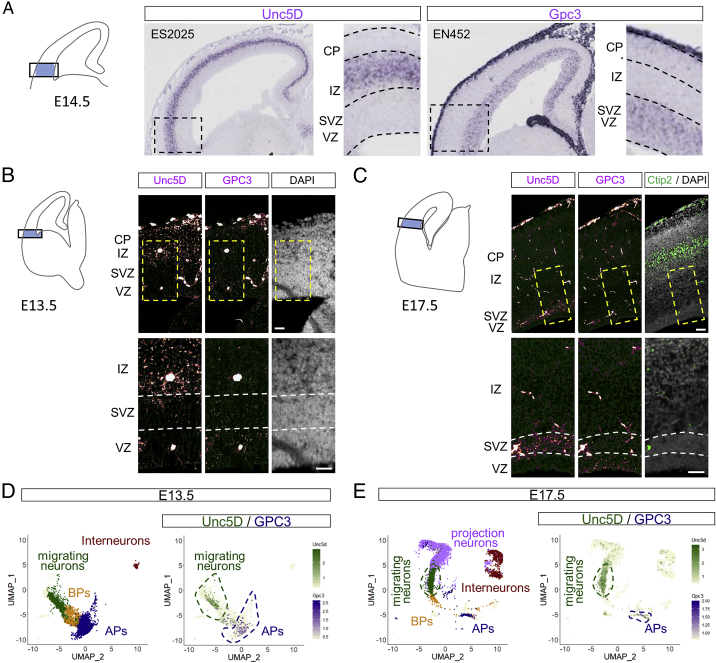
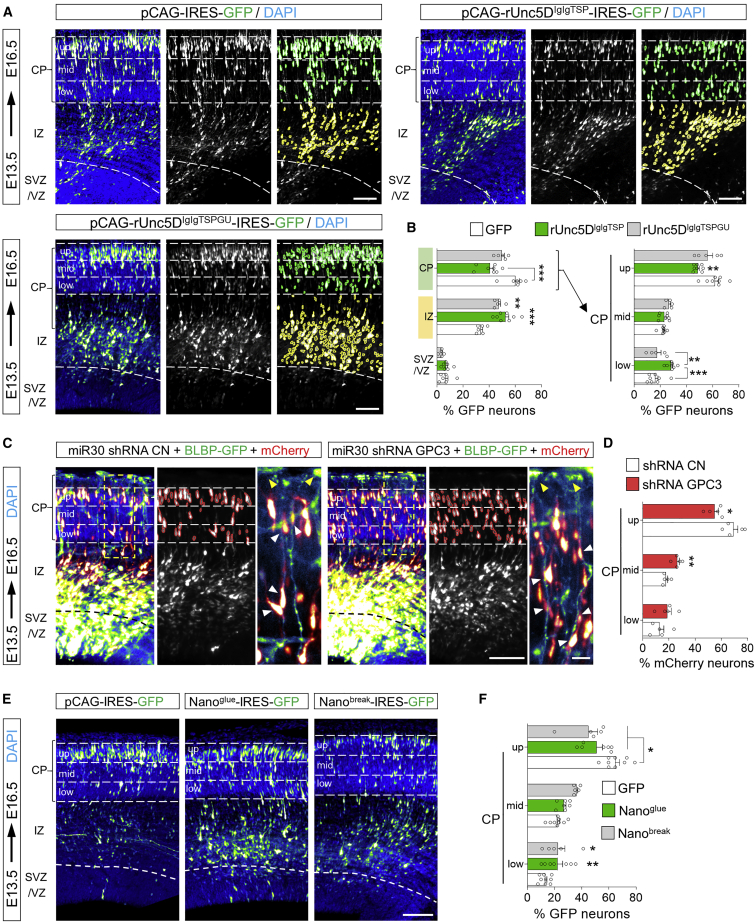
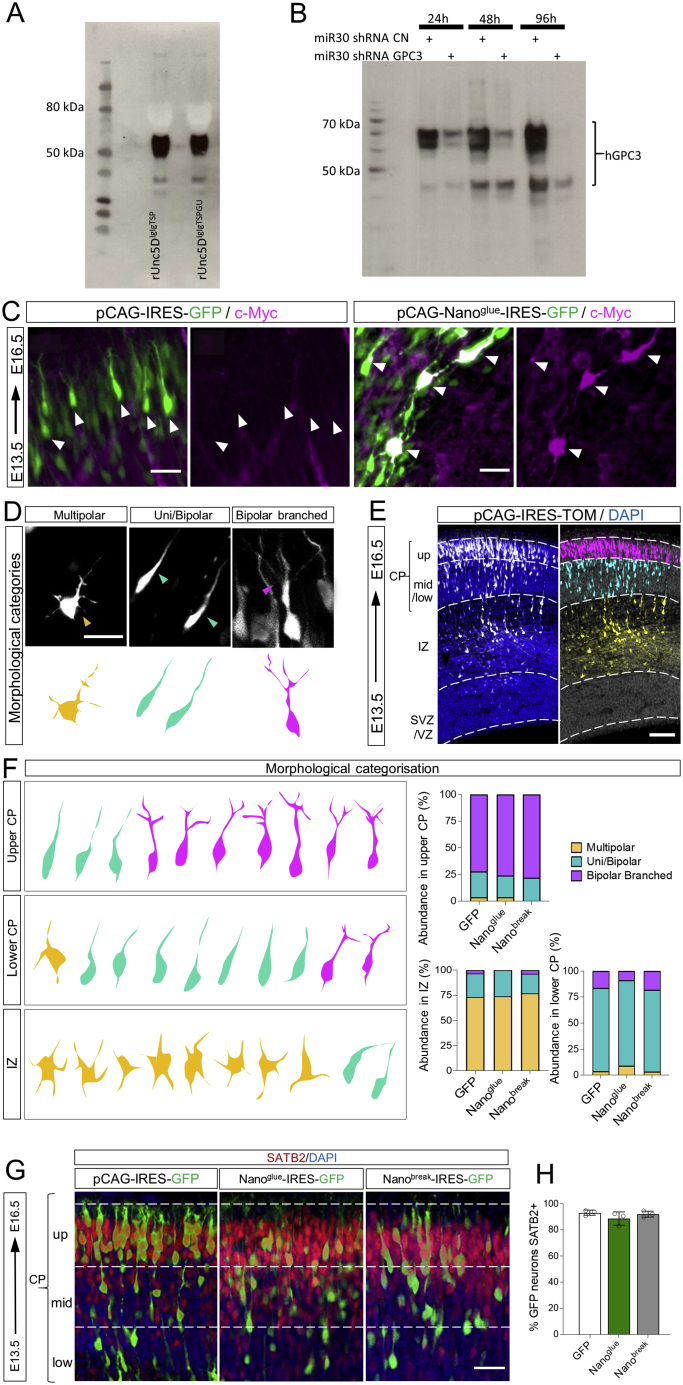
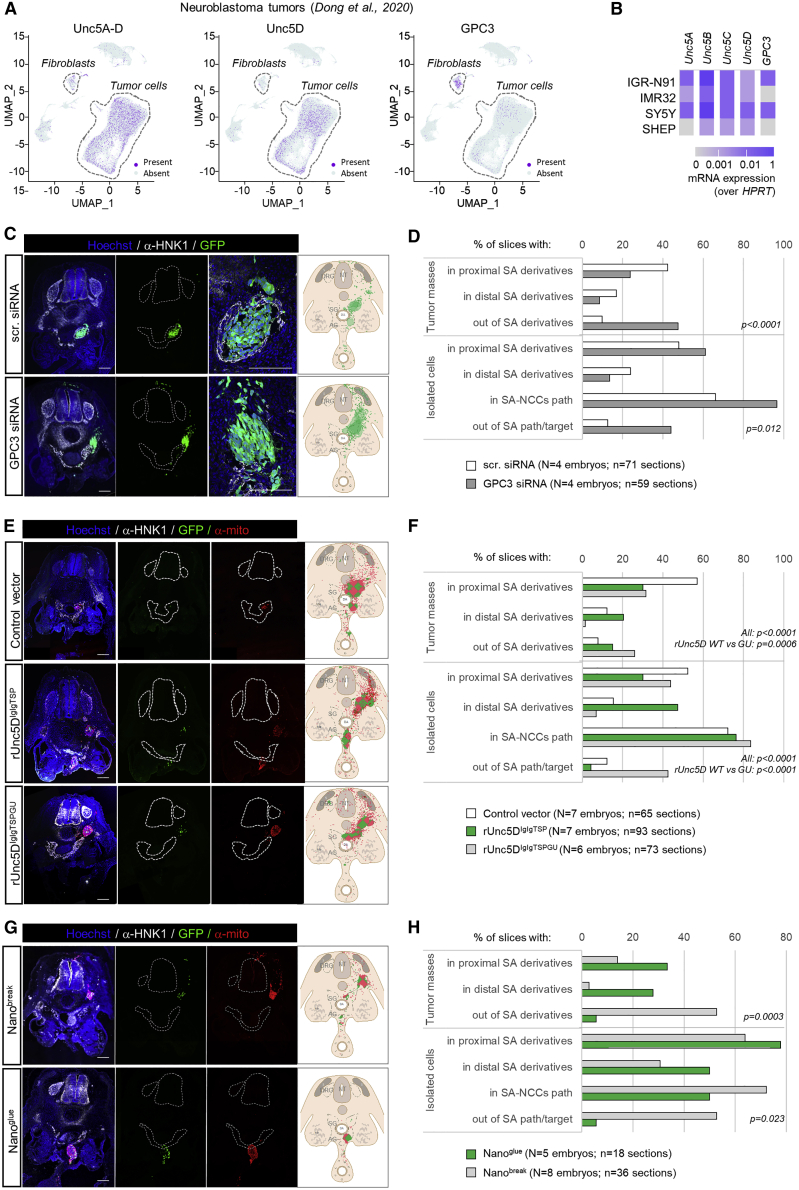
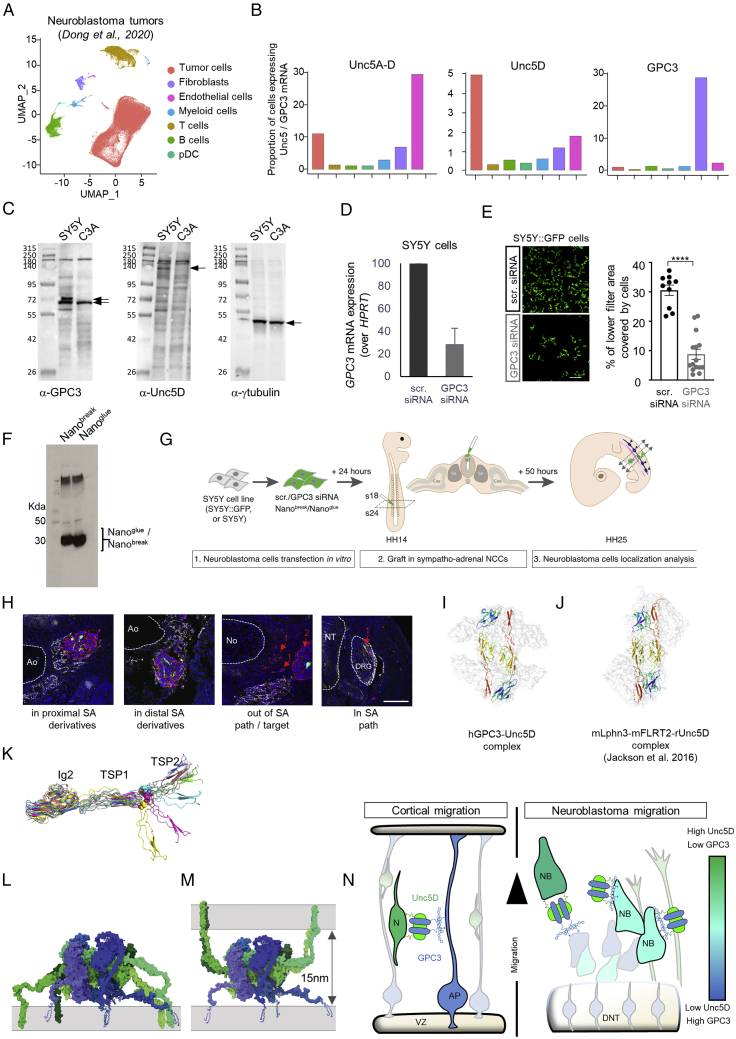
Neural migration is a critical step during brain development that requires the interactions of cell-surface guidance receptors. Cancer cells often hijack these mechanisms to disseminate. Here, we reveal crystal structures of Uncoordinated-5 receptor D (Unc5D) in complex with morphogen receptor glypican-3 (GPC3), forming an octameric glycoprotein complex. In the complex, four Unc5D molecules pack into an antiparallel bundle, flanked by four GPC3 molecules. Central glycan-glycan interactions are formed by N-linked glycans emanating from GPC3 (N241 in human) and C-mannosylated tryptophans of the Unc5D thrombospondin-like domains. MD simulations, mass spectrometry and structure-based mutants validate the crystallographic data. Anti-GPC3 nanobodies enhance or weaken Unc5-GPC3 binding and, together with mutant proteins, show that Unc5/GPC3 guide migrating pyramidal neurons in the mouse cortex, and cancer cells in an embryonic xenograft neuroblastoma model. The results demonstrate a conserved structural mechanism of cell guidance, where finely balanced Unc5-GPC3 interactions regulate cell migration.

Keywords: GPC3; UNC5A; UNC5B; UNC5C; UNC5D; Unc5; cell guidance; cell migration; cortex development; crystallography; glypican-3; nanobodies; neuroblastoma; stripe assay; structural biology; surface plasmon resonance; uncoordinated-5.


Conflict of interest statement

Declaration of interests The authors declare no competing interests.

Figures

None
Graphical abstract
Figure 1
Figure 1
GPC3core and Unc5IgIgTSP crystal structures reveal an octameric complex (A) Domain architecture of Unc5 and GPC3. A furin-type cleavage site is indicated by a scissors symbol. (B) Crystal structure of hGPC3core, using the nomenclature presented in (Kim et al., 2011). The structure is colored according to the rainbow (blue, N terminus; red, C terminus). (C) Superposition of hGPC1, yellow (Awad et al., 2015), and hGPC3 core, blue. (D–I) Views of the hGPC3core-rUnc5DIgIgTSP complex in two orientations, indicating hGPC3core as ribbons in dark blue and gray (D and G), an overview of the complex in solid surface view with GPC3 in shades of blue and Unc5 in shades of green (E and H), and views in which the Unc5 chains are indicated in green and gray ribbons (F and I). Video S1 shows additional views. See also Figure S1, Document S1, Table S1, and Video S1.
Figure S1
Figure S1
mGPC3core structure and GPC3-Unc5D complex data, related to Figure 1 (A) Mouse GPC3core structure colored according to the rainbow (blue: N-terminus, red: C-terminus). (B) Electron density map calculated from murine GPC3core crystals is shown in blue, centered on N123 and N240 of a symmetry-related molecule (left) and N240 (right). (C) ELISA plate contained Unc5D-AP (human, residues 33–379) immobilized in each well as bait and 95 other Fc-tagged proteins were added as prey, as described in (Ozgul et al., 2019). As expected, FLRT2/3 bind to Unc5D. GPC3 (human, residues 25–563) was a new positive interactor. Positive control was NRXN1-Fc/NLGN1-AP as described in (Ozgul et al., 2019). (D) SPR experiments show binding of Unc5 extracellular domains to hGPC3core. The apparent KDs (KDcalc) were calculated using a 1:1 binding model and are indicative only. Bmax, R2 and amount of ligand immobilised on the flowcell surface are indicated. (E) Crystal packing environment for the three complex structures. Each octameric unit is shown in a different color, with a central unit in green. (F–H) Tandem MS (MS/MS) analysis of peaks presented in Figure 2A. Peaks reveal rUnc5IgIgTSP and hGPC3core(R355A/R358A) subcomplexes. The 93 kDa peak dissociated into masses corresponding to GPC3 (56.78 kDa excluding glycans) and Unc5D (35.66 kDa excluding glycans), the peaks corresponding to 185 and 370 kDa dissociated into GPC3 (56.78 kDa) and a mass of 126 kDa (consistent with a 2:1 Unc5D:GPC3 complex). In the 370 kDa peak we additionally detected a 312 kDa species (consistent with a 4:3 Unc5D:GPC3 complex). Charge state series (labeled with colored dots) are assigned to the complexes shown. (I) rUnc5DIgIgTSP is shown in red, yellow and green ribbons, as found in the complex with mGPC3core. The surface of mGPC3core is colored in shades of blue according to sequence conservation (blue = conserved, while = not conserved). Surface conservation was calculated using aligned sequences from human, mouse, opossum, chicken, frog, and fish GPC3 (top) or mouse GPC1-6 (bottom). Note that the Unc5-binding site is less conserved amongst mouse GPC1-6 sequences, compared to different GPC3 sequences. (J) SPR results show that hUnc5A isoform A, which lacks a TSP1 domain, is unable to bind hGPC3core.
Figure 2
Figure 2
Characterization of the hGPC3-rUnc5 complex (A) Native MS spectrum of rUnc5IgIgTSP and hGPC3core (R355A/R358A). Charge state series (labeled with colored dots) are assigned to the complexes shown. Individual peaks were isolated for MS/MS analysis to identify subcomplexes (Figures S1F–S1H). (B–E) SPR data shows binding that rUnc5IgIgTSP, but not the shorter constructs rUnc5DIgIg and rUnc5DTSPTSP, binds hGPC3core with nanomolar affinity. The apparent KD (KDcalc) was calculated using a 1:1 binding model and is indicative only. (F) Binding interfaces 1–3 on rUnc5DIgIgTSP. (G) Binding interfaces 1–3 on hGPC3core. (H) Binding interfaces 1–3 indicated on the octameric complex. The glypican molecule for which these are shown is outlined in red. (I) Zoomed views of interacting residues in interfaces 1–3 (hGPC3core-rUnc5DIgIgTSP complex). Hydrogen bonds are shown as dotted yellow lines. (J) Summaries of the hydrogen bond analyses during restrained molecular dynamics (MD) simulation. Atoms that contribute to stable hydrogen bonds between the two proteins are shown, and colored blocks indicate the stability of the bond during simulation (averages for the four copies of the complex). Non-averaged results are shown in Figures S2A–S2C. (K) View of the glycan emanating from two copies of hGPC3 N241 toward the center of the complex. C-mannosylated tryptophans of nearby rUnc5D TSP1 domains are indicated (W253, W256). The calculated 2FoFc map of the hGPC3-rUnc5D complex data is shown as a gray mesh (sigma = 1). (L and M) As (K), but showing zoomed views of the N241-glycan for one of the hGPC3 copies within the complex. The map is carved around the N-linked glycan. (N) Distances below 3.5 Å between atoms within glycans from different chains are indicated as yellow dotted lines. See also Figure S2.
Figure S2
Figure S2
Hydrogen bond analysis during MD simulation and mass spectrometry analysis of Unc5 peptides, related to Figure 2 (A–C) Quantification of MD simulation results for each of the four pseudo-symmetrical copies in the complex, for each of the three rUnc5D-hGPC3 interfaces described in Figure 2. (D and E) Views of the electron density maps calculated for the X-ray crystal structure of Unc5Aiso1 (Seiradake et al., 2014): the 2Fo-Fc is shown in blue (1 sigma level). The Fo-Fc map is shown in red/green (+/− 3 sigma level). Extra density is observed on the first two of the TSP tryptophans of the consensus W1xxW2xxW3 motif. (F–I) LCMSMS of the tryptic Unc5 peptides confirming the C-mannosylation of tryptophan residues in the TSP1 domains of Unc5 proteins expressed in HEK cells.
Figure 3
Figure 3
The non-binding mutants Unc5GU and GPC3UG, Unc5-GPC3 interaction “in trans” is inhibited by “in cis” interactions (A) A cell-based assay shows binding between mUnc5B (expressed on cells) and purified GPC3core, but not GPC3coreUG. Representative images. (B) Quantification of cell-based assays. The Unc5-lingand FLRT2 (LRR domain, FLRT2LRR) is also used. (C) SPR binding data using Unc5Becto. The apparent KD (KDcalc) was calculated using a 1:1 binding model and is indicative only. (D) As (C), using rUnc5Decto. (E) A cell-cell aggregation assay shows that GPC3 and Unc5D mediate cell adhesion in trans. Representative images. (F) Quantification of cell-cell aggregation experiments. Empty vector controls: pCAGIC (red) and pCAGIG (green). (G) Cell-cell aggregation assay using co-expression of Unc5D and GPC3 in cis. Representative images. (H) Quantification of experiments using co-expression. ∗∗∗p < 0.001; ∗∗∗∗p < 0.0001, one-way ANOVA with Tukey’s post hoc tests. Scale bars represent 100 μm. See also Figure S3.
Figure S3
Figure S3
mUnc5A and mUnc5C binding results, protein co-expression analysis, related to Figure 3 (A) SPR results show binding of hGPC3core protein to mouse Unc5A and C ectodomain. The apparent KD (KDcalc) for the wild type protein interaction was calculated using a 1:1 binding model and is indicative only. Bmax, R2 and the units of ligand immobilised on the flowcell surface are indicated. The N241Q mutant protein (hGPC3coreUG) does not show binding. (B) We used a cell-based assay to show that hGPC3core, but not the mutant, binds to mUnc5C expressed on cells. (C) SPR results show no binding of hGPC3core protein to Unc5(A)–(D)GU mutant proteins. Corresponding binding curves using wild type Unc5 proteins are shown in Figure S1D. (D) Western blot analysis using anti-HA to visualise HA-tagged Unc5 constructs expressed in cell aggregation assays. (E) Same samples as in panel D, but here visualising Flag-GPC3. (F) Same as panel D, but using anti-actin control. (G) Cell-surface staining using anti-HA and anti-Flag was performed to complement the total protein expression analysis shown in panels (D)–(F), and to include additional conditions. Representative images are shown. Scale bars = 30 μm. (H) Quantification of the experiments shown in panel F.
Figure 4
Figure 4
Nanobodies enhance or disrupt GPC3-Unc5 interaction (A) SPR binding data using hGPC3core and Nanoglue. (B) As in (A), with Nanobreak. (C) The equilibrium values from experiments shown in panels A and B, and equivalent values from using mGPC3488 (Figures S4E and S4F). KD values were calculated assuming 1:1 binding. (D) Unc5B pull downs with immobilized hGPC3core using Nanoglue and Nanobreak. (E and F) Equilibrium SPR data (raw data in Figures S4E and S4F) confirms that Nanoglue enhances, and Nanobreak weakens, GPC3-Unc5D binding. (G) Cell-cell aggregation assay using soluble Nanobreak and Nanoglue. Representative images. (H) Quantification of cell-cell aggregation experiments. (I) E15.5 dissociated cortical neurons were grown on alternate stripes (red and black) containing Fc, GPC3core, or GPC3coreUG. (J) Quantification beta-III-tubulin+ (green) pixels on red stripes: Fc (=Fc/Fc control), GPC3 (=hGPC3core/hGPC3coreUG). We performed equivalent stripe assays also for HeLa, N2A and SY5Y cells, using DAPI for quantification. ∗∗∗∗p < 0.0001, Student T-tests. (K) Results from stripe assays in the presence of streptavidin (Ctrl) or streptavidin-nanobody complexes (Nanoglue or Nanobreak). We performed one-way ANOVA with Tukey’s post hoc tests (H) and (K). NS, not significant; p < 0.05; ∗∗∗p < 0.001; ∗∗∗∗p < 0.0001. Scale bars represent 100 μm (G) and 90μm (I). See also Figure S4.
Figure S4
Figure S4
Nanoglue and Nanobreak in SPR experiments and stripe assays, related to Figure 4 (A–D) Binding curves from SPR experiments. Unc5A-D receptor ectodomains were immobilised. Human GPC3core or murine GPC3ecto was injected using a 2-fold dilution series (top concentrations are 4.5 μM), in the presence of FC control protein, Nanoglue or Nanobreak. The concentration of nanobodies was kept constant at 9 μM (with hGPC3core), or 4.5 μM (with mGPC3ecto). The concentration of FC control protein was kept constant at equivalent mg/ml concentrations. (E and F) An analogous experiment was performed using immobilised nanobodies, and different concentrations of human GPC3core or murine GPC3488 and Unc5Decto. Taken together, the results demonstrate that Nanobreak competes with Unc5 for GPC3-binding, whilst Nanoglue strengthens the interaction. Calculated KDs for nanobody-GPC3 interactions are shown in Figure 4C. Given the unusual stoichiometry of the Unc5-GPC3 complex, we have not calculated KD values from experiments containing also Unc5. (G) Purified proteins were immobilised in a stripe pattern to assess their effect on the migration of cortical neurons. GPC3core and GPC3coreUG trigger strong cell repulsion, compared to neutral control protein (Fc). (H) Quantification of the experiments shown in panel F. One-way ANOVA with Tukey’s post hoc tests.∗∗∗p < 0.001. (I) We performed GPC3core/GPC3coreUG stripe assays, but in the presence of streptavidin (CN) or streptavidin-nanobody complexes. Nanobreak reduced the ability of neurons to distinguish between hGCP3core and hGCP3coreUG. (J) Quantification of data shown in panel H. ∗∗∗p < 0.001, two-tailed Student’s T test. Scale bar represents 90 μm (G) and (I).
Figure 5
Figure 5
GPC3 is expressed by cortical apical progenitor cells (A) Cortical region shown in (B), (J), and magnified in (C). (B) Double in situ hybridization (ISH) for Unc5D (magenta) and GPC3 (yellow) shows their expression in the cortex at E15.5. ISH is combined with the neuronal marker Ctip2 (green). The layers enriched in neurons (N) and apical progenitors (AP) are indicated. (C) Upper panels show the ISH for Unc5D (red) combined with the neuronal marker Ctip2 (green). Lower panels show the ISH for GPC3 (white) and the apical progenitor marker Pvim (green). The location of the CP, IZ, SVZ, and VZ layers are indicated. Nuclear staining with DAPI is shown in blue. (D) Unc5D and GPC3 expression levels normalized to GADPH in neurons and APs, using RNA profiling data published in Florio et al. (2015) (GSE65000). Unc5D mRNA is high in neurons (N), while GPC3 mRNA is enriched in AP cells. p < 0.05, ∗∗∗p < 0.001, two-tailed Student’s t test. (E) UMAP visualization of single-cell data from E15.5 mouse cortex published in di Bella et al., (2021) (GSE153164). Basal progenitor (BP). (F) Combined plot of Unc5D (green) and GPC3 (magenta) mRNA expression per cell. Most of Unc5D-expressing cells belong to the migrating neuron cluster (dashed green line), GPC3-expressing cells are enriched in the AP cluster (blue dashed line). (G) Quantification of the distribution of Unc5D- and GPC3-positive cells. (H) Cortical region used for pull down with Nanoglue. (I) Volcano plot showing enriched proteins in control (black) and Nanoglue (pink) pull downs revealed by mass spectrometry. Non-significant proteins are represented in light gray. (J) Immunostaining for GPC3 using Nanoglue coupled to fluorescent streptavidin on coronal section of E15.5 mouse cortex. The image is colored based on the intensity of the staining. Arrowheads indicate staining that resembles the pattern of AP fibers. (K) Summary model showing Unc5 and GPC3 expression patterns. Scale bars represent 200 μm (B), (J, top left) and 20 μm (C). See also Figure S5.
Figure S5
Figure S5
Unc5D and GPC3 are expressed during cortical development, related to Figure 5 (A) ISH for Unc5D and GPC3 in an E14.5 brain sagittal section. Unc5D is expressed in the IZ and GPC3 in the VZ/SVZ as indicated with higher magnification on the left. Images are from https://gp3.mpg.de and the image series ID is shown on the top left of each image. (B and C) ISH for Unc5D and GPC3, colored in magenta, shows expression in the cortex of coronal sections of E13.5 (B) and E17.5 (C) mouse embryos. Each panel shows a diagram on the left, which is indicating the cortical region shown. The area in the dashed rectangle is magnified on the bottom. (D and E) UMAP visualization of single-cell RNA sequencing data from E13.5 (D) and E17.5 (E) mouse cortex published in di Bella et al., (2021). Five major cell clusters, colored by cell-type assignment based on published metadata (GSE153164), are shown on the left. A combined plot of Unc5D (green) and GPC3 (magenta) mRNA expression per cell is shown on the right. Most of Unc5D-expressing cells belong to the migrating neuron cluster (dashed green line), while GPC3-expressing cells are highly enriched in the apical progenitor (AP) cluster (blue dashed line). Scale bars represent 100 μm (B) and (C).
Figure 6
Figure 6
GPC3 promotes radial migration of Unc5-expressing cells (A) Coronal sections of E16.5 cortex after IUE using empty vector (pCAGIG, control), rUnc5DIgIgTSP, or rUnc5DIgIgTSPGU. The cortical plate (CP) is defined based on DAPI staining. GFP-positive cells in the IZ (yellow) and CP (green) are automatically identified and the percentage in each layer quantified. The CP is further subdivided into 3 bins (up, mid, low). (B) Quantification of data shown in (A). CP and IZ is highlighted in green and yellow, respectively. n = 8 GFP, n = 8 rUnc5Decto, and n = 5 rUnc5DIgIgTSP electroporated brains. ∗∗p < 0.01, ∗∗∗p < 0.001, one-way ANOVA test with Tukey’s post hoc analysis. (C) Coronal sections of a E16.5 cortex electroporated with pCAGGS-mCherry, pCAG-BLBP-GFP and a pCAG-miR30 vector coding for shRNA control (CN) or shRNA targeting murine GPC3. The number of mCherry-positive neurons in contact with a GFP-positive radial fiber in each bin was quantified (white arrowheads, inset on the right). Endfeet of radial fibers are indicated with yellow arrowheads. (D) Quantification of the data shown in (C). n = 5 CN, n = 5 shRNA GPC3, electroporated brains. p < 0.05, ∗∗p < 0.01, two-tailed Student’s t test. (E) Coronal sections of E16.5 cortex after IUE using empty vector (pCAGIG, control), Nanoglue, or Nanobreak at E13.5. GFP-positive were quantified for each bin. (F) Quantification of data shown in (E). n = 9 GFP, n = 7 Nanoglue, and n = 5 Nanobreak electroporated brains. p < 0.05, ∗∗p < 0.01, one-way ANOVA test with Tukey’s post hoc analysis. Scale bars represent 100 μm (A),(C), and (E) and 20 μm (inset in C). See also Figure S6.
Figure S6
Figure S6
Validation of secreted Unc5D constructs and GPC3 shRNA in vitro, nanobody expression in vivo, related to Figure 6 (A) Anti-HA western blot showing the secretion levels of HA-tagged rUnc5IgIgTSP constructs that we used in IUE experiments. Supernatants of transfected HEK293 cells were analyzed. We find that both constructs are secreted effectively. (B) Anti-FLAG blot showing hGPC3 expression in HEK cells, at different time points after transfection (24, 48, 96 h). HEK cells were co-transfected with vector expressing control (CN) or GPC3 shRNA. Significant reduction in GPC3 expression was observed after 24, 48 and 96h for cells co-transfected cells with GPC3 shRNA. Similar results were obtained for mGPC3ecto (not shown), as expected, given that the target sequence is conserved in murine and human GPC3. (C) IUE of pCAG-IRES-GFP (pCAGIG, control) and pCAGIG encoding Nanoglue-IRES-GFP was performed at E13.5 and analyzed at E16.5. Myc-tagged Nanoglue protein expression in neurons was confirmed by immunostaining with anti-Myc (magenta). Nanoglue expression coincides with the positions of cells expressing the reporter GFP (green). White arrows indicate neurons expressing GFP (control and Nanoglue plasmid). Scale bar represents 25mm. (D) We categorized neurons overexpressing nanobodies or GFP into multipolar, uni/bipolar, or bipolar branched phenotypes (example images). (E) Electroporated neurons in the upper CP (magenta), mid-lower CP (cyan) and IZ (yellow) are colored according to the highest abundance of each morphological category in each bin. Nuclear staining with DAPI is shown in blue. (F) Abundance of each category of neurons in the upper/mid-lower CP and in the IZ of electroporated brains. (G) Staining of electroporated slices (GFP, Nanoglue or Nanobreak) with the laminar marker Satb2 (red). Nuclear staining with DAPI is shown in blue. (H) Quantification of G. Scale bar represents 25mm (C), 20 μm (D), 100mm € and (G).
Figure 7
Figure 7
GPC3-Unc5 signaling determines neuroblastoma cell migration properties (A) UMAP visualization of single-cell data from neuroblastoma tumors (Dong et al., 2020) and quantification for selected transcripts. (B) Heatmap of Unc5A-D and GPC3 mRNA expression in 4 human neuroblastoma cell lines, measured by qRT-PCR. (C) SY5Y:GFP cells were transfected (scramble, scr., or GPC3 siRNA) and engrafted within the migratory trunk neural crest of E2 chicken embryos and slices analyzed 2 days later. Neural crest-derived structures were labeled with an anti-HNK1 antibody, nuclei with Hoechst. (D) Quantification of SY5Y cell and tumor positions two days after grafting. (E and F) As (C) and (D), but SY5Y cells were transfected with vectors encoding rUnc5DIgIgTSP, Unc5DIgIgTSPGU or pCAGIG (control) vectors prior to the graft. Samples were labeled with anti-human mitochondrial antibody to reveal all SY5Y cells (transfected: green + red; non-transfected: red). (G and H) SY5Y cells were transfected with vectors encoding Nanoglue or Nanobreak prior to the graft. Scale bars: 200 μm. For (D), (F), and (H), we used χ2 tests to compare scr. (control) versus GPC3 siRNA conditions (D), rUnc5decto versus rUnc5dectoGU (F), and Nanoglue versus Nanobreak conditions (H). NT: Neural Tube; S: Somite; DRG: Dorsal Root Ganglia; SG: Sympathetic Ganglia; AG: Adrenal Gland; DA: Dorsal Aorta; Me: Mesonephros. See also Figure S7.
Figure S7
Figure S7
Interfering with GPC3-Unc5 interaction impacts on neuroblastoma cell migration properties; structural discussion of Unc5 complexes, related to Figure 7 (A) UMAP visualization of single-cell data from neuroblastoma tumors (Dong et al., 2020). (B) Quantification of Unc5A-D, Unc5D alone, and GPC3 transcripts for each cell type. (C) Western Blot analysis of GPC3 and Unc5D proteins in SY5Y and C3A cells. (D) Q-RT-PCR analysis of GPC3 mRNA expression in SY5Y cells, 24 h after transfection, using GPC3 siRNA or scr.siRNA as a control. (E) Representative images (left) and quantification (right) of transwell assays measuring the migratory properties of SY5Y:GFP cells transfected with either scr or GPC3 siRNA. ∗∗∗∗:p < 0.0001. Student T test with Welsch correction. (F) Anti-Myc western blot showing the secretion levels of Myc-tagged nanobody constructs used in Figure 7G. Supernatants of transfected SY5Y cells were analyzed. We find that both constructs are secreted effectively. (G) Scheme of the in ovo graft experimental paradigm describing the experiments presented in Figures 7C–7H. NB: neuroblastoma. (H) Illustrations of the phenotypic classification quantified in Figures 7C–7H. Neural crest-derived structures were labeled with an anti-HNK1 antibody. Human NB cells were detected with an anti-mito antibody (in red) and transfected NB cells with GFP (in green). Nuclei were stained with Hoechst. “1” points at isolated cells; “2” points at tumor masses. NT: Neural Tube; Ao: Dorsal aorta; DRG: Dorsal Root Ganglia; No: Notochord. Scale bar: 200 μm. (I) Two of the four rUnc5DIgIgTSP chains in the complex with hGPC3core are shown as ribbons, colored according to the rainbow (N-terminus = blue, C-terminus = red). The rest of the complex is shown as transparent surface (gray). (J) rUnc5DIgIgTSP in complex with FLRT2 and Latrophilin3 (Jackson et al., 2016). The two Unc5D chains are highlighted as rainbow ribbons. (K) Superpositions of Alpha-fold models of the rUnc5D Ig2-TSP1-TSP2 region, after MD simulation, suggests flexibility in the TSP1-TSP2 linker. (L) The ‘in cis’ model of hGPC3-rUnc5D was created using Alpha-fold, MD simulation and MODELLER. GPC3: shades of blue, Unc5D: shades of green. We have not included intracellular domains. (M) As panel L, but showing a potential ‘in trans’ configuration where GPC3 and Unc5D are expressed on adjacent cells. (N) Schematic summarizing the Unc5/GPC3 expression levels and putative interactions in the cortical and neuroblastoma models presented in this manuscript. Expression of Unc5D and GPC3 is color-coded from green (high Unc5D/ low GPC3) to blue (low Unc5D, high GPC3). Cells colored in cyan indicate co-expression of both receptors. N: neuron, AP: apical progenitor, VZ: ventricular zone, NB: neuroblastoma cell, DNT: dorsal neural tube

Comment in

References

    1. Abraham M.J., Murtola T., Schulz R., Páll S., Smith J.C., Hess B., Lindahl E. GROMACS: High performance molecular simulations through multi-level parallelism from laptops to supercomputers. SoftwareX. 2015;1–2:19–25. doi: 10.1016/J.SOFTX.2015.06.001. - DOI
    1. Agirre J., Iglesias-Fernández J., Rovira C., Davies G.J., Wilson K.S., Cowtan K.D. Privateer: software for the conformational validation of carbohydrate structures. Nat. Struct. Mol. Biol. 2015;22:833–834. doi: 10.1038/nsmb.3115. - DOI - PubMed
    1. ben Amar D., Thoinet K., Villalard B., Imbaud O., Costechareyre C., Jarrosson L., Reynaud F., Novion Ducassou J., Couté Y., Brunet J.-F., et al. Environmental cues from neural crest derivatives act as metastatic triggers in an embryonic neuroblastoma model. Nat. Commun. 2022;13:2549. doi: 10.1038/s41467-022-30237-3. - DOI - PMC - PubMed
    1. Aricescu A.R., Lu W., Jones E.Y. A time- and cost-efficient system for high-level protein production in mammalian cells. Acta Crystallogr D Biol Crystallogr. 2006;62:1243–1250. doi: 10.1107/S0907444906029799. - DOI - PubMed
    1. Awad W., Adamczyk B., Örnros J., Karlsson N.G., Mani K., Logan D.T. Structural aspects of N-glycosylations and the C-terminal region in human glypican-1. J. Biol. Chem. 2015;290:22991–23008. doi: 10.1074/jbc.M115.660878. - DOI - PMC - PubMed

Publication types