. 2022 Nov 1;34(11):1765-1778.e6.
doi: 10.1016/j.cmet.2022.09.024. Epub 2022 Oct 13.

The gut peptide Reg3g links the small intestine microbiome to the regulation of energy balance, glucose levels, and gut function

Affiliations

The gut peptide Reg3g links the small intestine microbiome to the regulation of energy balance, glucose levels, and gut function

Jae Hoon Shin et al. Cell Metab. .

Abstract

Changing composition of the gut microbiome is an important component of the gut adaptation to various environments, which have been implicated in various metabolic diseases including obesity and type 2 diabetes, but the mechanisms by which the microbiota influence host physiology remain contentious. Here we find that both diets high in the fermentable fiber inulin and vertical sleeve gastrectomy increase intestinal expression and circulating levels of the anti-microbial peptide Reg3g. Moreover, a number of beneficial effects of these manipulations on gut function, energy balance, and glucose regulation are absent in Reg3g knockout mice. Peripheral administration of various preparations of Reg3g improves glucose tolerance, and this effect is dependent on the putative receptor Extl3 in the pancreas. These data suggest Reg3g acts both within the lumen and as a gut hormone to link the intestinal microbiome to various aspects of host physiology that may be leveraged for novel treatment strategies.

Keywords: Reg3g, obesity, type 2 diabetes, gut function, gut microbiome.


Conflict of interest statement

Declaration of interests R.J.S. has received research support from Novo Nordisk, Astra Zeneca, Pfizer, and Fractyl. R.J.S has served as a paid consultant and/or scientific advisory board member to Novo Nordisk, Scohia, Fractyle and ShouTi Pharma. R.J.S. has equity or option positions in Rewind and Calibrate Health. S.L.-A. is a paid employee of Novo Nordisk.

Figures
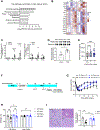
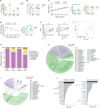
Figure 1.
Figure 1.. Reg3g is required for the maintenance of weight loss following VSG
(A) Top 6 pathways enriched in the ileum of VSG mice relative to Sham mice. (full dataset available online as NCBI GEO data set-GSE53782) (Ryan et al., 2014). (B) Gene expression profiles enriched in the antimicrobial peptides pathway (n=5/group). (full dataset available online as NCBI GEO data set-GSE53782). (C) mRNA expression of Reg3g in the small intestine from rats underwent RYGB (Rat) (n = 5 for both groups) and mice underwent VSG (Sham n = 8; VSG n = 6). (D) Circulating levels of Reg3g in Sham (n=3) and VSG (n=5)-operated mice. (E) Circulating REG3A concentrations before and at 1 and 3 months after surgery in young patients who underwent VSG surgery (n=29). (F) Experimental timeline. (G) Body weight change (%) of sham and VSG-operated mice over the study period (WT-Sham n=9, WT-VSG n=15, KO-Sham n=8, KO-VSG n=11). (H) Body composition changes 8 weeks after surgery period (WT-Sham n=9, WT-VSG n=15, KO-Sham n=8, KO-VSG n=11). (I) Representative images of the H&E-stained liver section and quantification of liver triglyceride in mice histopathological examination of liver (n=7 WT-Sham, 12 WT-VSG, 6 KO-Sham, 8 KO-VSG). Data are shown as means±SEM. P values indicate multiple unpaired t test (C), Student’s 2-tailed t test (D), a repeated-measures 1-way ANOVA (E), or 2-way ANOVA (F, G, and H); *p < 0.05, **p < 0.01, ***p < 0.001.
Figure 2.
Figure 2.. Reg3g enhances glucose homeostasis after VSG
(A) Overnight-fasting glucose levels. (B) Intraperitoneal tolerance test (IP injection of a bolus of 2g/kg dextrose) was performed at 4 weeks post operation. Blood glucose levels were measured at the indicated point. (C) Corresponding area under the curve (AUC). (A to C; n=9 WT-Sham, 15 WT-VSG, 8 KO-Sham, 11 KO-VSG). (D) Blood glucose levels before and 15min post glucose gavage (2g/kg dextrose) from mice underwent intestinal permeability test (Sham n=4; VSG n=6) (E) Circulating levels of Insulin 15min post glucose gavage (2g/kg dextrose) from mice underwent intestinal permeability test (Sham n=4; VSG n=6). (F) Glucose (12mM) -stimulated insulin secretion in isolated islets shown as fold change above basal. Data are shown as means±SEM. P values indicate 2-way ANOVA (A, C, D and E) or 1-way ANOVA (F); *p < 0.05, **p < 0.01, ***p < 0.001.
Figure 3.
Figure 3.. Pharmacological effect of Reg3g on glucose regulation
(A) Effect of acute injection of Reg3g on glucose tolerance. IPGTT in DIO mice 20min after single dose of PBS (n=10) or Reg3g (0.1 mg/kg) (n=9). (B) Glucose-stimulated insulin secretion in isolated islets from lean WT mice. Islets were incubated for an hour with vehicle or Reg3g (50ng/ml) before glucose treatment. (C and D) Effect of acute injection of Reg3g on DIO WT (vehicle n=6; Reg3g n=8) (C) and Extl3Δβ-cell mice (vehicle n=10; Reg3g n=11) (D). Data are shown as means±SEM. P values indicate 2-Way ANOVA or Student’s 2-tailed t test; *p < 0.05, **p < 0.01, ***p < 0.001.
Figure 4.
Figure 4.. Alteration of Gut microbiota in duodenum of Reg3g KO mice after VSG
(A) Chao1 (richness) and Shannon (diversity) index of the gut microbiota in the duodenal contents. (B) Principal-coordinate analysis (PCoA) of unweighted UniFrac distances for the duodenal microbiota. Each symbol represents an individual mouse. (C) Average relative abundance of bacterial phyla in duodenal contents from VSG or Sham operated mice. (D and E) LEfSe analysis depicting nodes within the bacterial taxonomic hierarchy that are enriched in duodenal microbiota from WT-VSG versus WT-Sham (D) and KO-VSG versus KO-Sham (E). Cladogram generated by LEfSe indicating differences at phylum, class, order, family, and genus levels between the two groups. (F) Discriminatory importance scores of top-ranked genus identified by the Random Forest analysis. A comparison of the abundance of markers in WT-VSG (left) and KO-VSG (right) relative to Sham counterparts. (G) Relative abundance of Lactobacillus genus in the duodenal contents and feces. Data are shown as means±SEM; WT-Sham n=5, WT-VSG n=7, KO-Sham n=5, KO-VSG n=12. P values indicate 2-way ANOVA; *p < 0.05, **p < 0.01, ***p < 0.001.
Figure 5.
Figure 5.. Reg3g contributes to improvements in gut function after VSG
(A) Intestinal permeability determined by FITC-dextran in VSG-operated mice as % change (Sham-operated mice) (n=6). (B) Expression of genes involved in intestinal cell integrity in intestine from Sham and VSG-operated mice underwent intestinal permeability test (Sham n=4/genotype, VSG n=6/genotype). (C) Expression of genes involved in anti-oxidative stress from Sham and VSG-operated mice underwent intestinal permeability test (Sham n=4/genotype, VSG n=6/genotype). (D) MDA concentrations in the ileum from HFD fed WT and Reg3g KO mice after surgery (n=4/group). (E) Measurement of Cellular ROS production in the enteroids at 2h with H2O2 (200μM) in ± Reg3g (100 ng/ml) (n=7/treatment). ***p < 0.001 for control versus H2O2; ###p < 0.001. Data are shown as means±SEM. P values indicate Student’s 2-tailed t test(A) or 2-way ANOVA (B, C, D, and E); *p < 0.05, **p < 0.01, ***p < 0.001.
Figure 6.
Figure 6.. Contribution of Reg3g to metabolic improvements induced by fermentable Inulin supplement
(A) mRNA expression of Reg3g in the intestinal segments from mice fed a cellulose or inulin diet (cellulose n=7, inulin n=8). (B) Cumulative food intake of WT and Reg3g KO mice on a cellulose or inulin-enriched diet (WT n=12/diet, KO n=11/diet). (C) Body weight and body composition over time. (D) IPGTT (IP injection of a bolus of 2g/kg dextrose) was performed. Blood glucose levels were measured at the indicated point and area under curve (AUC). (E) Chao1 richness and Shannon diversity of the gut microbiota in the duodenal contents. (F) Principal-coordinate analysis (PCoA) of unweighted UniFrac distances for the duodenal microbiota. Each symbol represents an individual mouse. (G) Average relative abundance of bacterial phyla in duodenal contents from cellulose- or inulin-diet fed mice (WT-cellulose n=6, WT-inulin n=4, KO-cellulose n=8, KO-inulin n=10). (H and I) LEfSe analysis depicting nodes within the bacterial taxonomic hierarchy that are enriched in duodenal microbiota from KO cellulose versus inulin (H) and WT cellulose versus inulin (I). Cladogram generated by LEfSe indicating differences at phylum, class, order, family, and genus levels between the two groups. (J) Discriminatory importance scores of top-ranked genus identified by the Random Forest analysis. A comparison of the abundance of markers in WT-inulin (left) and KO-inulin (right) relative to cellulose-fed counterparts. Data are shown as means±SEM. P values indicate 2-way ANOVA (A and E) or multiple unpaired t test (B); *p < 0.05, **p < 0.01, ***p < 0.001.
Figure 7.
Figure 7.. Reg3g contributes to improvements in gut function mediated by microbiota
(A) Intestinal permeability determined by FITC-dextran in inulin-fed mice as % change (cellulose-fed mice) (n=7-8). (B) Expression of genes involved in intestinal cell integrity in intestine from cellulose or inulin-fed mice (n=6-8). (C) Expression of genes involved in anti-oxidative stress in intestine from cellulose or inulin-fed mice (n=6-8). (D) Expression of intestinal Reg3g in mice given PBS or probiotics (n=6-7) (E) Circulating levels of Reg3g in mice given PBS or probiotics (n=5). (F) Intestinal permeability determined by FITC-dextran in probiotics-gavage mice given LPS (0.1 mg/kg) as % change (vehicle-fed mice) (n=6-7). Data are shown as means±SEM. P values indicate Student’s 2-tailed t test (A, D, and E) or 2-way ANOVA (B and C); *p < 0.05, **p < 0.01, ***p < 0.001.

Comment in

References

    1. Abu-Gazala S, Horwitz E, Ben-Haroush Schyr R, Bardugo A, Israeli H, Hija A, Schug J, Shin S, Dor Y, Kaestner KH, et al. (2018). Sleeve Gastrectomy Improves Glycemia Independent of Weight Loss by Restoring Hepatic Insulin Sensitivity. Diabetes 67, 1079–1085 - PMC - PubMed
    1. Altay O, Nielsen J, Uhlen M, Boren J, and Mardinoglu A (2019). Systems biology perspective for studying the gut microbiota in human physiology and liver diseases. EBioMedicine 49, 364–373. - PMC - PubMed
    1. Arble DM, Evers SS, Bozadjieva N, Frikke-Schmidt H, Myronovych A, Lewis A, Toure MH, and Seeley RJ (2018). Metabolic comparison of one-anastomosis gastric bypass, single-anastomosis duodenal-switch, Roux-en-Y gastric bypass, and vertical sleeve gastrectomy in rat. Surg Obes Relat Dis 14, 1857–1867. - PMC - PubMed
    1. Birt DF, Boylston T, Hendrich S, Jane JL, Hollis J, Li L, McClelland J, Moore S, Phillips GJ, Rowling M, et al. (2013). Resistant starch: promise for improving human health. Adv Nutr 4, 587–601. - PMC - PubMed
    1. Bluemel S, Wang L, Martino C, Lee S, Wang Y, Williams B, Horvath A, Stadlbauer V, Zengler K, and Schnabl B (2018). The Role of Intestinal C-type Regenerating Islet Derived-3 Lectins for Nonalcoholic Steatohepatitis. Hepatol Commun 2, 393–406. - PMC - PubMed

Publication types