. 2022 Dec 21;110(24):4090-4107.e11.
doi: 10.1016/j.neuron.2022.09.021. Epub 2022 Oct 13.

Motor neurons use push-pull signals to direct vascular remodeling critical for their connectivity

Affiliations

Motor neurons use push-pull signals to direct vascular remodeling critical for their connectivity

Luis F Martins et al. Neuron. .

Abstract

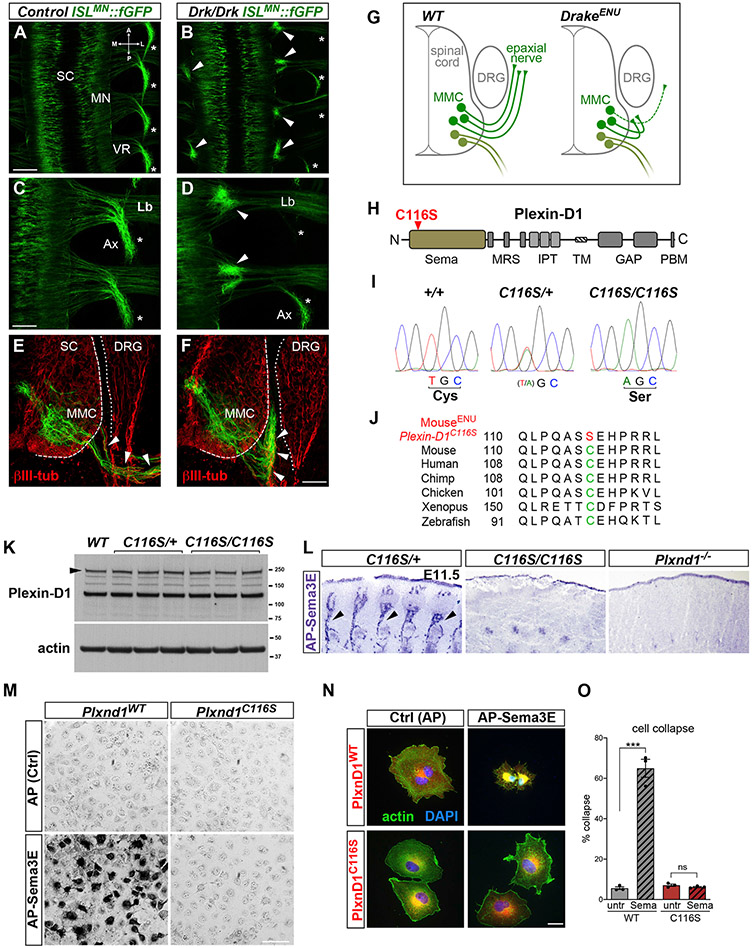
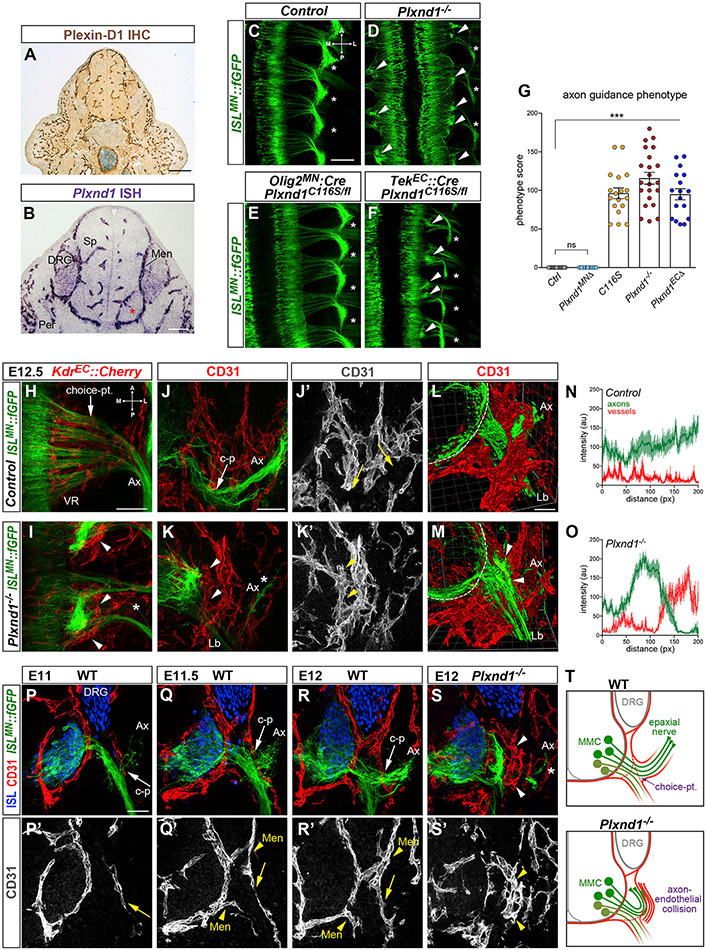
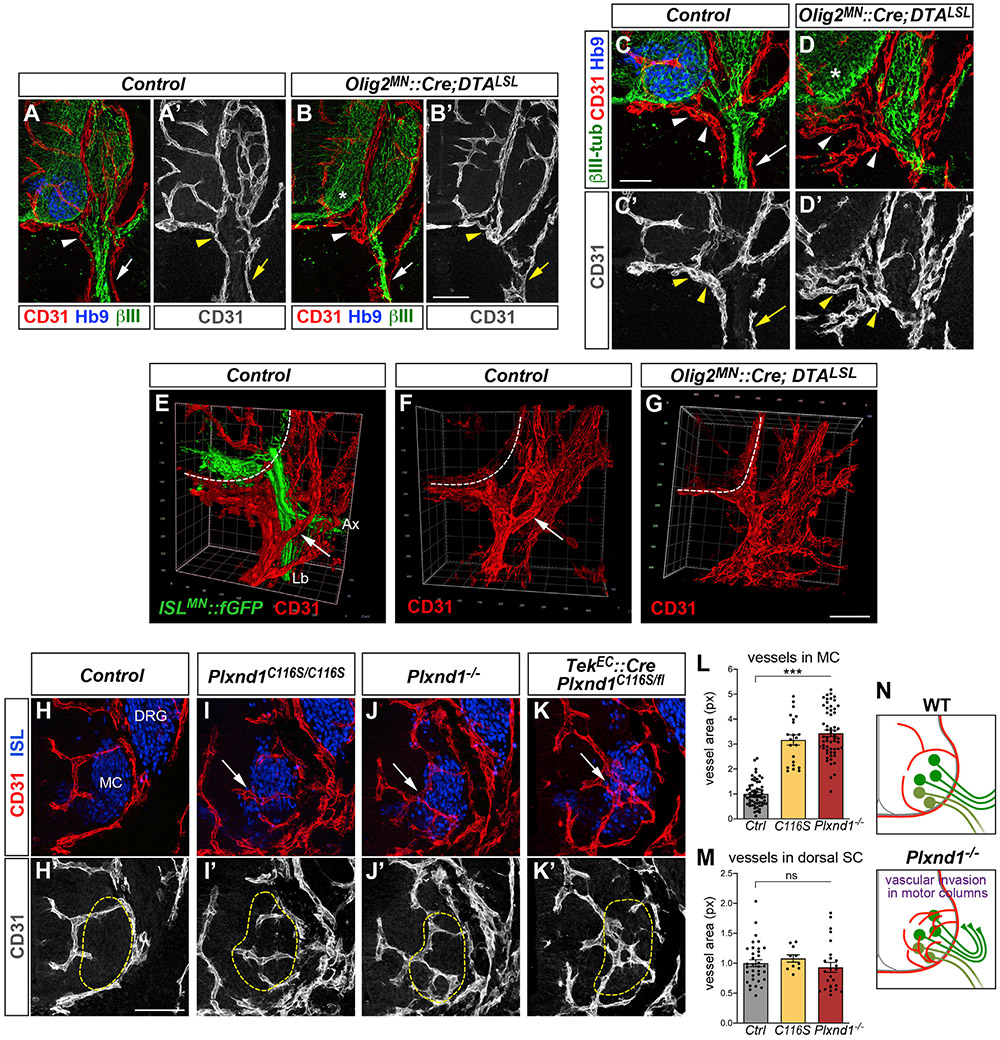
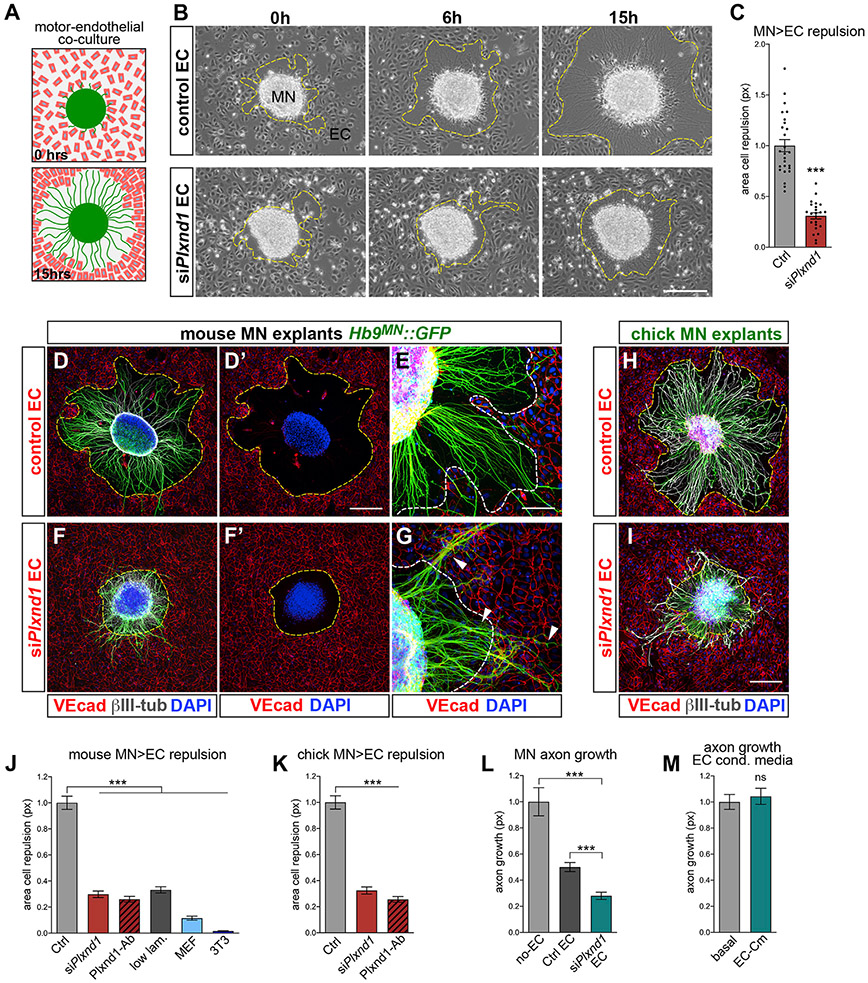
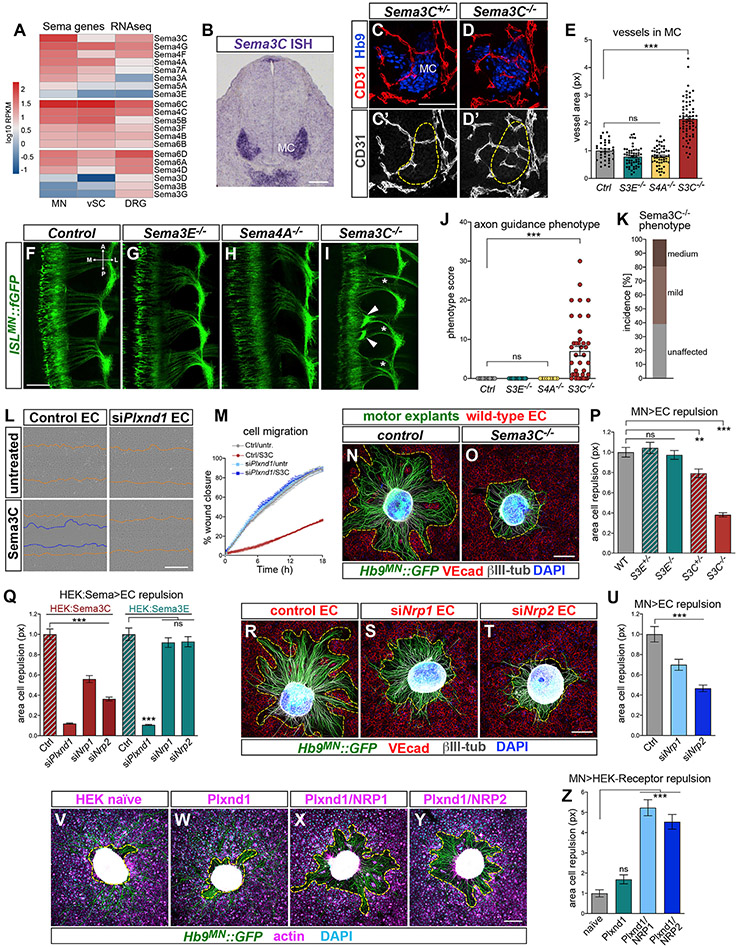
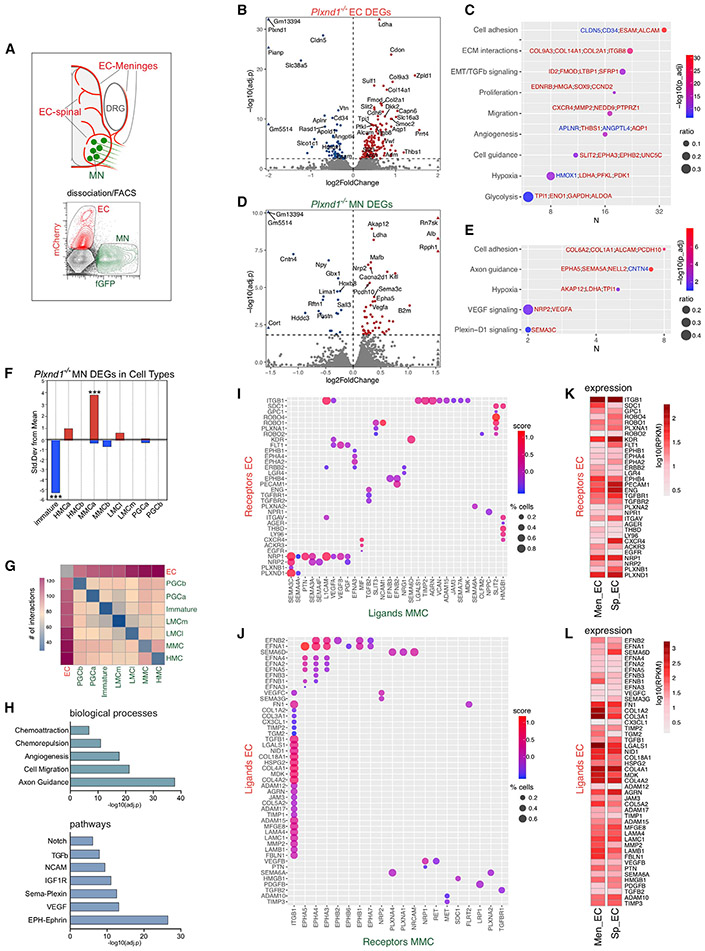
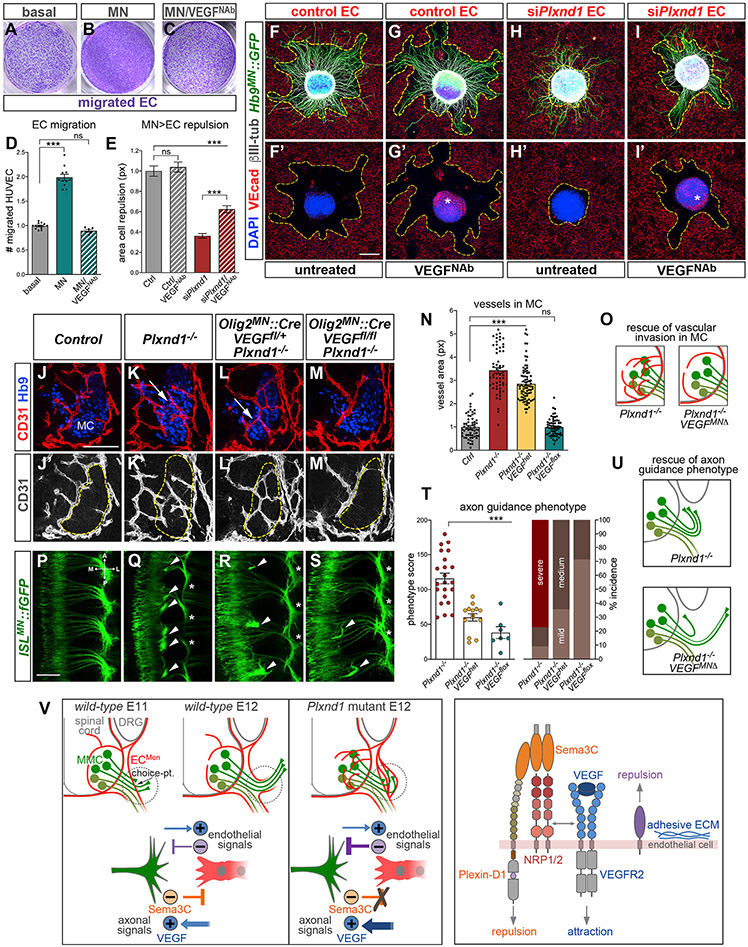
The nervous system requires metabolites and oxygen supplied by the neurovascular network, but this necessitates close apposition of neurons and endothelial cells. We find motor neurons attract vessels with long-range VEGF signaling, but endothelial cells in the axonal pathway are an obstacle for establishing connections with muscles. It is unclear how this paradoxical interference from heterotypic neurovascular contacts is averted. Through a mouse mutagenesis screen, we show that Plexin-D1 receptor is required in endothelial cells for development of neuromuscular connectivity. Motor neurons release Sema3C to elicit short-range repulsion via Plexin-D1, thus displacing endothelial cells that obstruct axon growth. When this signaling pathway is disrupted, epaxial motor neurons are blocked from reaching their muscle targets and concomitantly vascular patterning in the spinal cord is altered. Thus, an integrative system of opposing push-pull cues ensures detrimental axon-endothelial encounters are avoided while enabling vascularization within the nervous system and along peripheral nerves.

Keywords: VEGF; axon guidance; cell signaling; cell-cell interactions; forward genetics; motor neurons; neural circuits; neurovascular patterning; semaphorin/plexin; spinal cord.


Conflict of interest statement

Declaration of interests The authors declare no competing interests.

Figures

Figure 1.
Figure 1.. The ENU-induced Plexin-D1 allele Drake causes selective motor axon guidance defects
(A–D) Whole mounts of E12.5 ISLMN::fGFP+ embryos (dorsal view of lumbar region). MNs in the spinal cord (SC) project through the ventral roots (VRs) to epaxial (Ax, asterisks) or limb (Lb) muscles. Drake homozygotes (Drk/Drk) display proximal motor axon bundles (arrowheads) and corresponding depletion of epaxial nerves. Control is Drk/+. Other nerve tracts are intact. A, anterior; P, posterior; M, medial; L, lateral. (E and F) E12.5 transverse sections show the initial course of ISLMN::fGFP+ epaxial motor axons (arrowheads in E), which is halted in Drake mutants (arrowheads in F). βIII-tubulin, pan-neuronal marker. ISLMN::fGFP signal is higher in the MMC neurons relative to other subtypes. DRG, dorsal root ganglia. (G) Motor axon stalling in Drake embryo. (H) Plexin-D1 with C116S mutation in “Sema” ligand-binding domain. Other domains are labeled. (I) Genomic DNA sequencing reveals homozygous T>A substitution in Plxnd1 exon 1 of Drake embryos, leading to C116S mutation. (J) Evolutionary conservation of C116 (green, mouse sequence) and ENU-induced mutation (red). (K) Lysates of E12.5 spinal cords and surrounding tissue. Plexin-D1 levels in Drake homozygous (C116S/C116S) or heterozygous (C116S/+) mutants are comparable to WT. Actin is a loading control. (L) Alkaline phosphatase (AP)-tagged Sema3E reveals Plexin-D1 in E11.5 sagittal sections. Arrows point to intersomitic vessels. Binding is absent in C116S/C116S and Plxnd1 KO embryos. (M) AP-Sema3E binding to COS-7 cells expressing WT Plexin-D1 but not C116S mutant. No signal is detected with control AP-Fc. (N) Sema3E induces collapse of COS-7 cells expressing WT Plexin-D1 but not C116S mutant. (O) Quantification of cell collapse. Mean ± SEM, Unpaired t test (***) p = 0.0002 WT untreated (untr.) versus Sema; (ns) p = 0.24 C116 untr. versus Sema. Sample size for this and following quantification is reported in STAR Methods. Scale bars: 200 μm in (A) and (B); 100 μm in (C) and (D); 50 μm in (E) and (F); 50 μm in (M); and 50 μm in (N). See also Figure S1.
Figure 2.
Figure 2.. Endothelial Plexin-D1 is required for motor axon guidance and interaction with vessels
(A) Immunohistochemistry for Plexin-D1 reveals restricted vascular expression at E11.5. (B) In situ hybridization at E11.5 detects Plexin-D1 on blood vessels in the spinal cord (Sp), meninges (Men) and peripheral tissues (Per), but not in the MC (asterisk). Lower signal is visible in DRG. (C–F) Aberrant motor axon bundles (arrowheads) and epaxial nerve thinning (asterisks) in E12.5 Plxnd1−/− whole mounts (dorsal view) (D) and following deletion of Plxnd1 from ECs (TekEC::Cre; Plxnd1C116S/fl) (F) but not MNs (Olig2MN::Cre; Plxnd1C116S/fl) (E). Control is Olig2MN::Cre; Plxnd1+/fl. (G) Quantification of axon guidance phenotype. Mean ± SEM, ANOVA/Dunnett’s test (***) p < 0.00001 C116S, Plxnd1−/− and Plxnd1ECΔ versus Ctrl; (ns) Plxnd1MNΔ versus Ctrl; ANOVA/Tukey’s test (ns) p > 0.1 C116S versus Plxnd1−/− versus Plxnd1ECΔ. (H and I) Whole mounts of embryos co-expressing motor (ISLMN::fGFP) and endothelial (KdkEC::Cherry) reporters (E12.5, dorsal view). Arrow marks the MMC choice point. Ectopically arranged ECs surround axon bundles in Plxnd1−/− (arrowheads in I). Epaxial nerves (Ax) are depleted (asterisk). (J–K′) MMC axons (ISLMN::fGFPhigh) extend through vessels (CD31+) in E12.5 controls (J and J′; c-p, MMC choice point). Axons are blocked by ectopic EC clusters in mutants (K and K′, arrowheads) resulting in near-ablation of epaxial nerves (Ax, asterisk). Lb, limb nerve (ISLMN::fGFPlow). (L and M) 3D two-photon imaging (E12.5). The rendered volume was clipped in M to visualize axon-EC apposition (arrowheads). Dashed lines mark the spinal cord margin. (N and O) Intensity profile of ISLMN::fGFP (motor axons) and CD31 (vessels) along MMC trajectory reveals abnormal adjacent peaks in mutants (mean ± SEM). (P–S′) Lumbar transverse sections of ISLMN::fGFP+ embryos stained for endothelial marker CD31 and motor/sensory neuron marker Isl1/2. MMC projections (Ax) intersect ECs migrating from the meninges (Men, arrowheads in Q′ and R′) along the common nerve path. Epaxial choice point (c-p, arrows in P–R′) In Plxnd1−/−, axons stall against ectopic EC clusters (arrowheads in S and S′). Asterisk marks residual epaxial axons. (T) MMC axons are obstructed by ECs in Plxnd1 mutants. To simplify the diagram of axonal projections, MMC cell bodies are shown in a fictitious lateral position. Scale bars: 200 μm in (A); 100 μm in (B); 200 μm in (C)–(F); 100 μm in (H) and (I); 50 μm in (J)–(K′); 50 μm in (L) and (M); and 50 μm in (P)–(S′). See also Figure S2.
Figure 3.
Figure 3.. Motor-endothelial interactions instruct vascular patterning in the spinal cord and ventral root
(A–D′) Genetic ablation of MNs in E12 Olig2MN::Cre; DTALSL embryos disrupts vascular patterns at motor exit points (arrowheads) and along sensory fibers (βIII-tubulin, arrows). Controls are Cre negative. MNs (Hb9+) are efficiently eliminated (asterisks in B and D). (E–G) 3D view of vessels surrounding ISLMN::fGFP+ motor nerves in E12 controls (arrows in E and F). This configuration is disrupted in absence of motor projections (G). Ax, epaxial nerve; Lb, limb nerve. (H–K′) Vascular invasion of MCs (Isl1/2+, dashed lines) in Plxnd1 mutants (E12.5, lumbar level). Vessels encircle MCs in controls (Plxnd1+/−, H and H′) but intermingle with MNs in mutants (I–K′, arrows). (L) Quantification ofvascular area (CD31 + px) within MCs at lumbar level. Mean, normalized to control ± SEM, ANOVA/Dunnett’s test (***) p < 0.00001 C116S and Plxnd1~’~ versus Ctrl. (M) Quantification of vascular area (CD31+ px) in dorsal spinal cord. Mean, normalized to control ± SEM, ANOVA/Dunnett’s test (ns) p > 0.5. (N) Vascular invasion of MCs in Plxnd1 mutants. Scale bars: 100 μm in (A)–(B′); 50 μm in (C)–(D′); 100 μm in (E)–(G); and 100 μm in (H)μ(K′). See also Figure S3.
Figure 4.
Figure 4.. Plexin-D1 is required for EC repulsion by motor axons
(A) MN explant-EC repulsion assay. (B) Live imaging of MN-EC co-cultures. (Top panels) HUVECs (EC) settle next to explants (0 h) but are repelled as axons extend. Dashed lines here and in following panels mark the EC front. (Bottom panels) Plxnd1 KD from ECs (siPlxnd1 EC) affects repulsion. “Control EC” transfected with non-targeting siRNA. (C) EC repulsion quantified by measuring cell-free area after overnight (ON) growth. Mean, normalized to control ± SEM, Unpaired t test (***) p < 0.0001. (D–G) ON co-cultures between Hb9MN::GFP motor explants and control (D and E) or siPlxnd1 EC (F and G) stained for EC marker VE-cadherin (VEcad) and neuronal βIII-tubulin. (H and I) Co-cultures between motor explants from chick neural tube electroporated with GFP (green) and either control (H) or siPlxnd1 EC (I). (J) EC repulsion after ON co-culture with mouse motor explants. “Control”: HUVEC WT or transfected with non-targeting siRNA; “siPlxnd1”: Plxnd1 KD; “anti-Plxnd1”: blocking antibody; “low-laminin” substrate; “MEF”/“3T3”: co-cultures with primary mouse embryonic fibroblasts or NIH-3T3. Mean, normalized to control ± SEM, ANOVA/Dunnett’s multiple comparison test (***) p < 0.0001 versus control. (K) EC repulsion in co-cultures with chick motor explants. Mean, normalized to control ± SEM, ANOVA/Dunnett’s multiple comparison test (***) p < 0.0001 versus control. (L) Axon extension from Hb9MN::GFP motor explants cultured alone or with either control or siPlxnd1 EC. Mean, normalized to control ± SEM, ANOVA/Dunnett’s test (***) p < 0.0001 versus control; unpaired t test (***) p < 0.0001 siPlxnd1 versus control. (M) MN explants cultured with HUVEC-conditioned media versus control basal media. Mean, normalized to control ± SEM, Unpaired t test (ns) p = 0.61. Scale bars: 200 μm in (B); 200 μm in (F) and (F’); 100 μm in (E) and (G); and 200 μm. See also Figure S4 and Videos S1, S2, S3, S4, S5, and S6.
Figure 5.
Figure 5.. MN-derived Sema3C triggers EC repulsion through Plexin-D1/NRP receptors
(A) Normalized RNA-seq counts for Semaphorins in Hb9MN::GFP+ MNs, GFP~ spinal cord cells (vSC) and DRG FACS-purified from E12.5 embryos. Sema3C is high in MNs while Sema3E levels are negligible. (B) Sema3C detected in MCs by in situ hybridization at E11.5. (C–D′) Vessels invade MCs (Hb9+, outlined) in Sema3C−/− (D and D′) but avoid this region in controls (Sema3C+/−, C and C′; E12.5 lumbar transverse sections). (E) Quantification of vascular area (CD31+ px) within MCs. Mean, normalized to control ± SEM, ANOVA/Dunnett’s test (***) p < 0.00001 Sema3C−/− versus Ctrl; (ns) p > 0.1 Sema3E−/− and Sema4A−/− versus Ctrl. (F–I) Proximal axon bundling (arrowheads) and epaxial nerve thinning (asterisks) in Sema3C−/− whole mounts (E12.5, dorsal view). Sema3E and Sema4A mutants are unaffected. Control is Sema3C heterozygous. (J) Quantification of axon guidance phenotype. Mean ± SEM, ANOVA/Dunnett’s test (***) p = 0.0002 Sema3C−/− versus Ctrl; (ns) Sema3E−/− and Sema4A−/− versus Ctrl. (K) Penetrance and severity of axon guidance defects in Sema3C mutants. (L) Last frames (18 h) of scratch wound healing assay on control (siCtrl-transfected) or Plxnd1 KD HUVEC stimulated with Sema3C (lower panels) or left untreated (upper panels). Orange lines mark the initial wound margin; blue lines mark the migratory front. Both untreated control and siPlxnd1 EC migrate to close the gap. Sema3C inhibits migration of control but not siPlxnd1 EC. (M) HUVEC migration rate in scratch assay. Mean ± SEM (see also Figure S5H). (N and O) Hb9MN::GFP motor explants from either WT (N) or Sema3C−/− embryos (O) cultured ON with HUVEC. (P) Quantification of EC repulsion in co-cultures with Sema3E or Sema3C KO motor explants. Repulsion from Sema3C heterozygous and KO explants (but not Sema3E−/−) is blunted. Mean, normalized to WT ± SEM, ANOVA/Dunnett’s test (***) p < 0.0001 Sema3C−/− versus Ctrl; (**) p = 0.0046 Sema3C+/~ versus Ctrl; (ns) p > 0.8 Sema3E+/~ and Sema3E−/− versus Ctrl. (Q) Quantification of HUVEC repulsion from HEK cells overexpressing Sema3E (HEK:SemaE) or Sema3C (HEK:Sema3C). Representative images are shown in Figure S5P. Plxnd1 KD in HUVEC prevents repulsion from Sema3E and Sema3C. Nrp1 or Nrp2 KD impairs repulsion from Sema3C but not Sema3E. Mean, normalized to WT ± SEM, ANOVA/Dunnett’s test for HEK:Sema3C (***) p < 0.0001 siPlxnd1, siNrp1, siNrp2 versus Ctrl; for HEK:Sema3E (***) p < 0.0001 siPlxnd1 versus Ctrl; (ns) p > 0.5 siNrp1, siNrp2 versus Ctrl. (R–T) Co-cultures between Hb9MN::GFP motor explants and control HUVEC (R) or HUVEC with KD of either Nrp1 (S) or Nrp2 (T). (U) Silencing Nrp1 and Nrp2 impairs EC repulsion. Mean, normalized to WT ± SEM, ANOVA/Dunnett’s test (***) p = 0.0005 siNrp1 versus Ctrl; (***) p < 0.0001 siNrp2 versus Ctrl. (V–Y) Co-cultures between motor explants and naive HEKs (V) or cells stably transfected with Plexin-D1 alone (W) or in combination with either NRP1 (Plxnd1/NRP1) (X) or NRP2 (Plxnd1/NRP2) (Y). HEKs are identified by F-actin (magenta) and nuclear (DAPI, cyan) staining. Motor axons grow over HEK-Ctrl and HEK-Plxnd1 but repel cells co-expressing Plexin-D1/NRPs. Dashed lines mark cell-free area. (Z) Quantification of HEK cell repulsion. Mean, normalized to WT ± SEM, ANOVA/Dunnett’s test (***) p < 0.0001 Plxnd1/Nrp1 and Plxnd1/Nrp2 versus Ctrl; (ns) p = 0.44 Plxnd1 versus Ctrl. Scale bars: 100 μm in (B); 100 μm in (C)x–(D’); 200 μm in (F)–(I); 400 μm in (L); 200 μm in (N)–(O); 200 μm in (R)–(T); and 200 μm in (V)–(Y). See also Figure S5.
Figure 6.
Figure 6.. Mutual signaling underlying MN-EC crosstalk
(A) ECs (from spinal and meningeal vasculature) and MNs were FACS-purified from E12.5 embryos expressing ISLMN::fGFP+/KdrEC::Cherry reporters and analyzed by RNA-seq. (B) Volcano plot of genes upregulated (160, red) or downregulated (65, blue) in Plxnd1−/− ECs (adjusted p < 0.01). Selected DEGs with highest significance are labeled. (C) Gene ontology (GO) enrichment of DEGs in Plxnd1−/− ECs (Plxnd1 was removed). Dot plot shows the number of genes associated with GO term (x axis), gene count ratio (circle size) and enrichment significance (color scale). Selected upregulated (red) and downregulated (blue) genes are shown. (D) Volcano plot of genes upregulated (52, red) or downregulated (23, blue) in MNs of Plxnd1−/− embryos (adjusted p < 0.01). (E) GO enrichment of DEGs in MNs from Plxnd1−/− embryos. (F) Stratification of Plxnd1−/− DEGs among MN subtypes by EWCE. Upregulated genes, red; downregulated genes, blue. (***) p = 0.0002 immature; p = 0.0005 MMCa. (G) Counts of ligand-receptor interactions identified by CellPhoneDB between MN subtypes (E12.5) and ECs isolated from the mesenchyme of E11–E13 mouse embryos. (H) GO of ligand-receptor pairs between MMC and EC identified by CellPhoneDB. (I and J) Representation of the strongest ligand-receptor interactions between MMC and EC from a curated list of 675 pairs associated with cell guidance and angiogenesis. (I) Interactions between MMC ligands (31) and EC receptors (32). (J) Interactions between EC ligands (46) and MMC receptors (20). Color scale, “interaction scores.” Circle size, lowest percentage of cells of either type expressing a gene in the pair. (K and L) Expression of receptors (K) and ligands (L) measured by RNA-seq of ECs isolated from either the meninges (Men_EC) or spinal cord (Sp_EC) of E12.5 embryos. Several ligands were higher in Men_ECs (20/46; adjusted p < 0.001) including ephrins and ECM factors. Most of these genes were expressed in HUVECs (Table S5). See also Figure S6 and Tables S1, S2, S3, S4, and S5.
Figure 7.
Figure 7.. Integration of opposing motor-derived stimuli by ECs controls axon targeting and SC vascularization
(A–C) Crystal violet staining of HUVECs migrated to the bottom side of Transwell membrane. Migration is stimulated by MN-conditioned media in the lower compartment (B) relative to control basal media (A). The effect is prevented by neutralizing anti-VEGF164 antibody (VEGFNab) added to the lower chamber during migration (6 h) (C). (D) Quantification of HUVEC migration. Mean, normalized to Ctrl ± SEM, ANOVA/Dunnett’s test (***) p < 0.0001 MN versus basal; (ns) p = 0.26 MN/VEGFNab versus basal. (E) Quantification of cell repulsion in co-cultures between WT motor explants and control or siPxlnd1 HUVECs either treated with VEGFNAb or left untreated. Plxnd1 KD (siPlxnd1) prevents repulsion, and this effect is partially reversed by VEGF blockade (siPlxnd1/VEGFNab). VEGFNab does not affect repulsion of control cells (Ctrl/VEGFNab) compared with co-cultures in basal media (Ctrl). Mean, normalized to Ctrl ± SEM, ANOVA/Dunnett’s test (***) p < 0.0001 siPlxnd1 and siPlxnd1/VEGFNab versus Ctrl; (ns) p = 0.85 Ctrl/VEGFNab versus Ctrl; unpaired t test (***) p < 0.0001 siPlxnd1/VEGFNab versus siPlxnd1. (F–I′) Motor explants co-cultured with siPlxnd1 or control HUVEC with or without VEGFNab. The fluorescent-secondary antibody used for VE-cadherin staining (red) also reveals VEGF in explants treated with VEGFNab due to matching host species of the primary antibodies (asterisks in G′ and I′). (J–M′) Aberrant ingrowth of vessels into the MC (dashed lines) in Plxnd1 mutants (K and K′, arrow) is rescued by conditional deletion of Vegfa in MNs with Olig2MN::Cre (M and M′). Plxnd1−/− embryos heterozygous for Vegfa-floxed allele are not rescued (L and L′, arrow). (N) Quantification of vascular area (CD31+ px) within MCs. Control and Plxnd1−/− measurements are also shown in Figure 3L. Mean, normalized to Ctrl ± SEM, ANOVA/Dunnett’s test (***) p < 0.00001 Plxnd1−/− and Plxnd1−/−;VEGFhet versus Ctrl; (ns) p > 0.1 0.1 Plxnd1−/−;VEGFflox versus Ctrl. (O) Vascular invasion of Plxnd1 mutants is rescued by Vegfa inactivation in MNs. (P–S) Axon bundling (arrowheads) and epaxial nerve thinning (asterisks) distinctive of Plxnd1 mutants are partially corrected by conditional deletion of Vegfa in MNs (E12.5 whole mounts, dorsal view). (T) (Left) Quantification of axon guidance phenotype. Gradual rescue of Plxnd1−/− axon defects by deletion of one (Plxnd1−/−;VEGFhet) or two VEGF alleles (Plxnd1−/−;VEGFflox) in MNs. Mean ± SEM, ANOVA/Dunnett’s multiple comparison test (***) p < 0.0001 Plxnd1−/−;VEGFhet and Plxnd1−/−;VEGFflox versus Plxnd1−/−. (Right) Penetrance and severity of phenotype in Plxnd1/Vegfa compound mutants compared with Plxnd1−/−. (U) Rescue of axon guidance errors of Plxnd1 mutants by Vegfa gene inactivation in MNs. (V) (Left) Interactions between motor axons and vessels in WT and Plxnd1 mutant embryos (top). Dashed circles mark the choice point where epaxial MN axons use Sema3C/Plexin-D1 to displace meningeal ECs (ECMen) that cross their path (bottom panels). Push-pull signals (including Sema3C and VEGF) prevent disruptive interactions and instruct alignment. Loss of EC repulsion in Plxnd1 mutants results in unrestricted attraction to MNs and unmasks inhibitory vascular signals that obstruct axonal projection. In addition, vessels invade the MC. (Right) ECs detect Sema3C via Plexin-D1 in complex with NRPs. This repulsive pathway operates in parallel to VEGF/VEGFR2 attractive signaling. Conversely, ECs express both repellents and adhesive factors that signal to MNs. Scale bars: 200 μm in (F)–(I′); 100 μm in (J)–(M′); and 100 μm in (P)–(S). See also Figure S7.

References

    1. Amin ND, Bai G, Klug JR, Bonanomi D, Pankratz MT, Gifford WD, Hinckley CA, Sternfeld MJ, Driscoll SP, Dominguez B, et al. (2015). Loss of motoneuron-specific microRNA-218 causes systemic neuromuscular failure. Science 350, 1525–1529. - PMC - PubMed
    1. Amin ND, Senturk G, Costaguta G, Driscoll S, O’Leary B, Bonanomi D, and Pfaff SL (2021). A hidden threshold in motor neuron gene networks revealed by modulation of miR-218 dose. Neuron 109, 3252–3267.e6. - PMC - PubMed
    1. Andreone BJ, Lacoste B, and Gu C (2015). Neuronal and vascular interactions. Annu. Rev. Neurosci 38, 25–46. - PMC - PubMed
    1. Antipenko A, Himanen JP, van Leyen K, Nardi-Dei V, Lesniak J, Barton WA, Rajashankar KR, Lu M, Hoemme C, Püschel AW, et al. (2003). Structure of the semaphorin-3A receptor binding module. Neuron 39, 589–598. - PubMed
    1. Bai G, Chivatakarn O, Bonanomi D, Lettieri K, Franco L, Xia C, Stein E, Ma L, Lewcock JW, and Pfaff SL (2011). Presenilin-dependent receptor processing is required for axon guidance. Cell 144, 106–118. - PMC - PubMed

Publication types