. 2022 Oct 27;185(22):4216-4232.e16.
doi: 10.1016/j.cell.2022.09.031. Epub 2022 Oct 13.

En masse organoid phenotyping informs metabolic-associated genetic susceptibility to NASH

Affiliations

En masse organoid phenotyping informs metabolic-associated genetic susceptibility to NASH

Masaki Kimura et al. Cell. .

Abstract

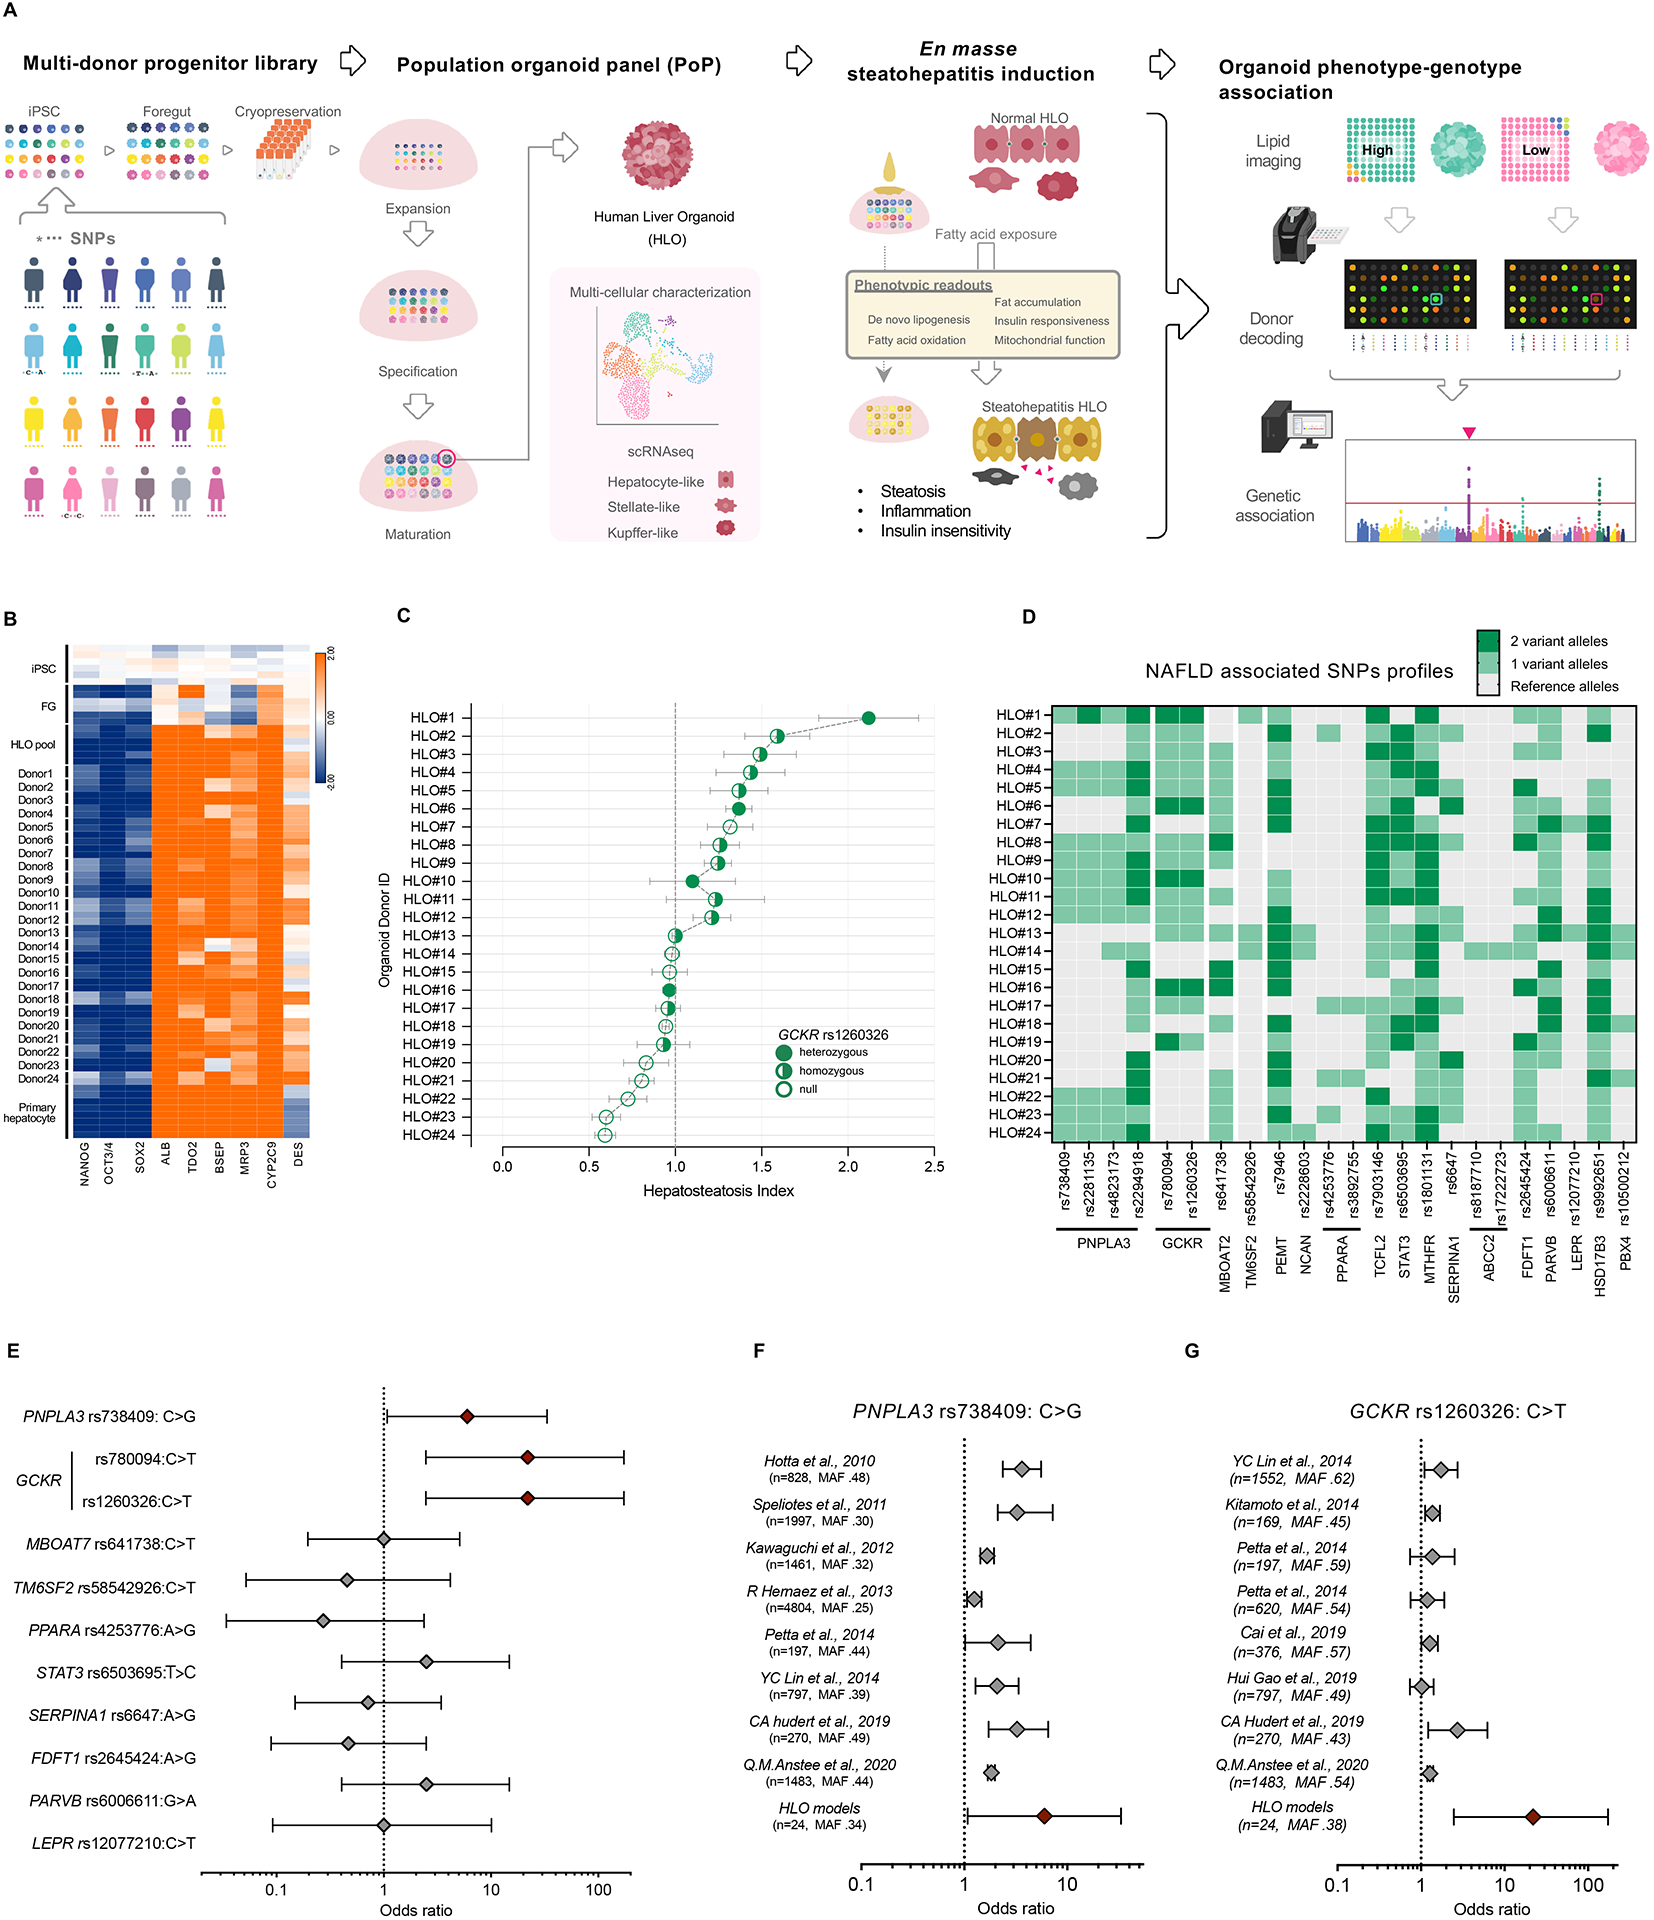
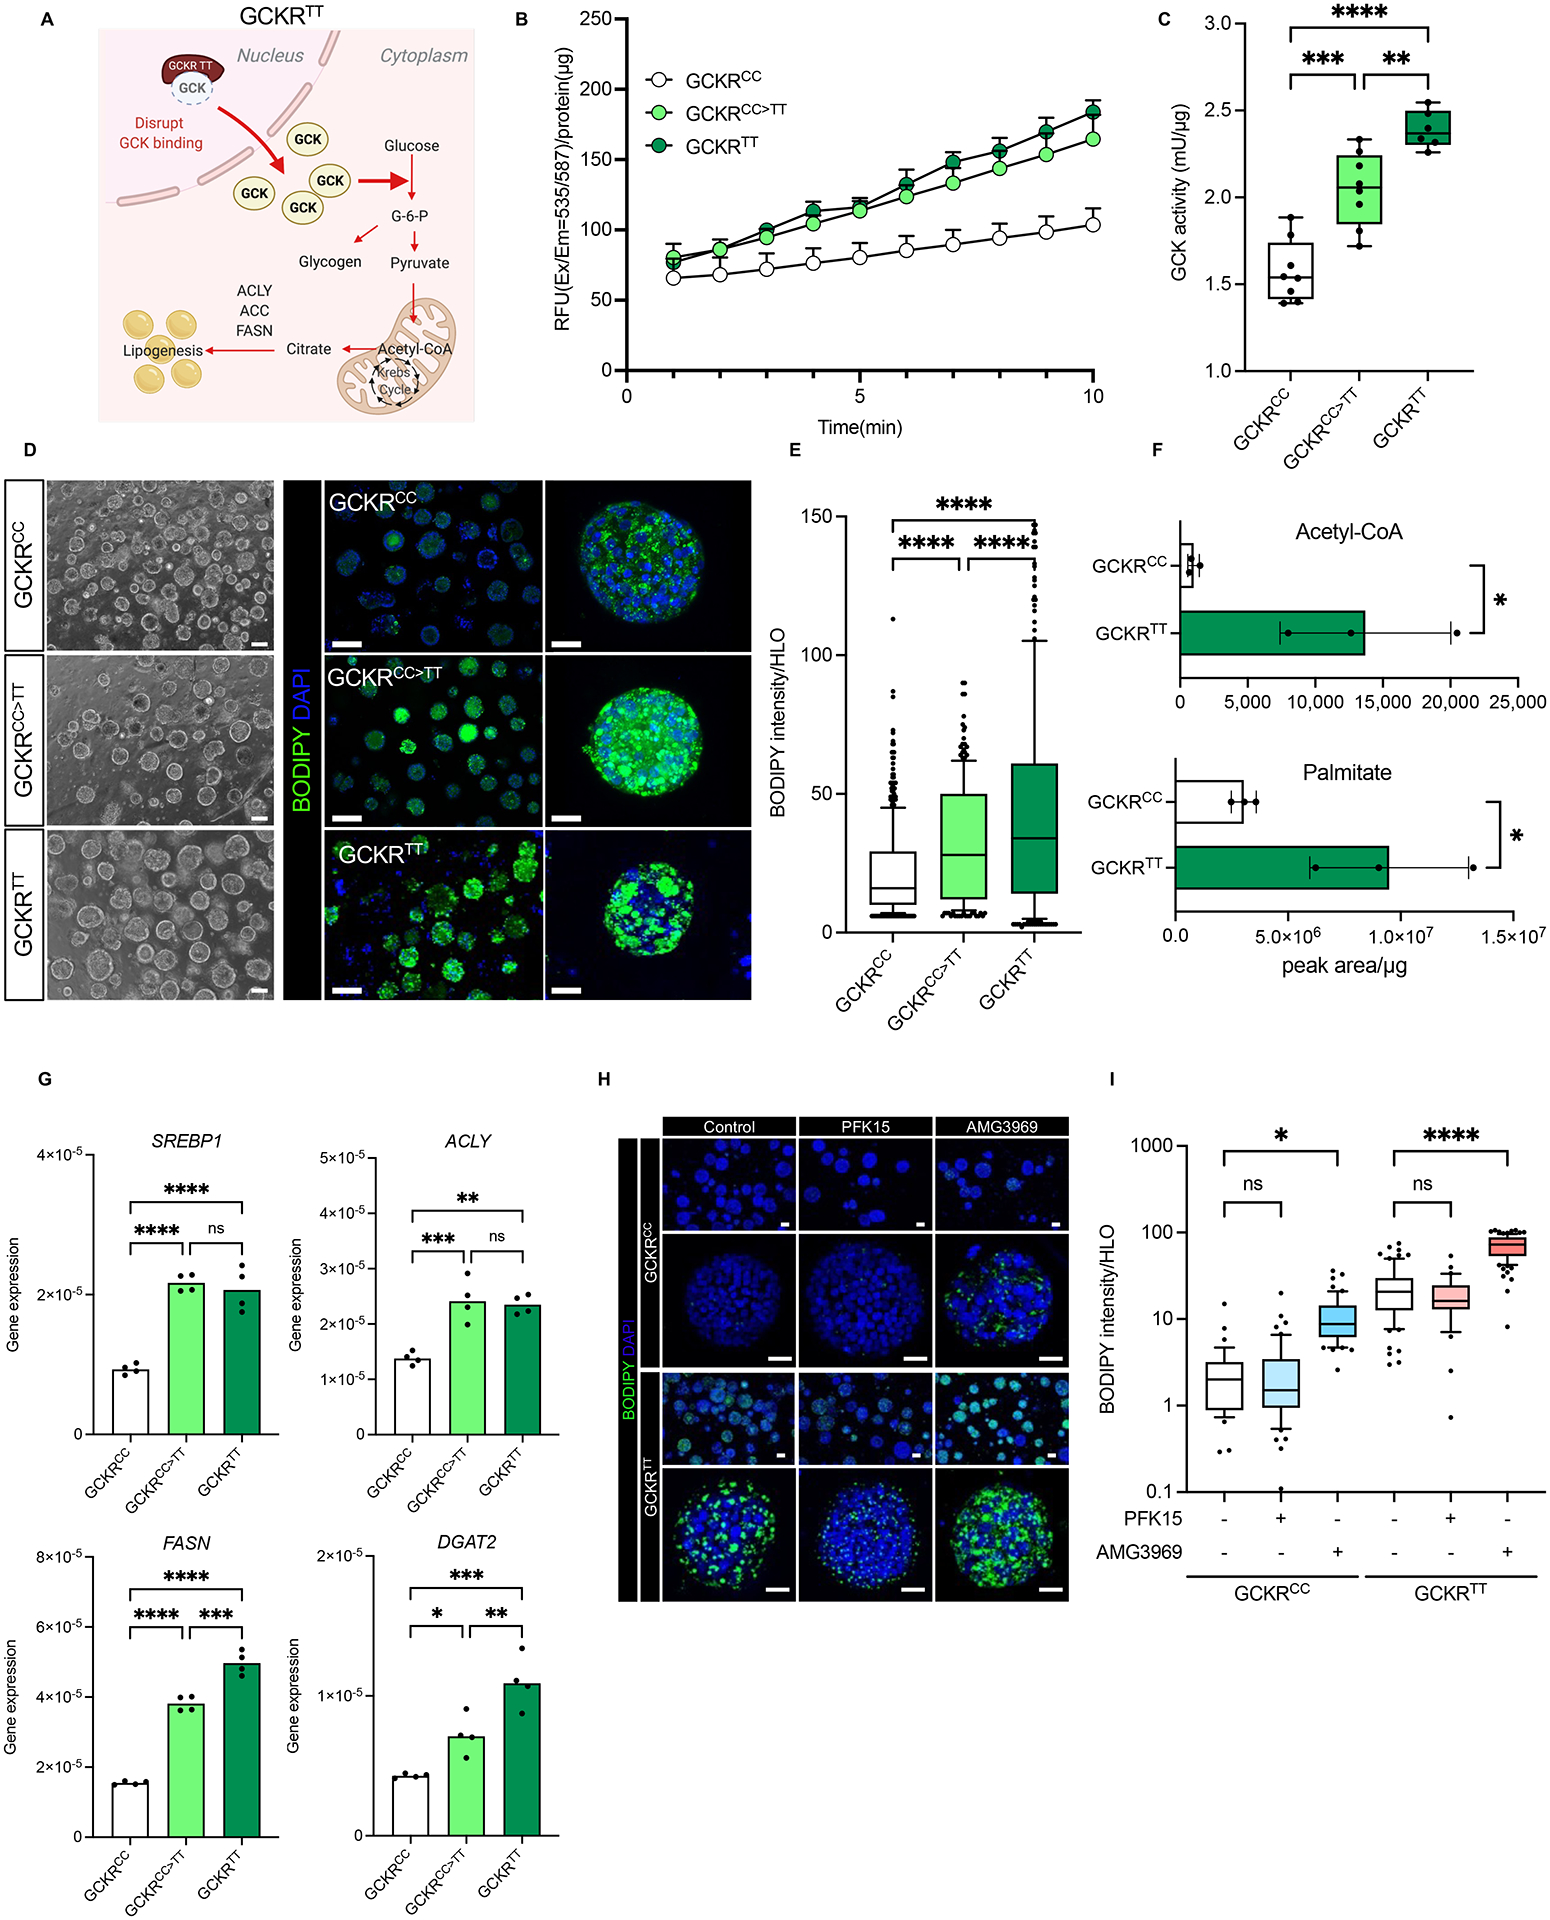
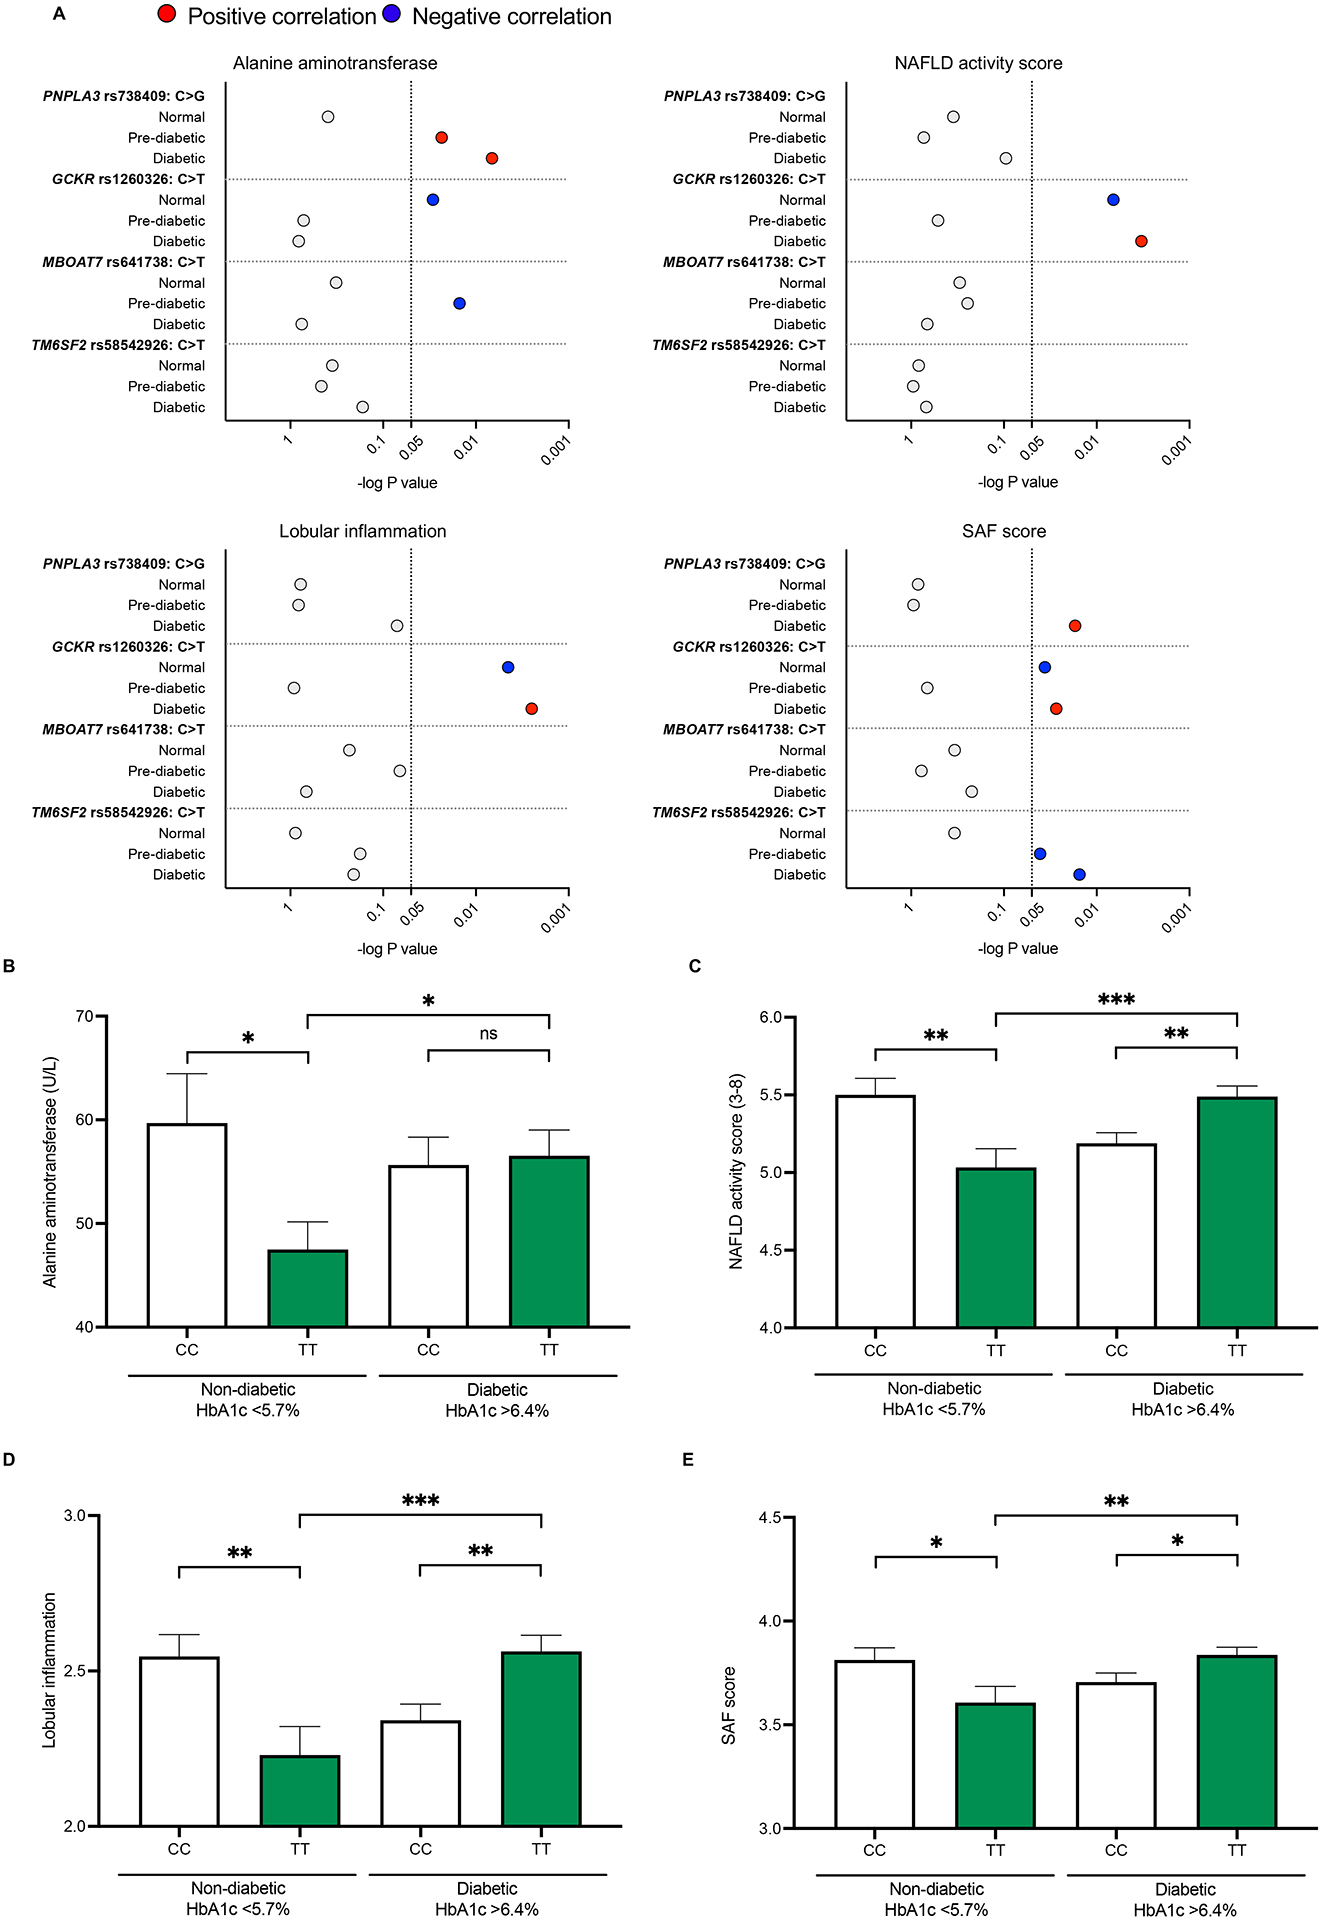
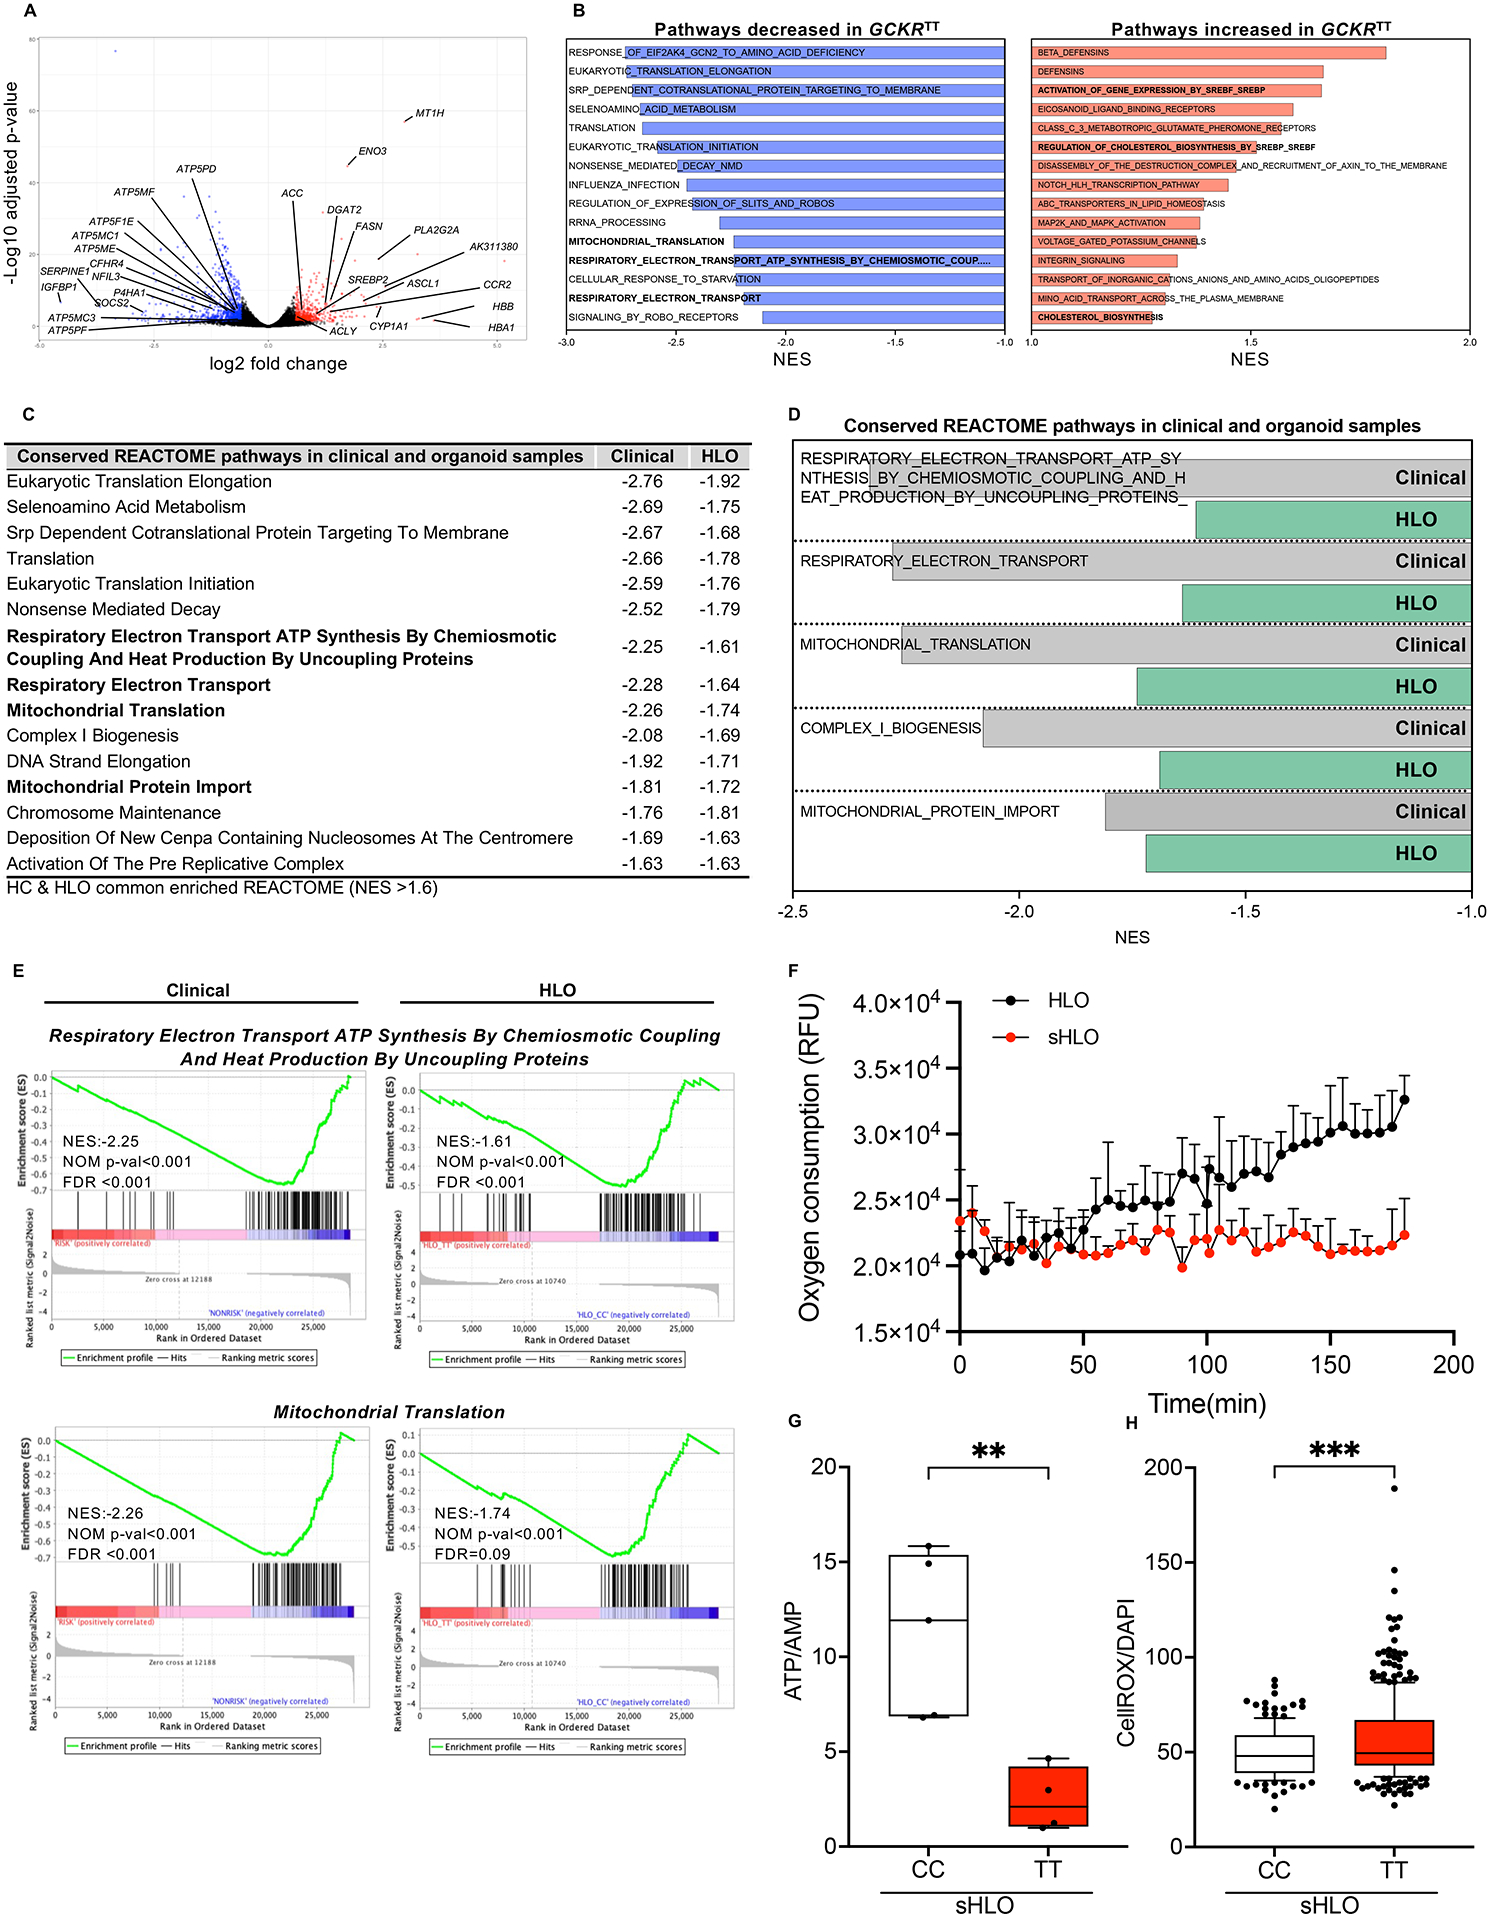
Genotype-phenotype associations for common diseases are often compounded by pleiotropy and metabolic state. Here, we devised a pooled human organoid-panel of steatohepatitis to investigate the impact of metabolic status on genotype-phenotype association. En masse population-based phenotypic analysis under insulin insensitive conditions predicted key non-alcoholic steatohepatitis (NASH)-genetic factors including the glucokinase regulatory protein (GCKR)-rs1260326:C>T. Analysis of NASH clinical cohorts revealed that GCKR-rs1260326-T allele elevates disease severity only under diabetic state but protects from fibrosis under non-diabetic states. Transcriptomic, metabolomic, and pharmacological analyses indicate significant mitochondrial dysfunction incurred by GCKR-rs1260326, which was not reversed with metformin. Uncoupling oxidative mechanisms mitigated mitochondrial dysfunction and permitted adaptation to increased fatty acid supply while protecting against oxidant stress, forming a basis for future therapeutic approaches for diabetic NASH. Thus, "in-a-dish" genotype-phenotype association strategies disentangle the opposing roles of metabolic-associated gene variant functions and offer a rich mechanistic, diagnostic, and therapeutic inference toolbox toward precision hepatology. VIDEO ABSTRACT.

Keywords: GCKR-rs1260326; NASH; de novo lipogenesis; genotype-phenotype association; human liver organoid; iPSC; mitochondrial dysfunction; population organoid panel.


Conflict of interest statement

Declaration of interests R.P.M., G.M.S., and T.T. are equity holders for The Liver Company, inc. M.Kimura and T.T. are co-inventors for the technology disclosed in the manuscript.

Figures

Figure 1.
Figure 1.. A steatohepatitis organoid panel informs known genotype-phenotype associations for hepatic steatosis.
(A) Schematic diagram of the developing genetically diverse population organoid panel (PoP). A mixture of cryopreserved foregut progenitors from multiple donors enabled parallel and clonal production of multicellular human liver organoids. Oleic acid (OA) treatment induces steatohepatitis phenotype. PoP based genotype-phenotype association analysis was performed en masse. (B) Transcriptome analysis of HLOs from 24 donors. (C) Graph shows the mean ± sem of hepatosteatosis index in each donor determined by fluorescent-guided PoP steatosis screening. SNP rs1260326 zygosity is as indicated. (D) SNP genotype profiles associated with NAFLD in the 24 donors of PoP. Dark green indicates 2 variant alleles, light green indicates 1 variant allele. (E) The odds ratios (ORs) for the 24-donor sHLO model, based on the fat accumulation phenotype. The OR was calculated for major NAFLD-related SNPs. Error bars represent 95% confidence intervals. (F) Comparison of diagnostic odds ratios in clinical trials to odds ratios of HLO models for PNPLA3-rs738409. The sample size (n) and minor allele frequency (MAF), as indicated. (G) Comparison of diagnostic odds ratios in clinical trials to odds ratios of HLO models for GCKR-rs1260326.
Figure 2.
Figure 2.. GCKR-rs1260326 TT genotype confers susceptibility to de novo lipid accumulation in HLO.
(A) Schematic diagram of GCKR variant association with glucokinase (GCK). GCKR functions as an inhibitor of GCK in the liver. The TT variant of GCKR-rs1260326 has a reduced ability to bind GCK and is less effective in suppressing GCK activities. (B) The time-course dynamics of GCK activity in HLOs carrying GCKRCC, GCKRCC>TT (gene-edited), GCKRTT. Data are shown as means ± SD (error bars), n=4. (C) Measurement of GCK activity in GCKRCC, GCKRCC>TT, and GCKRTT-HLOs. Data are shown as mean ± SD (Error bars), n=4, in triplicate. Unpaired t-test; **p < 0.01, ***p < 0.001, ****p < 0.0001. (D) Representative images of de novo lipid accumulation in GCKRCC, GCKRCC>TT, and GCKRTT-HLOs. Images were stained with BODIPY for fat accumulation (Green) and Hoechst 33342 for the nucleus (Blue). Scale bars, low magnification: 300μm, high magnification: 50μm. (E) Quantification of de novo lipid accumulation in GCKRCC, GCKRCC>TT, and GCKRTT-HLOs. The intensity of lipid was normalized to nuclear signals (mean ± SD, n = 8 independent experiments). Unpaired t-test; ****p < 0.0001. (F) Mass-spec analysis of protein content-normalized levels of acetyl-CoA and palmitate in HLOs. Data are shown as mean ± SD (Error bars), n=3, Unpaired t-test; *p < 0.05. (G) Comparison of lipogenesis-associated gene expression in GCKRCC, GCKRCC>TT, and GCKRTT-HLOs. Data are shown as means ± SD. (error bars), n=4–8. Unpaired t-test; *p < 0.05, **p < 0.01, ***p < 0.001, ***p < 0.0001. (H) Imaging of de novo lipid accumulation in GCKRCC and GCKRTT-HLOs, treated with PFKFB3 inhibitor (PFK15), and GCK-GCKR disruptor (AMG3969). Images were stained with BODIPY for fat accumulation and Hoechst 33342 for the nucleus. Scale bars, low magnification: 100μm, high magnification: 50μm. (I) Quantification of de novo lipid accumulation in GCKRCC and GCKRTT HLOs treated with PFK15 or AMG3969. The intensity of lipid was normalized to nuclear signals (mean ± SD, n = 8 independent experiments). Unpaired t-test; *p < 0.05, ****p < 0.0001.
Figure 3.
Figure 3.. GCKR-rs1260326 TT genotype confers inverse risk for inflammation dependent on HbA1c levels.
Impact of HbA1c values (normal, <5.7%, versus diabetic, >6.4%) on clinical measurements (see Table 1), graphically depicted. (A) Red and blue dots indicate significant differences. Coloring shows NAFLD exacerbating (red), and protective (blue) associations. The scale of the x-axis corresponds to the P value in the log10 scale for each SNP genotype. The dashed vertical line indicates p= 0.05. (B-E) NAFLD phenotype associated with GCKR-rs1260326 genotype: (B) ALT measurements; (C) NAFLD activity score (NAS); (D) Lobular inflammation scores; and (E) SAF score.
Figure 4.
Figure 4.. Comparative clinical and organoid transcriptomic signatures associated with GCKR-rs1260326.
(A) Volcano plot of differentially expressed gene (DEGs) analysis (edge R) in primary NASH hepatocytes comparing GCKRTT to CC variants. Fold change >1.5, P-value <0.05. (B) Unbiased gene set enrichment analysis (GSEA). REACTOME pathways up-regulated and down-regulated in primary NASH hepatocytes, GCKRTT relative to GCKRCC. Normalized enrichment scores (NES) are presented in descending order. (C) Conserved GSEA-REACTOME pathways in primary NASH hepatocytes (clinical samples) and HLOs (GCKRTT relative to GCKRCC). NES less than −1.6 are shown. (D) Conserved GSEA-REACTOME mitochondrial-related pathways in clinical (primary NASH hepatocytes) and HLO models. (E) Enrichment plots of selected gene-expression profiles based on GSEA-REACTOME evaluations. (F) Oxygen consumption rate (OCR) analysis (Extracellular Oxygen Consumption Assay, a fluorescence-based assay) of GCKRTT-HLO and -sHLO. Data are shown as means ± SD. (error bars), n=3. (G) The ratio of ATP/AMP of GCKRTT and GCKRCC-sHLO was analyzed by NMR (nuclear magnetic resonance) spectroscopy. Data are shown as means ± SD (error bars), n for GCKRCC-HLO = 5, n for GCKRTT-HLO =4 donors. Unpaired t-test; **p < 0.01. (H) Quantifications of reactive oxidant species (ROS) production in GCKRTT-sHLOs versus GCKRCC-sHLOs. ROS production was detected with CellROX live staining and Hoechst 33342 for the nucleus. The intensity of ROS was normalized to nuclear signals. Analysis was performed in >50 organoids per line, three independent experiments. Unpaired t-test; ***p < 0.001.
Figure 5.
Figure 5.. Mitochondrial dysregulation is associated with GCKR-rs1260326 related metabolic assaults.
(A) Oxygen consumption rate (OCR) analysis of GCKRTT-HLO (white), -sHLO (gray), and -sHLO treated with nicotinamide riboside (NR), nitazoxanide (NTZ) combination (green). Data are shown as means ± SD (error bars), n=3, Unpaired t-test; *p < 0.05, **p < 0.01. (B) NAD+/NADH ratios in GCKRTT-sHLO treated with NR, NTZ, or combination. (C) Representative images of ROS production in GCKRTT-HLO, -sHLO (FFA treated), and -sHLO treated with metformin (MET) or a combination of NR/NTZ. Images were stained with CellROX for ROS and Hoechst 33342 for the nucleus. Scale bars, 300μm. (D) Quantifications of ROS production in GCKRTT-HLO, -sHLO (FFA treated), and -sHLO treated with metformin (MET) or a combination of NR/NTZ. ROS production was detected with CellROX live staining and Hoechst 33342 for the nucleus. The intensity of ROS was normalized to nuclear signals. Analysis was performed in >50 organoids per line, three independent experiments. Unpaired t-test; ****p < 0.0001. (E) Lipogenic gene expression in GCKRTT-sHLO (FFA treated) and -sHLO treated with metformin (MET) or NR/NTZ combination were compared to GCKRTT-HLO. Data are shown as means ± SD normalized by internal standard 18S (error bars), n=4. Unpaired t-test; *p<0.05, **p<0.01. (F) Relative gene expressions of proinflammatory cytokine in GCKRTT-sHLO (FFA treated) and -sHLO treated with metformin (MET) or NR/NTZ combination, compared to GCKRTT-HLO, which was arbitrarily assigned a value of 1. Data are shown as means ± SD. (error bars), n=4. Unpaired t-test; *p < 0.05, **p < 0.01.

References

    1. Amireddy N, Puttapaka SN, Vinnakota RL, Ravuri HG, Thonda S, and Kalivendi SV (2017). The unintended mitochondrial uncoupling effects of the FDA-approved anti-helminth drug nitazoxanide mitigates experimental parkinsonism in mice. J Biol Chem 292, 15731–15743. - PMC - PubMed
    1. Anstee QM, Darlay R, Cockell S, Meroni M, Govaere O, Tiniakos D, Burt AD, Bedossa P, Palmer J, Liu YL, et al. (2020). Genome-wide association study of non-alcoholic fatty liver and steatohepatitis in a histologically characterised cohort(). J Hepatol 73, 505–515. - PubMed
    1. Beer NL, Tribble ND, McCulloch LJ, Roos C, Johnson PR, Orho-Melander M, and Gloyn AL (2009). The P446L variant in GCKR associated with fasting plasma glucose and triglyceride levels exerts its effect through increased glucokinase activity in liver. Hum Mol Genet 18, 4081–4088. - PMC - PubMed
    1. Belalcazar LM, Papandonatos GD, Erar B, Peter I, Alkofide H, Balasubramanyam A, Brautbar A, Kahn SE, Knowler WC, Ballantyne CM, et al. (2016). Lifestyle Intervention for Weight Loss and Cardiometabolic Changes in the Setting of Glucokinase Regulatory Protein Inhibition: Glucokinase Regulatory Protein-Leu446Pro Variant in Look AHEAD. Circ Cardiovasc Genet 9, 71–78. - PMC - PubMed
    1. Bellentani S, Scaglioni F, Marino M, and Bedogni G (2010). Epidemiology of non-alcoholic fatty liver disease. Dig Dis 28, 155–161. - PubMed

Publication types