. 2022 Oct 27;185(22):4170-4189.e20.
doi: 10.1016/j.cell.2022.09.008. Epub 2022 Oct 14.

Gut-innervating nociceptors regulate the intestinal microbiota to promote tissue protection

Affiliations

Gut-innervating nociceptors regulate the intestinal microbiota to promote tissue protection

Wen Zhang et al. Cell. .

Abstract

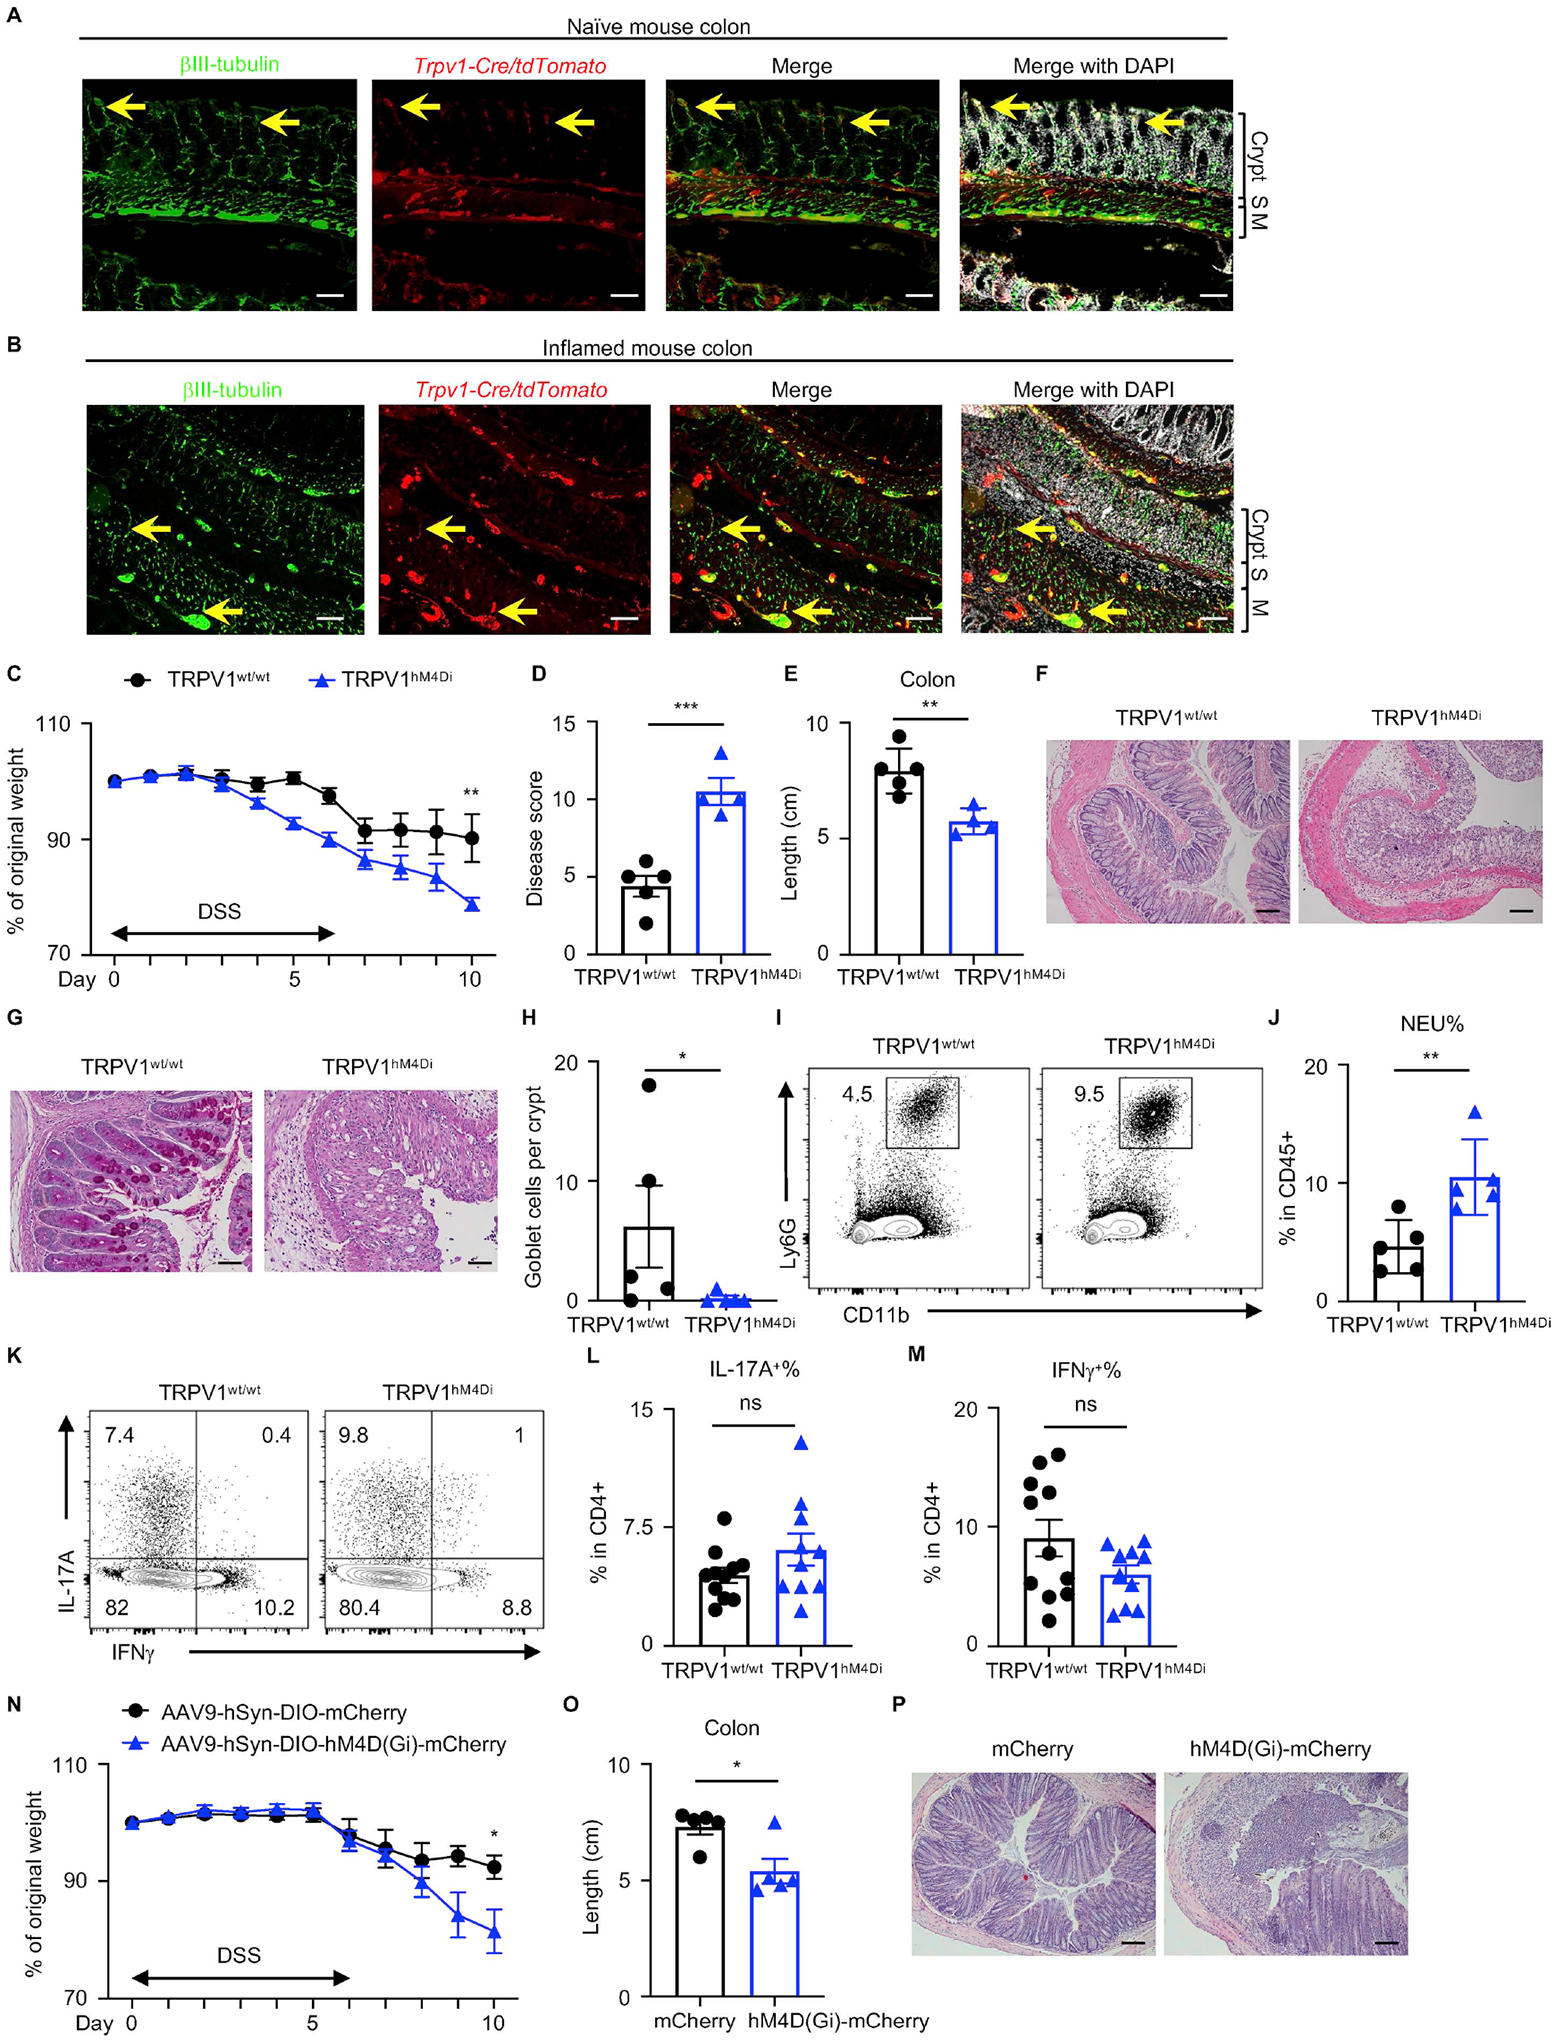
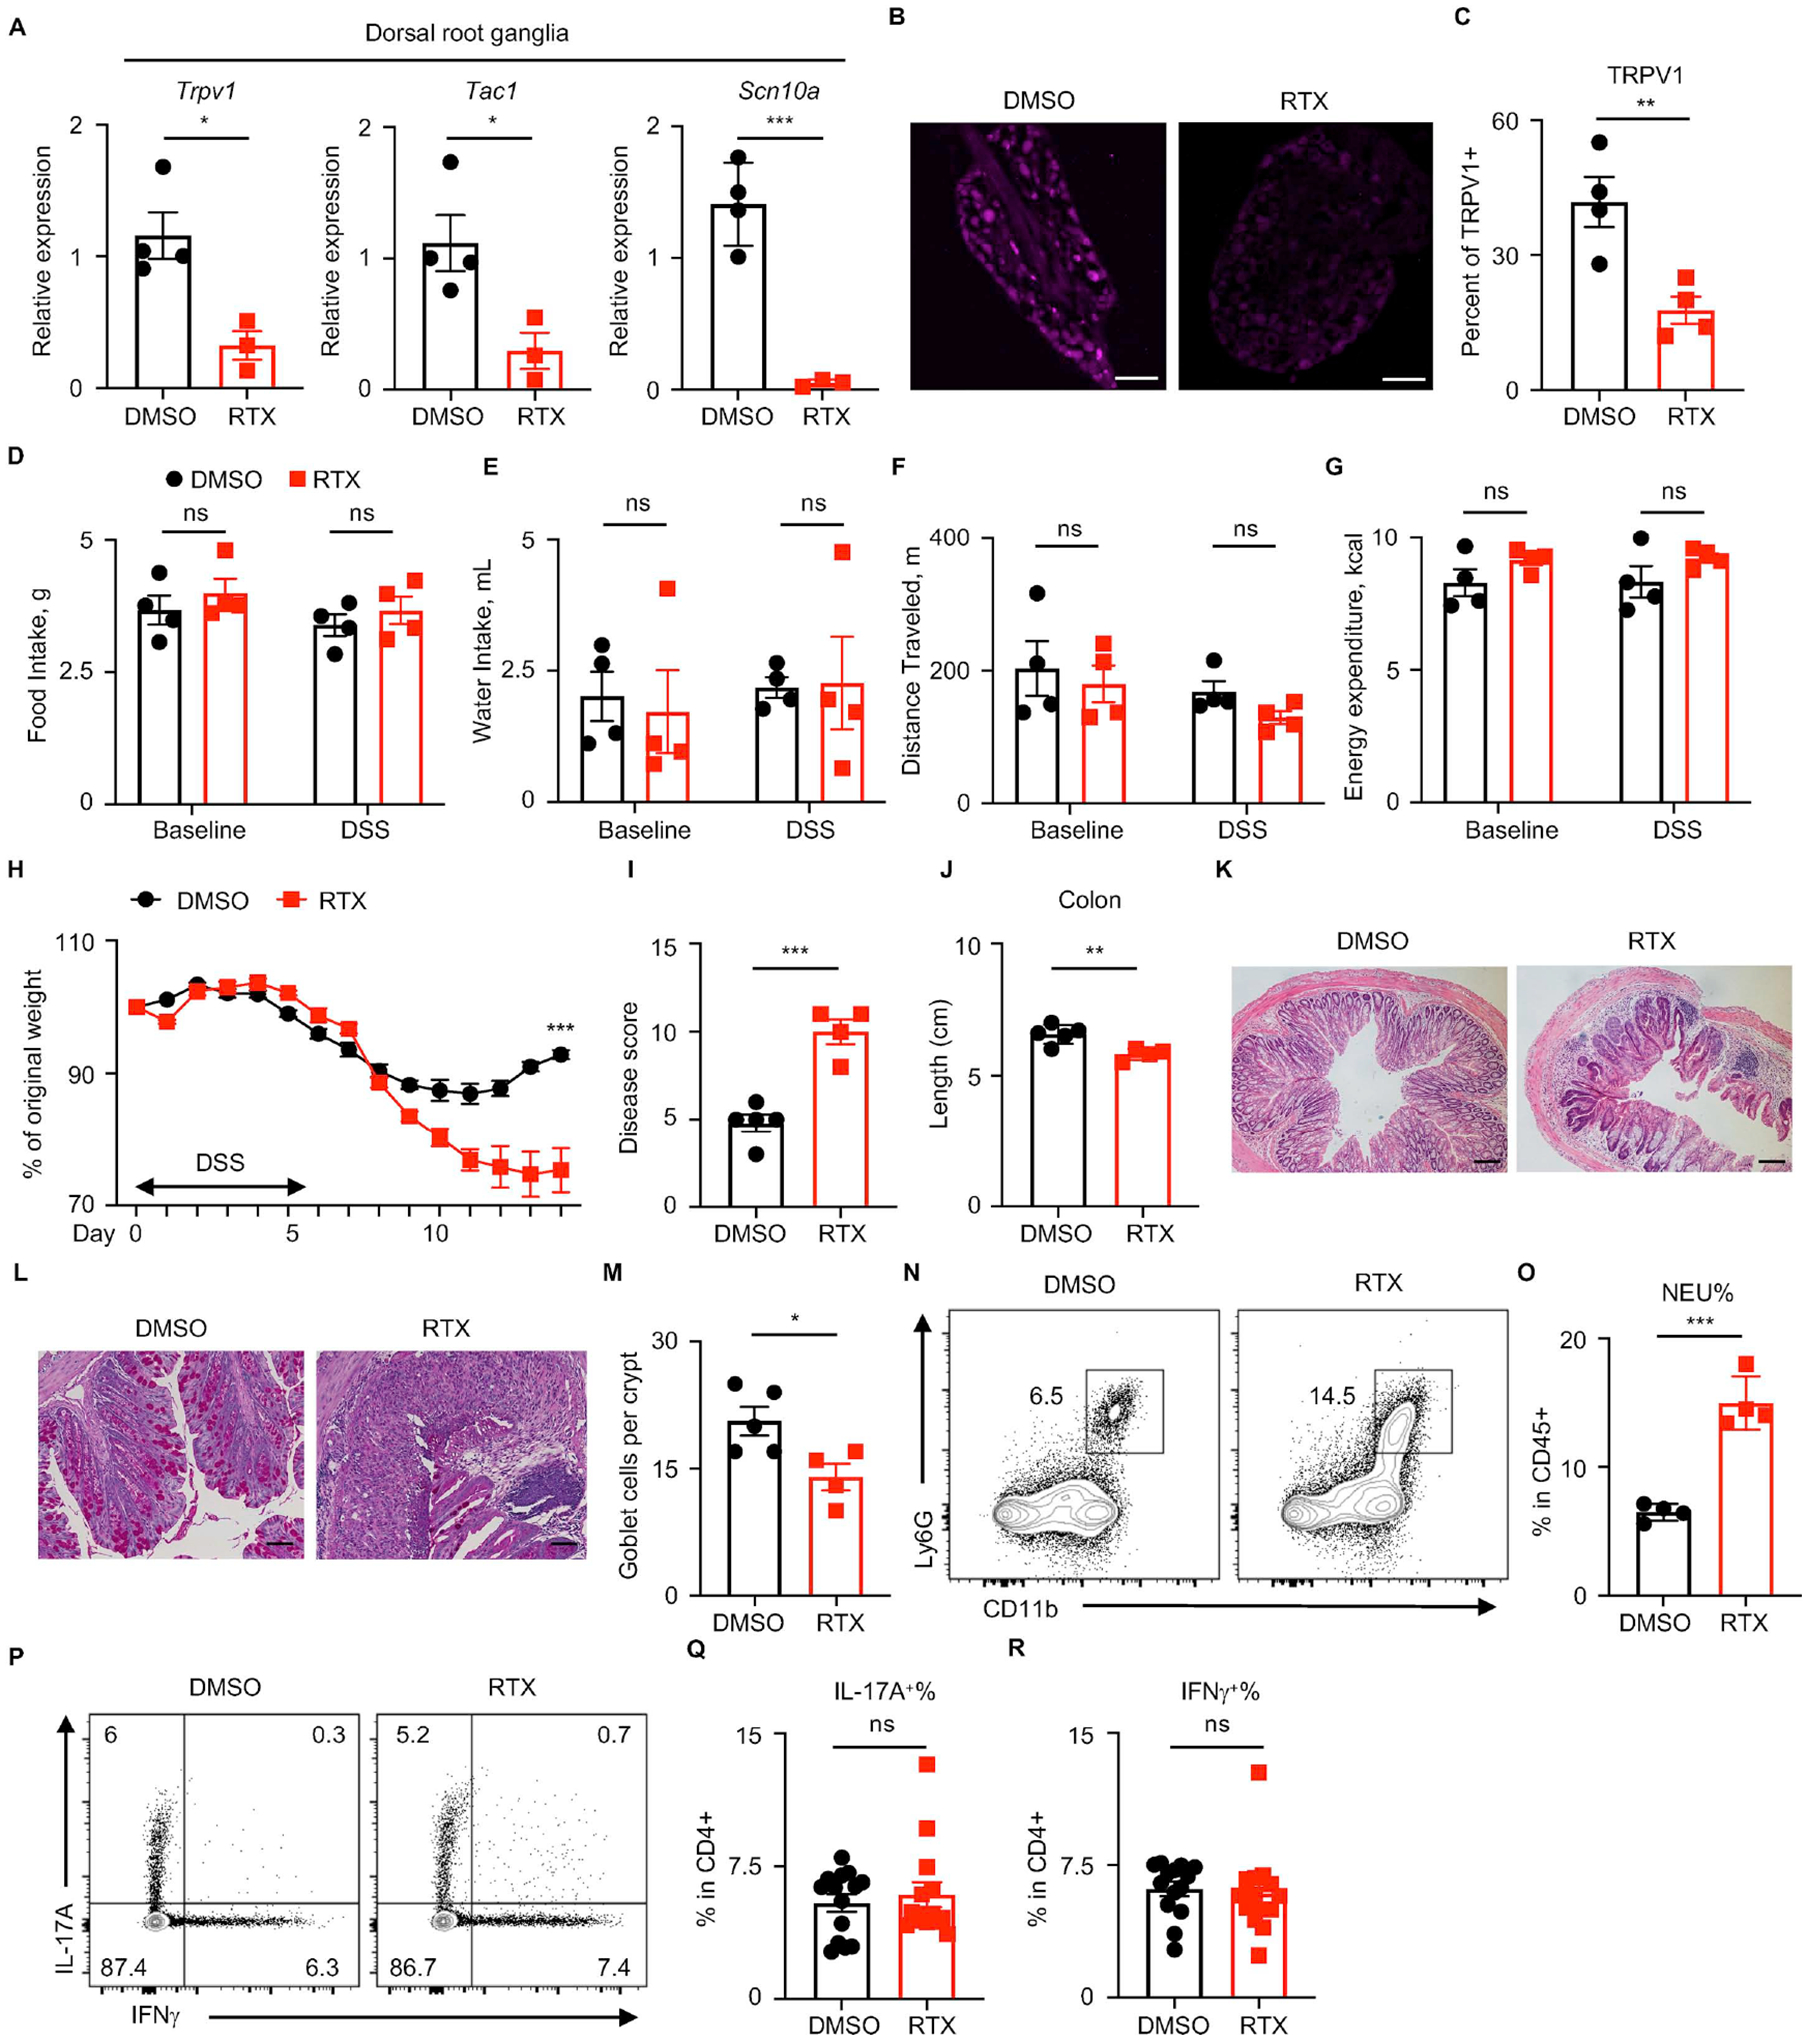
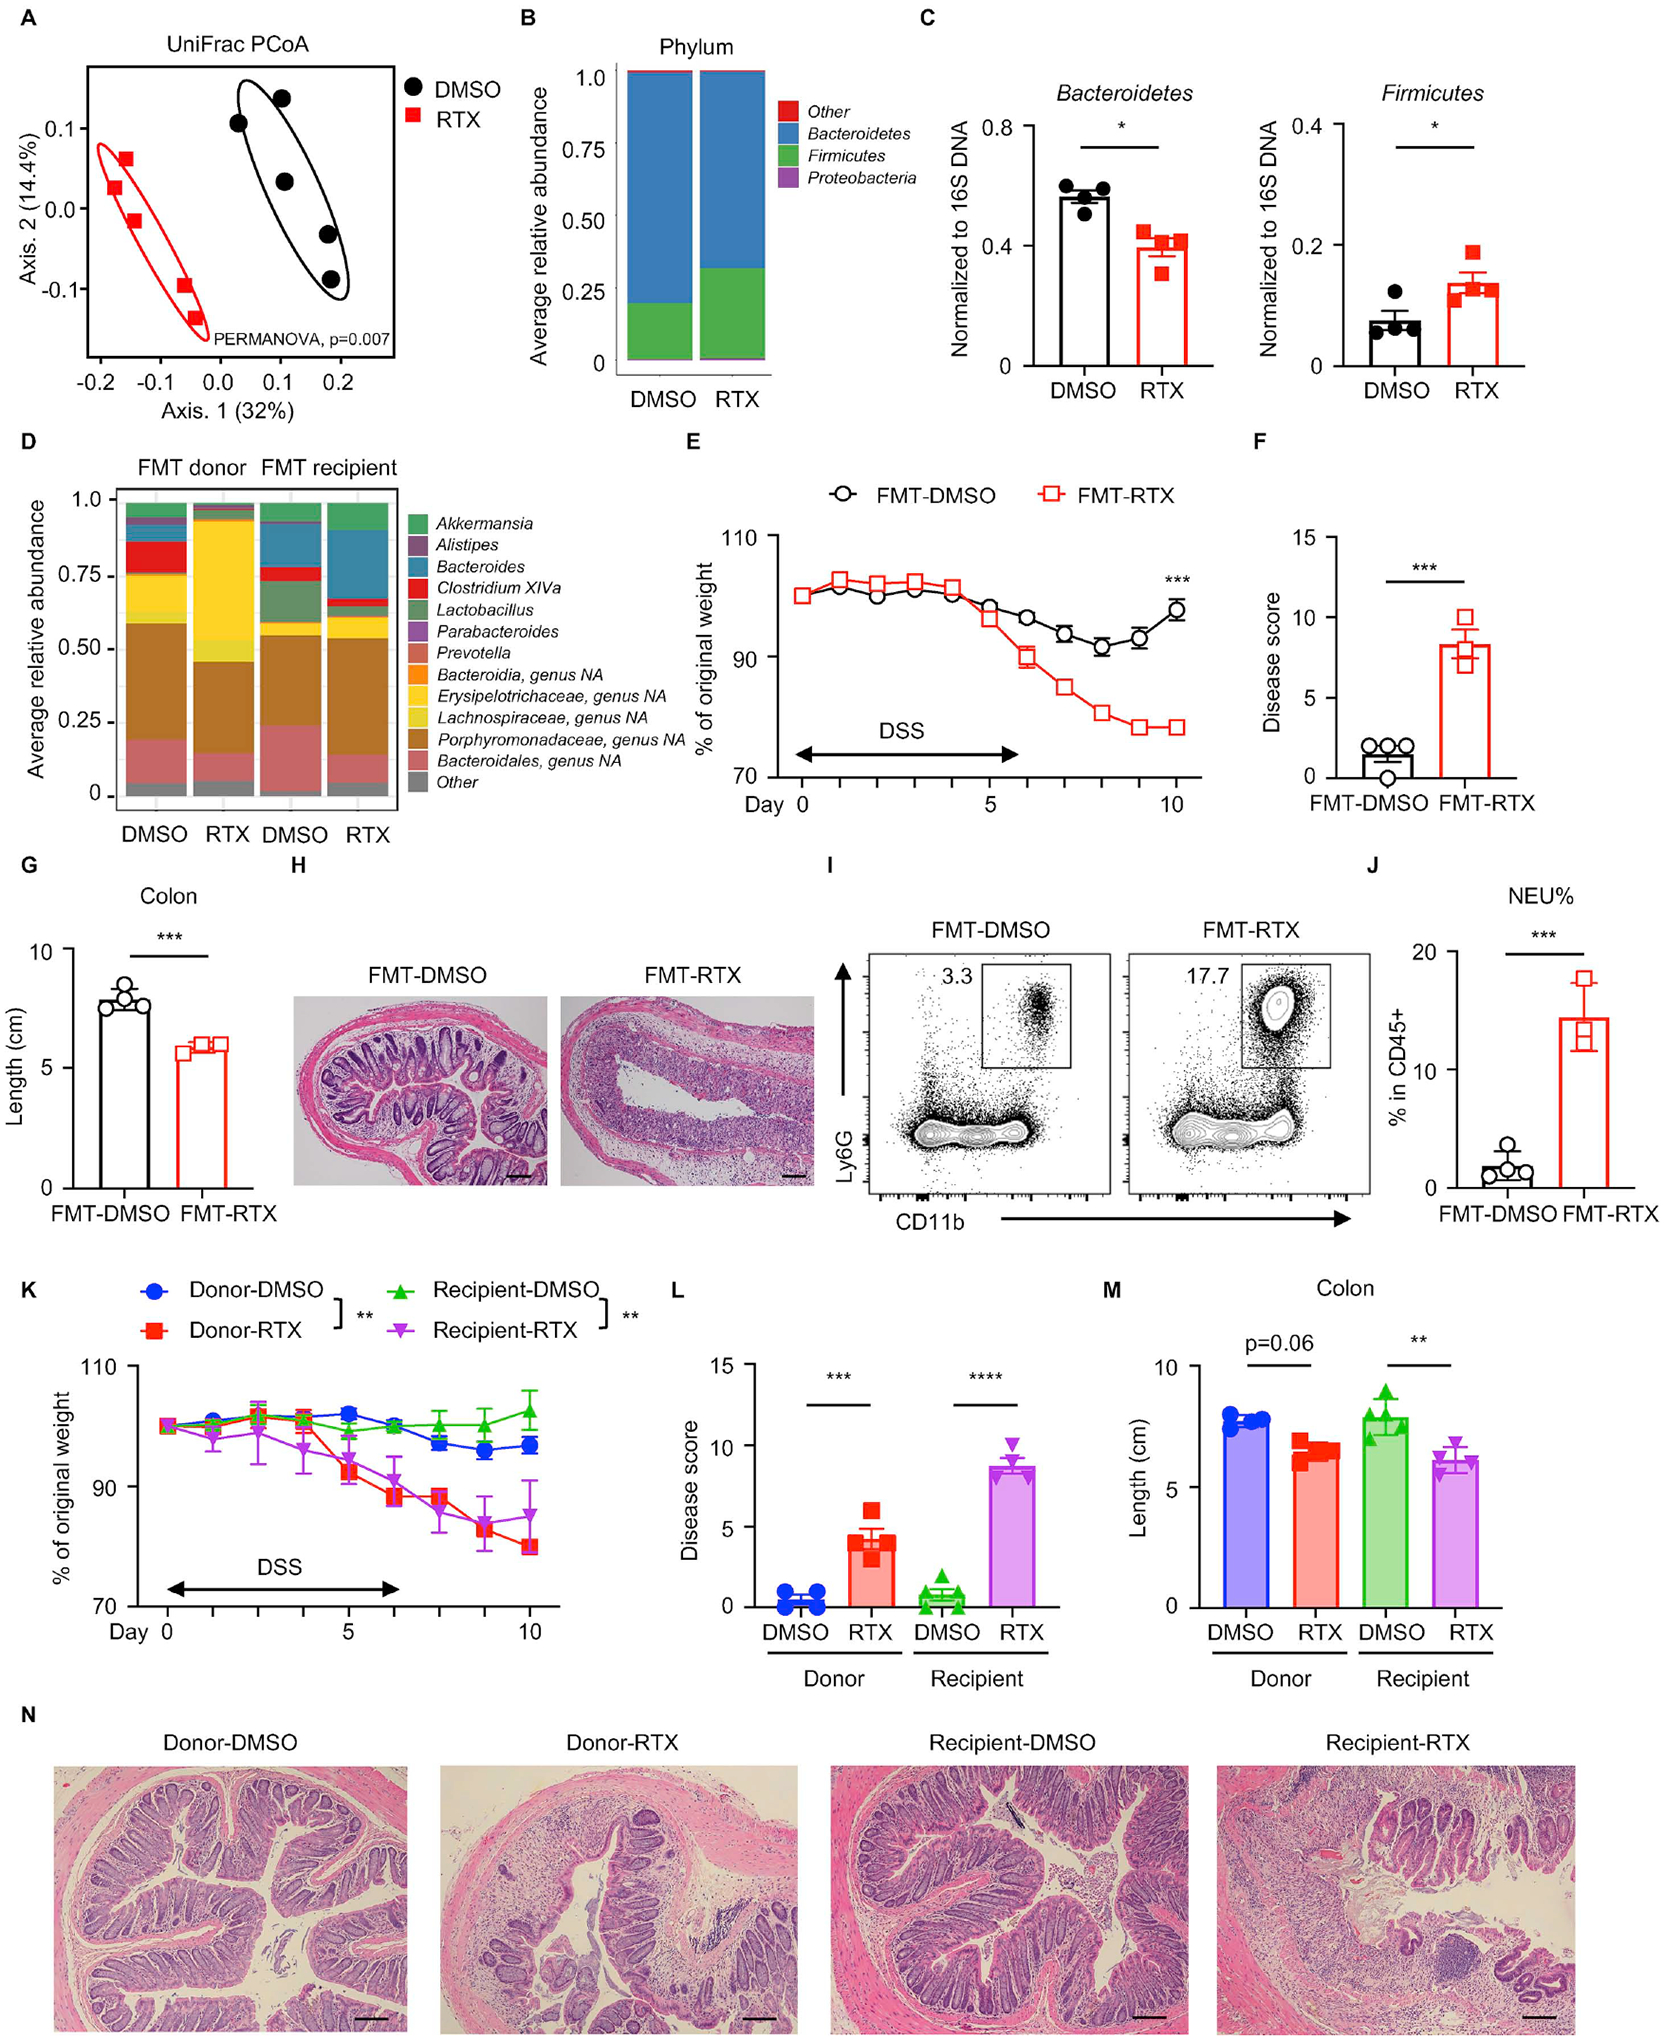
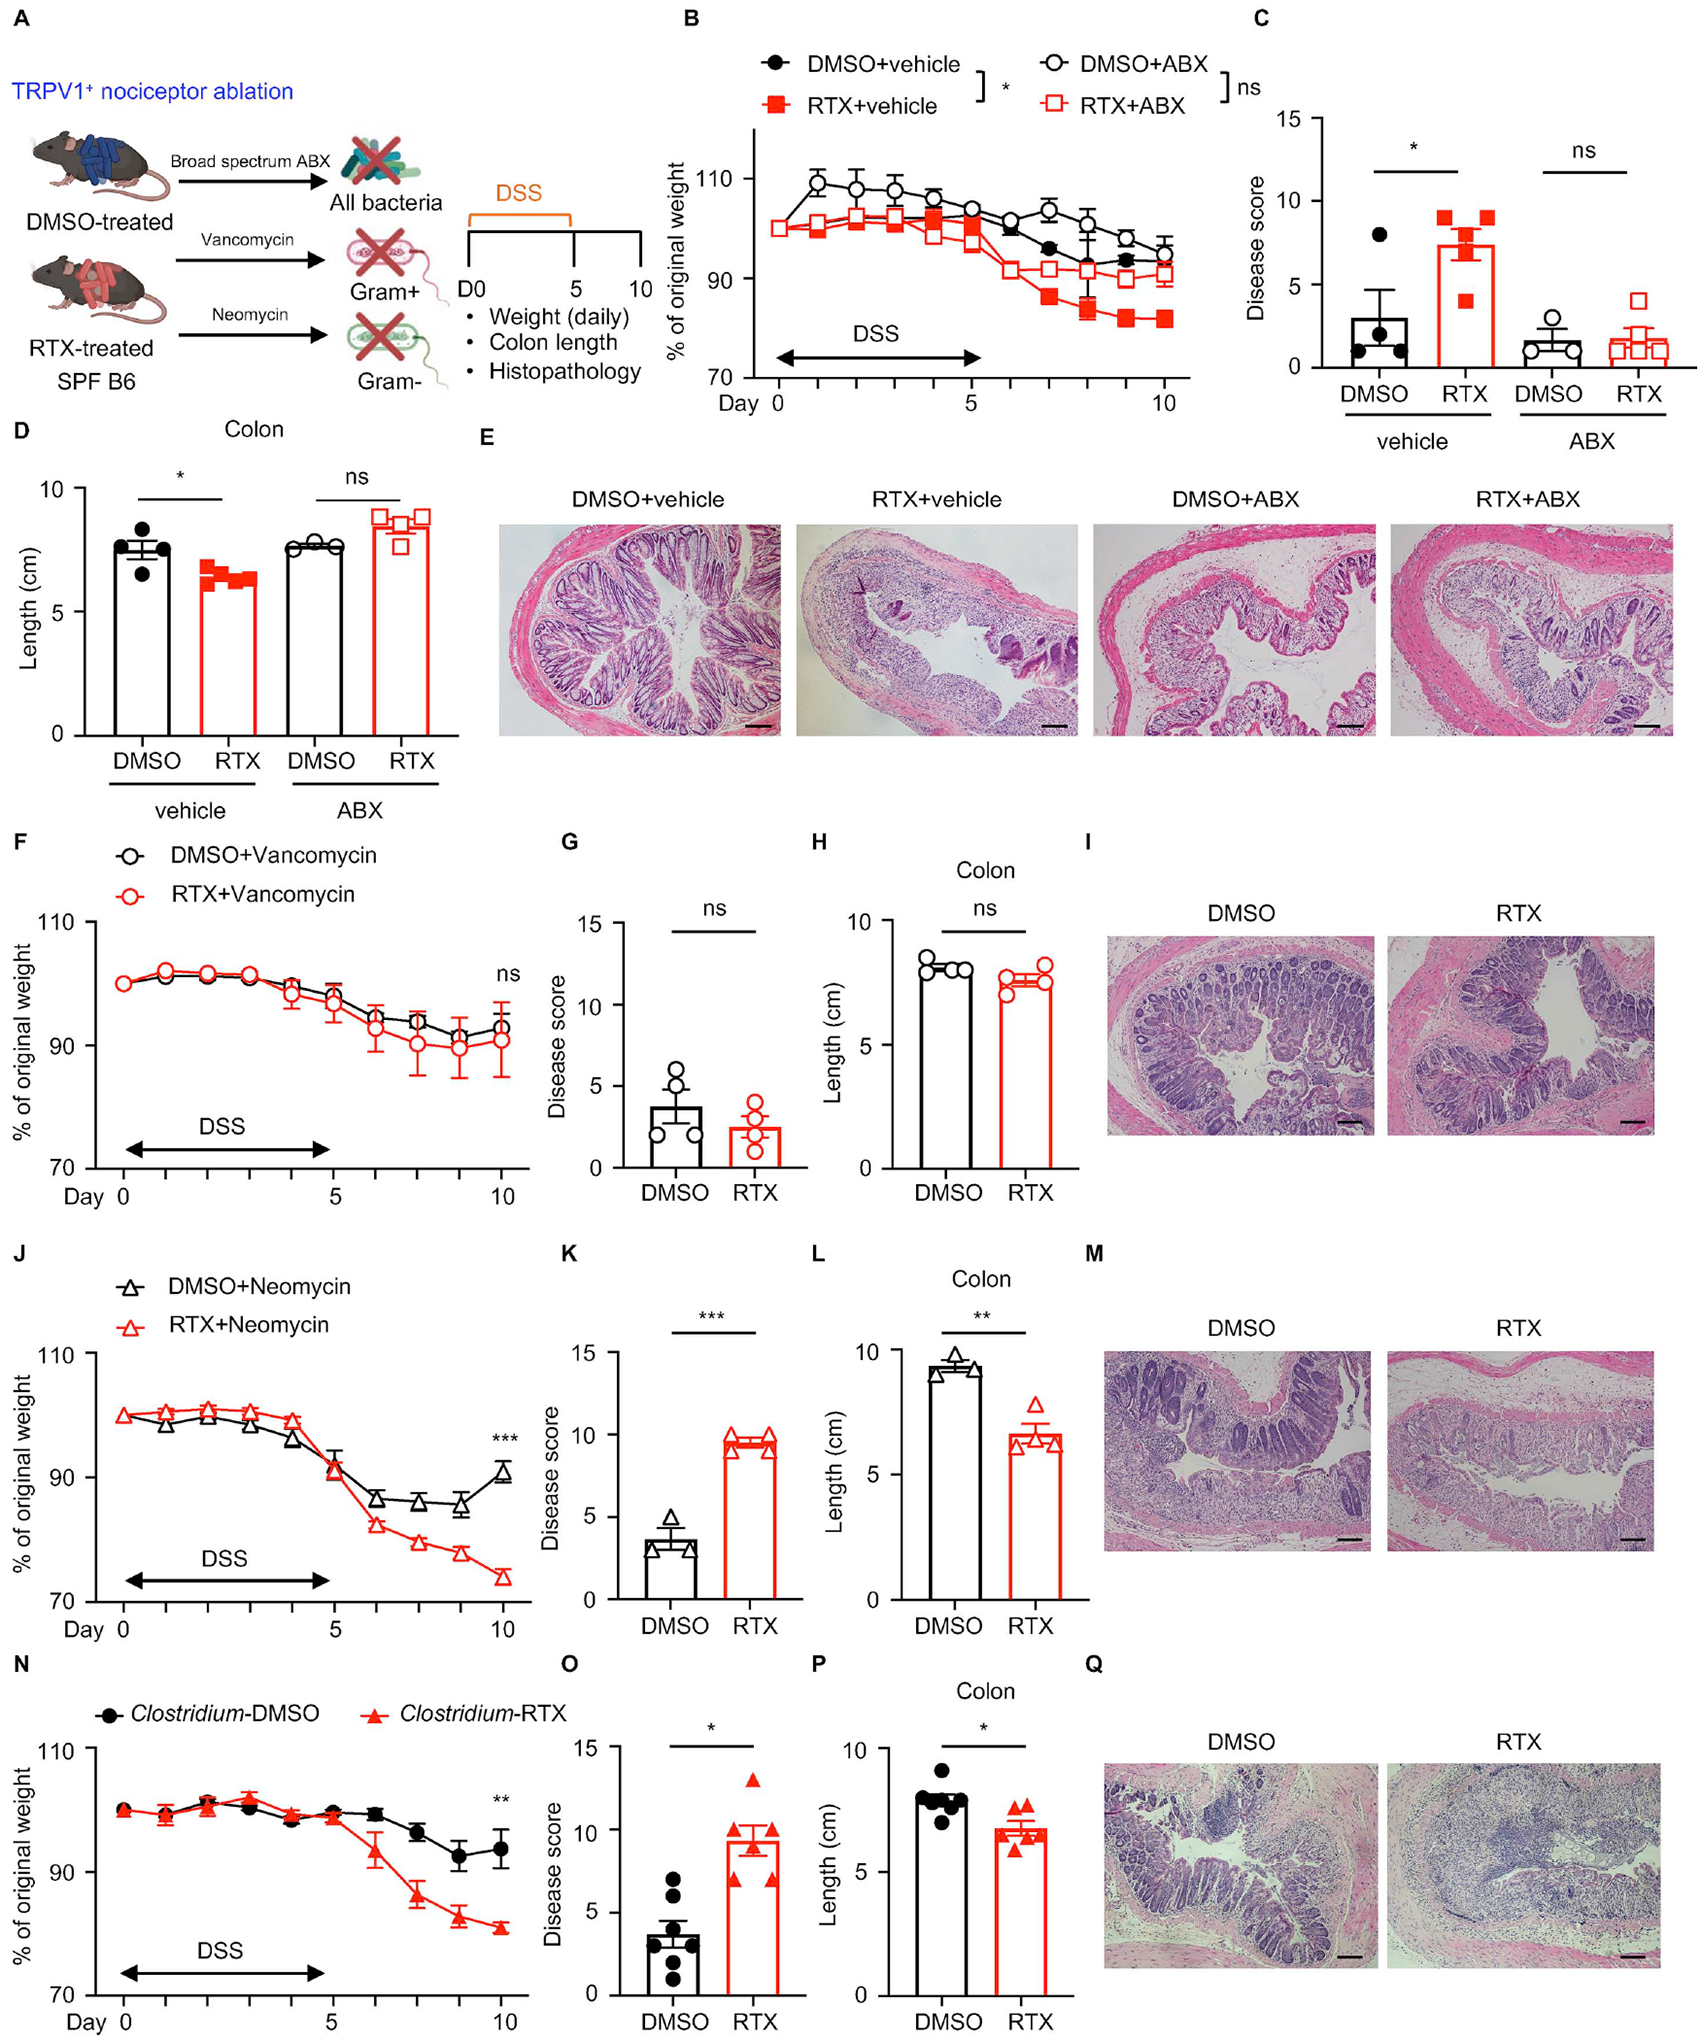
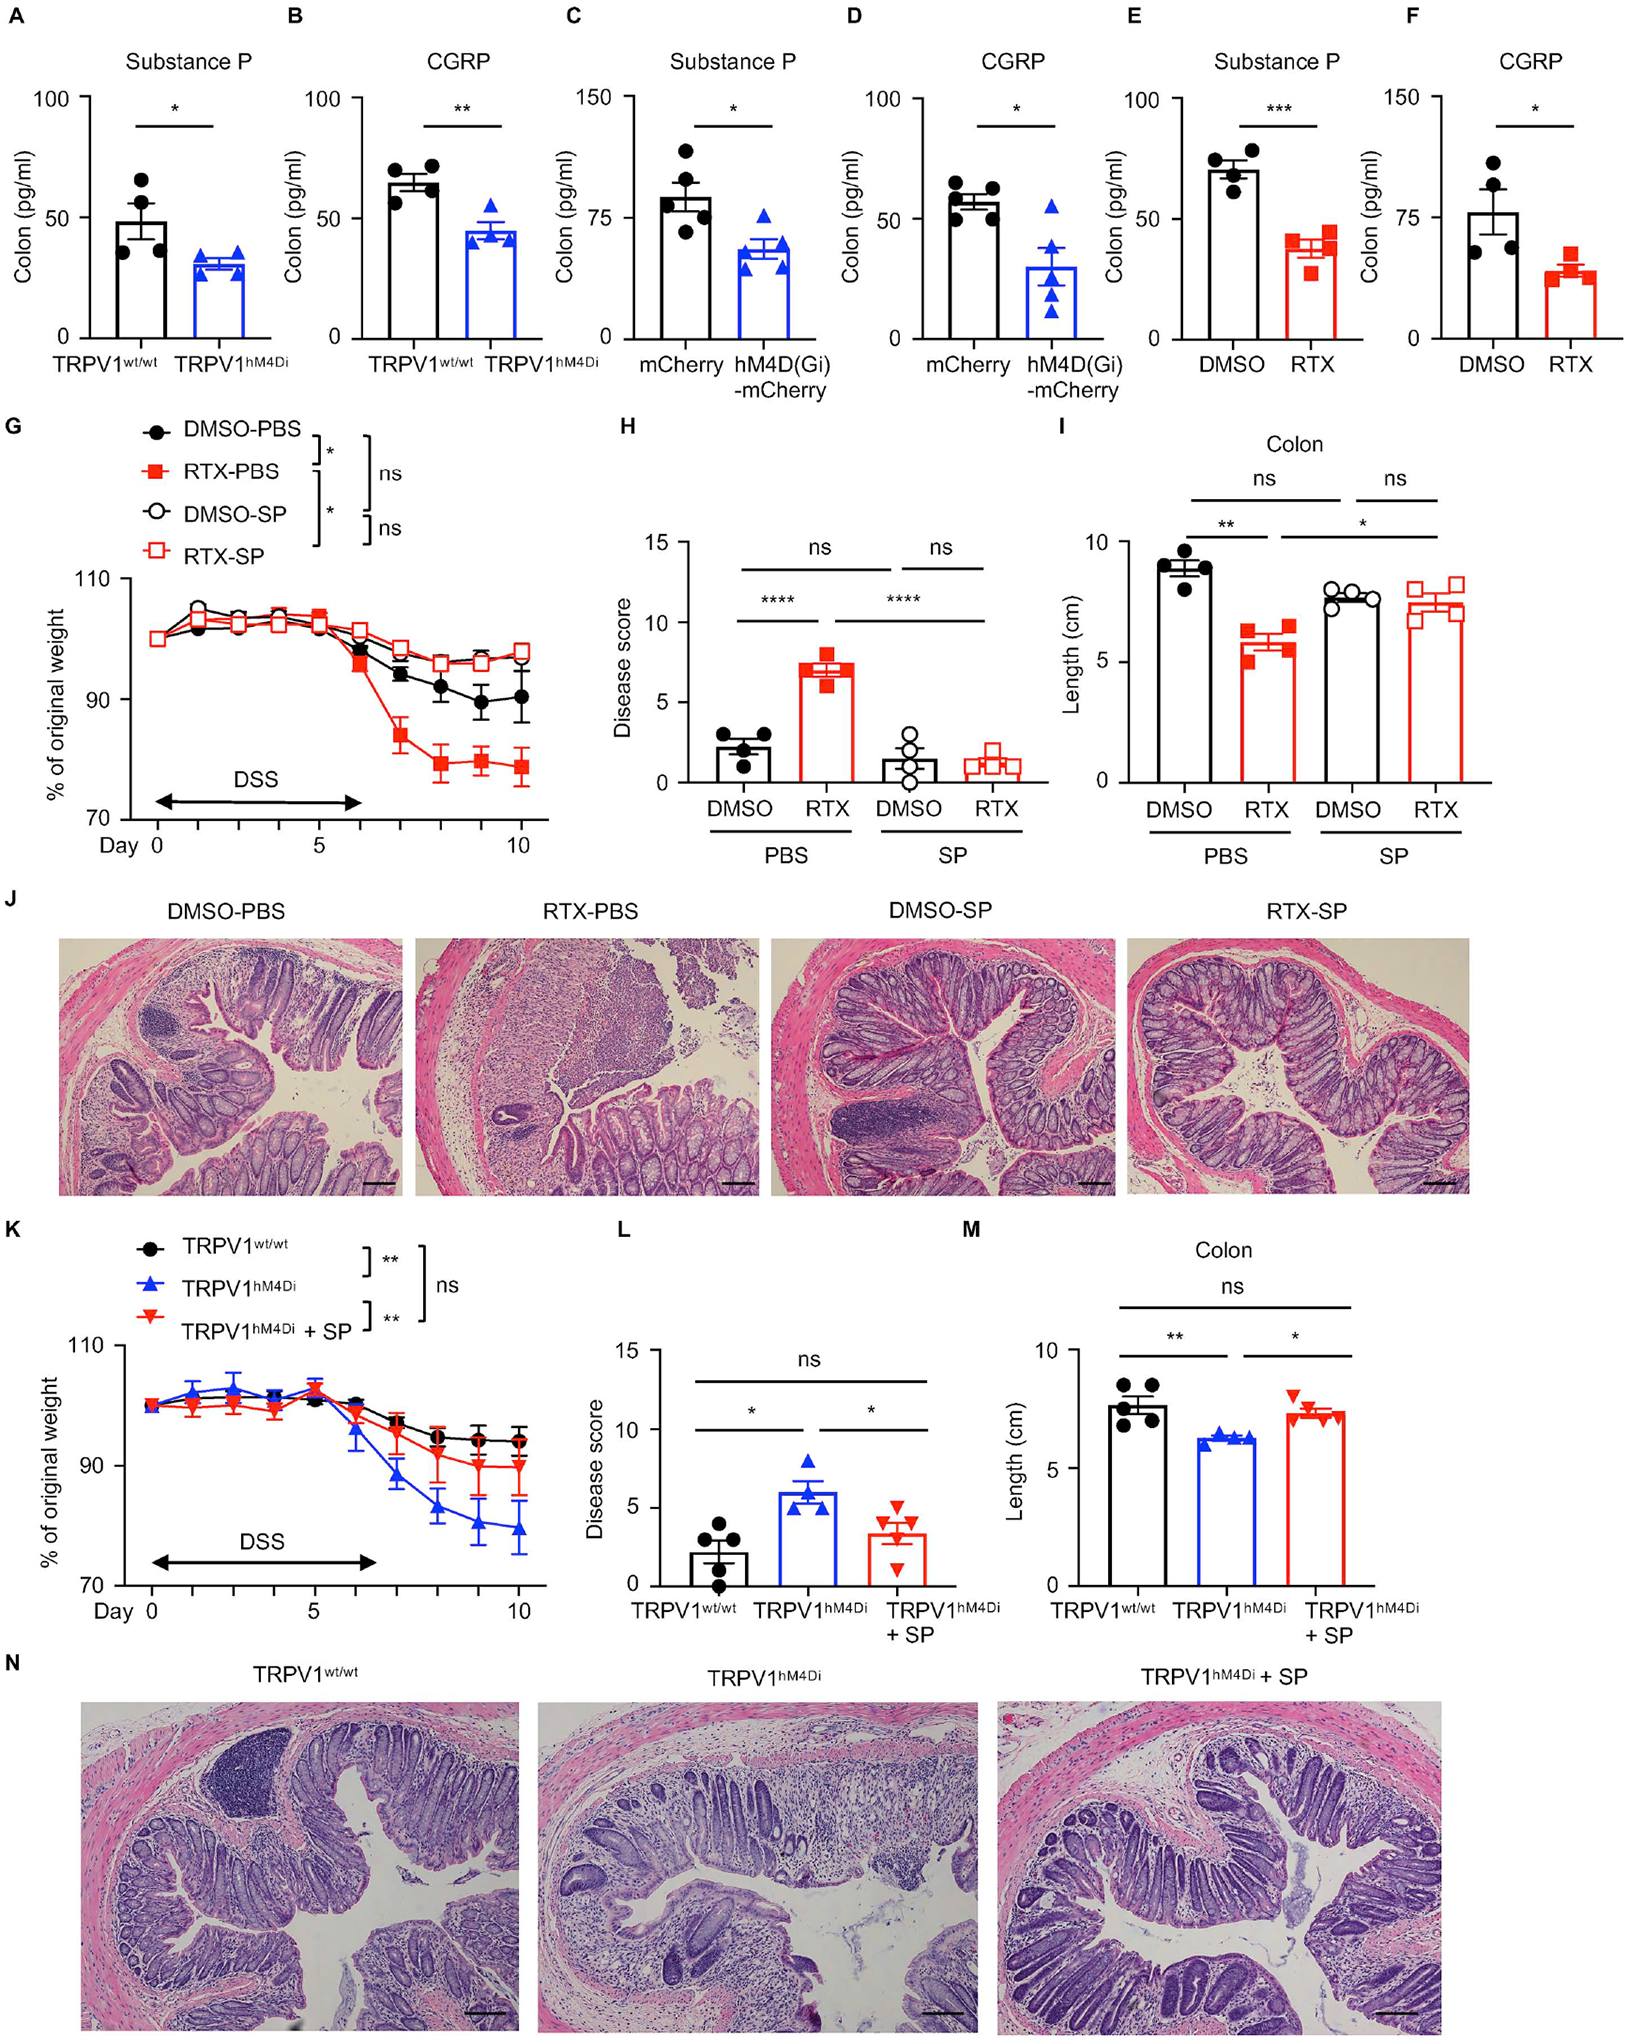
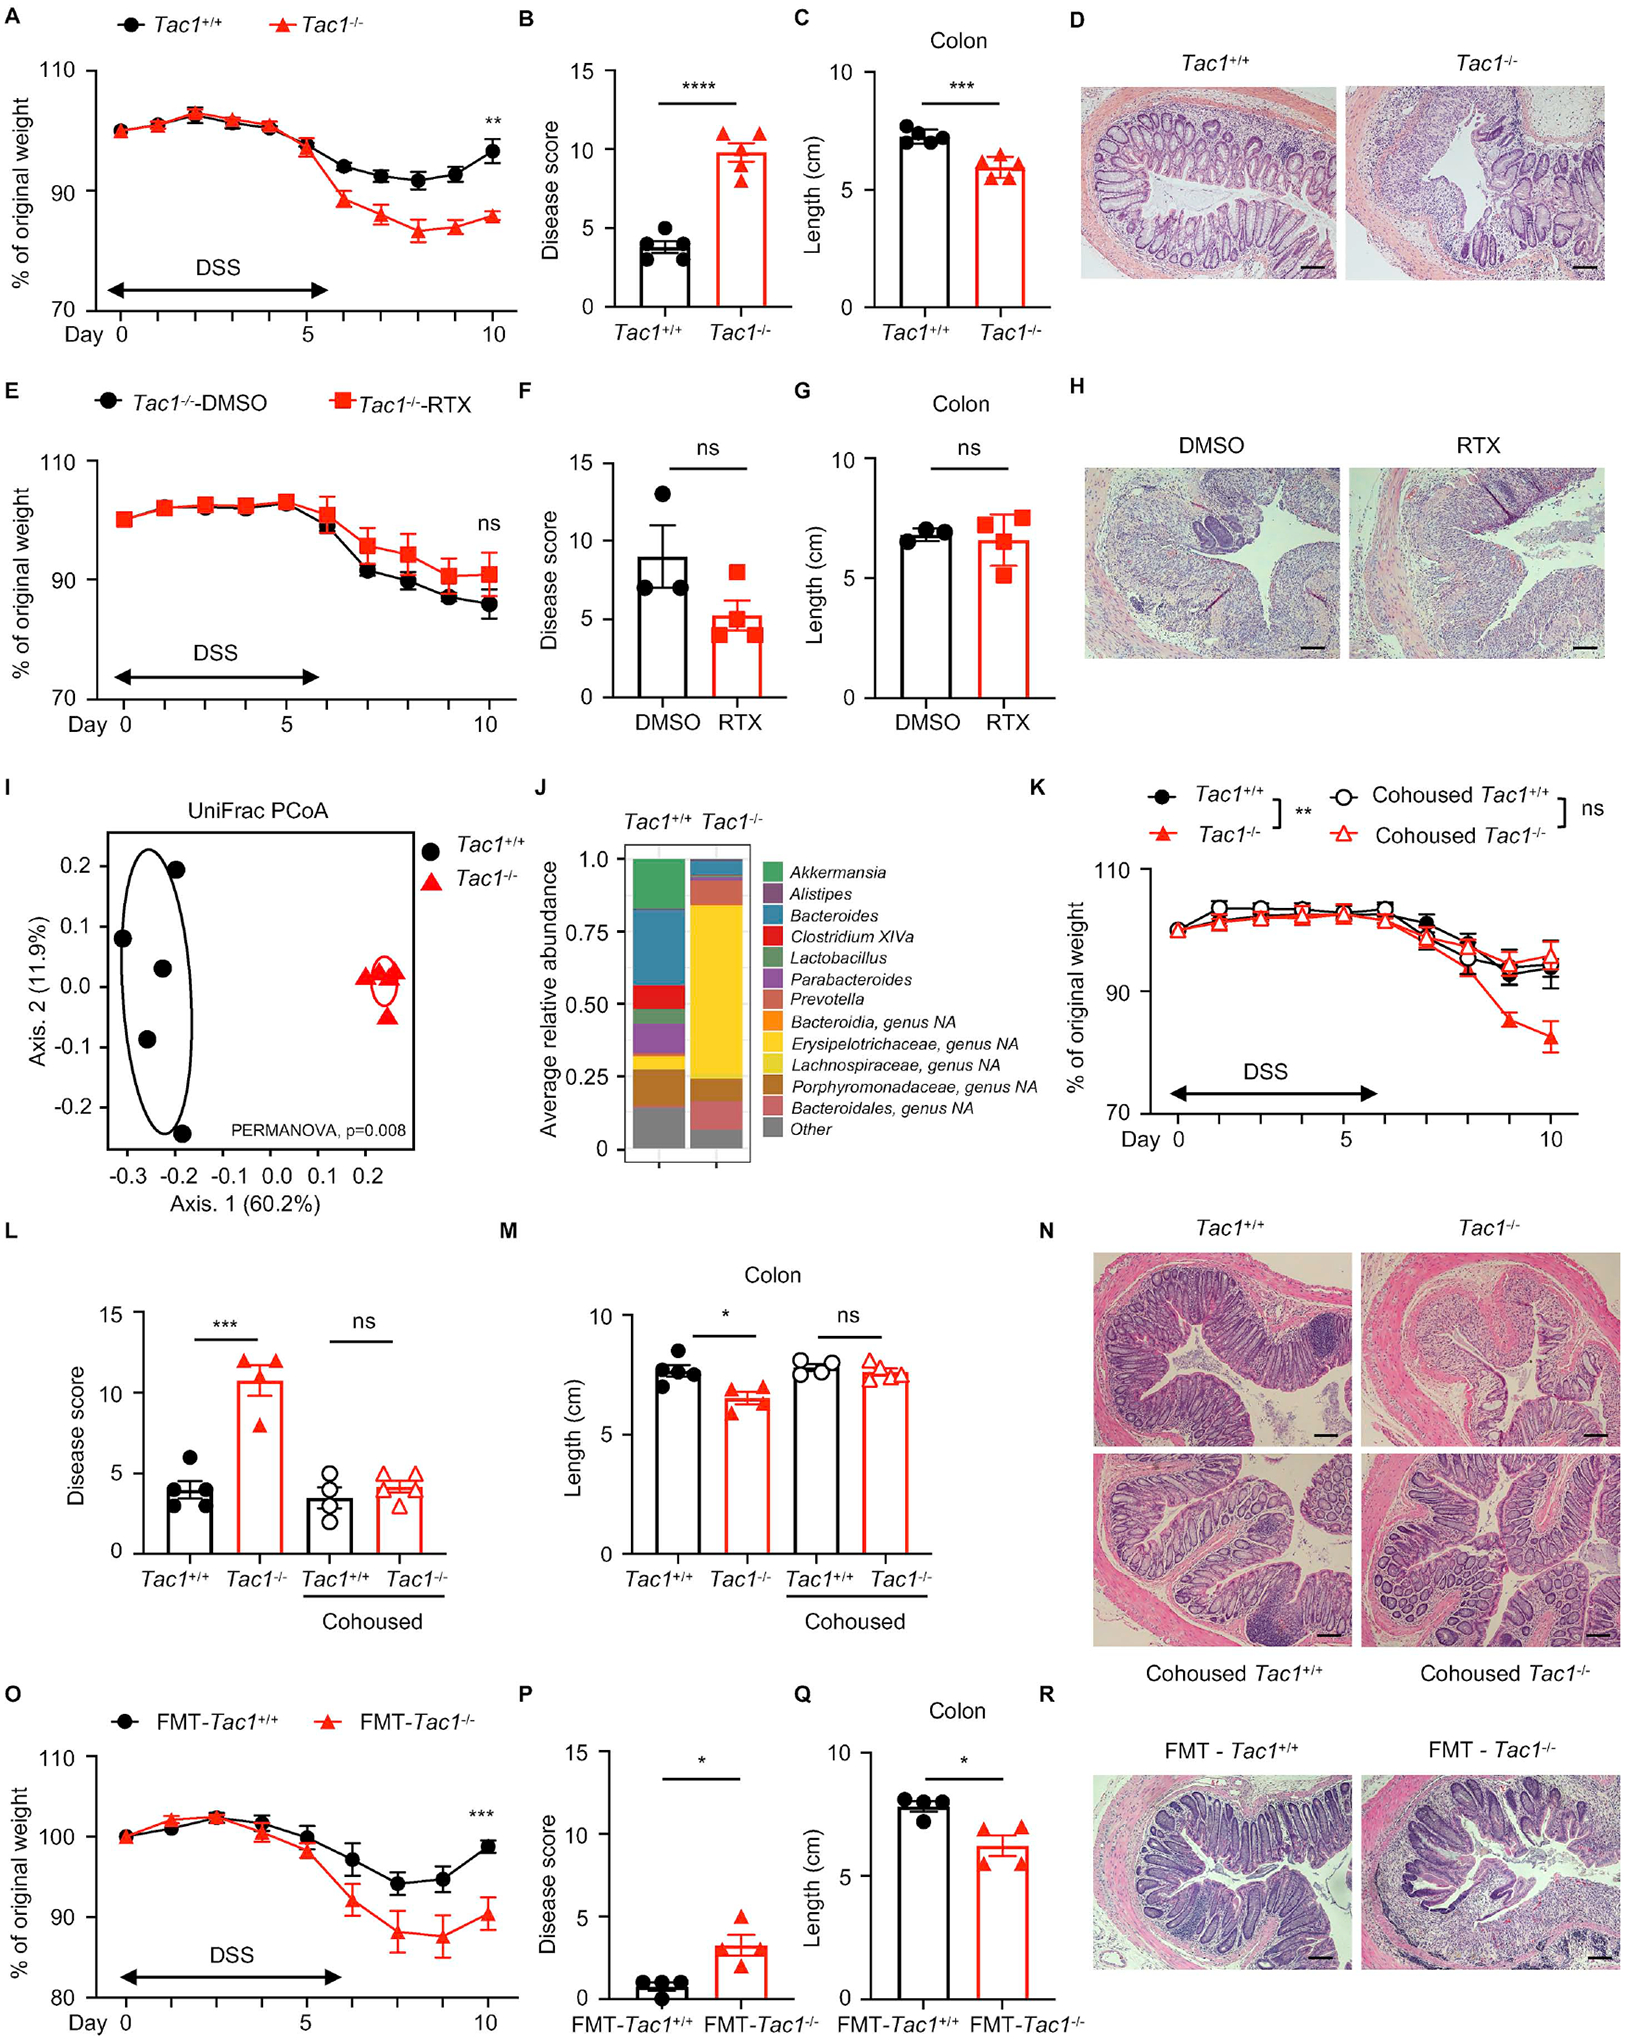
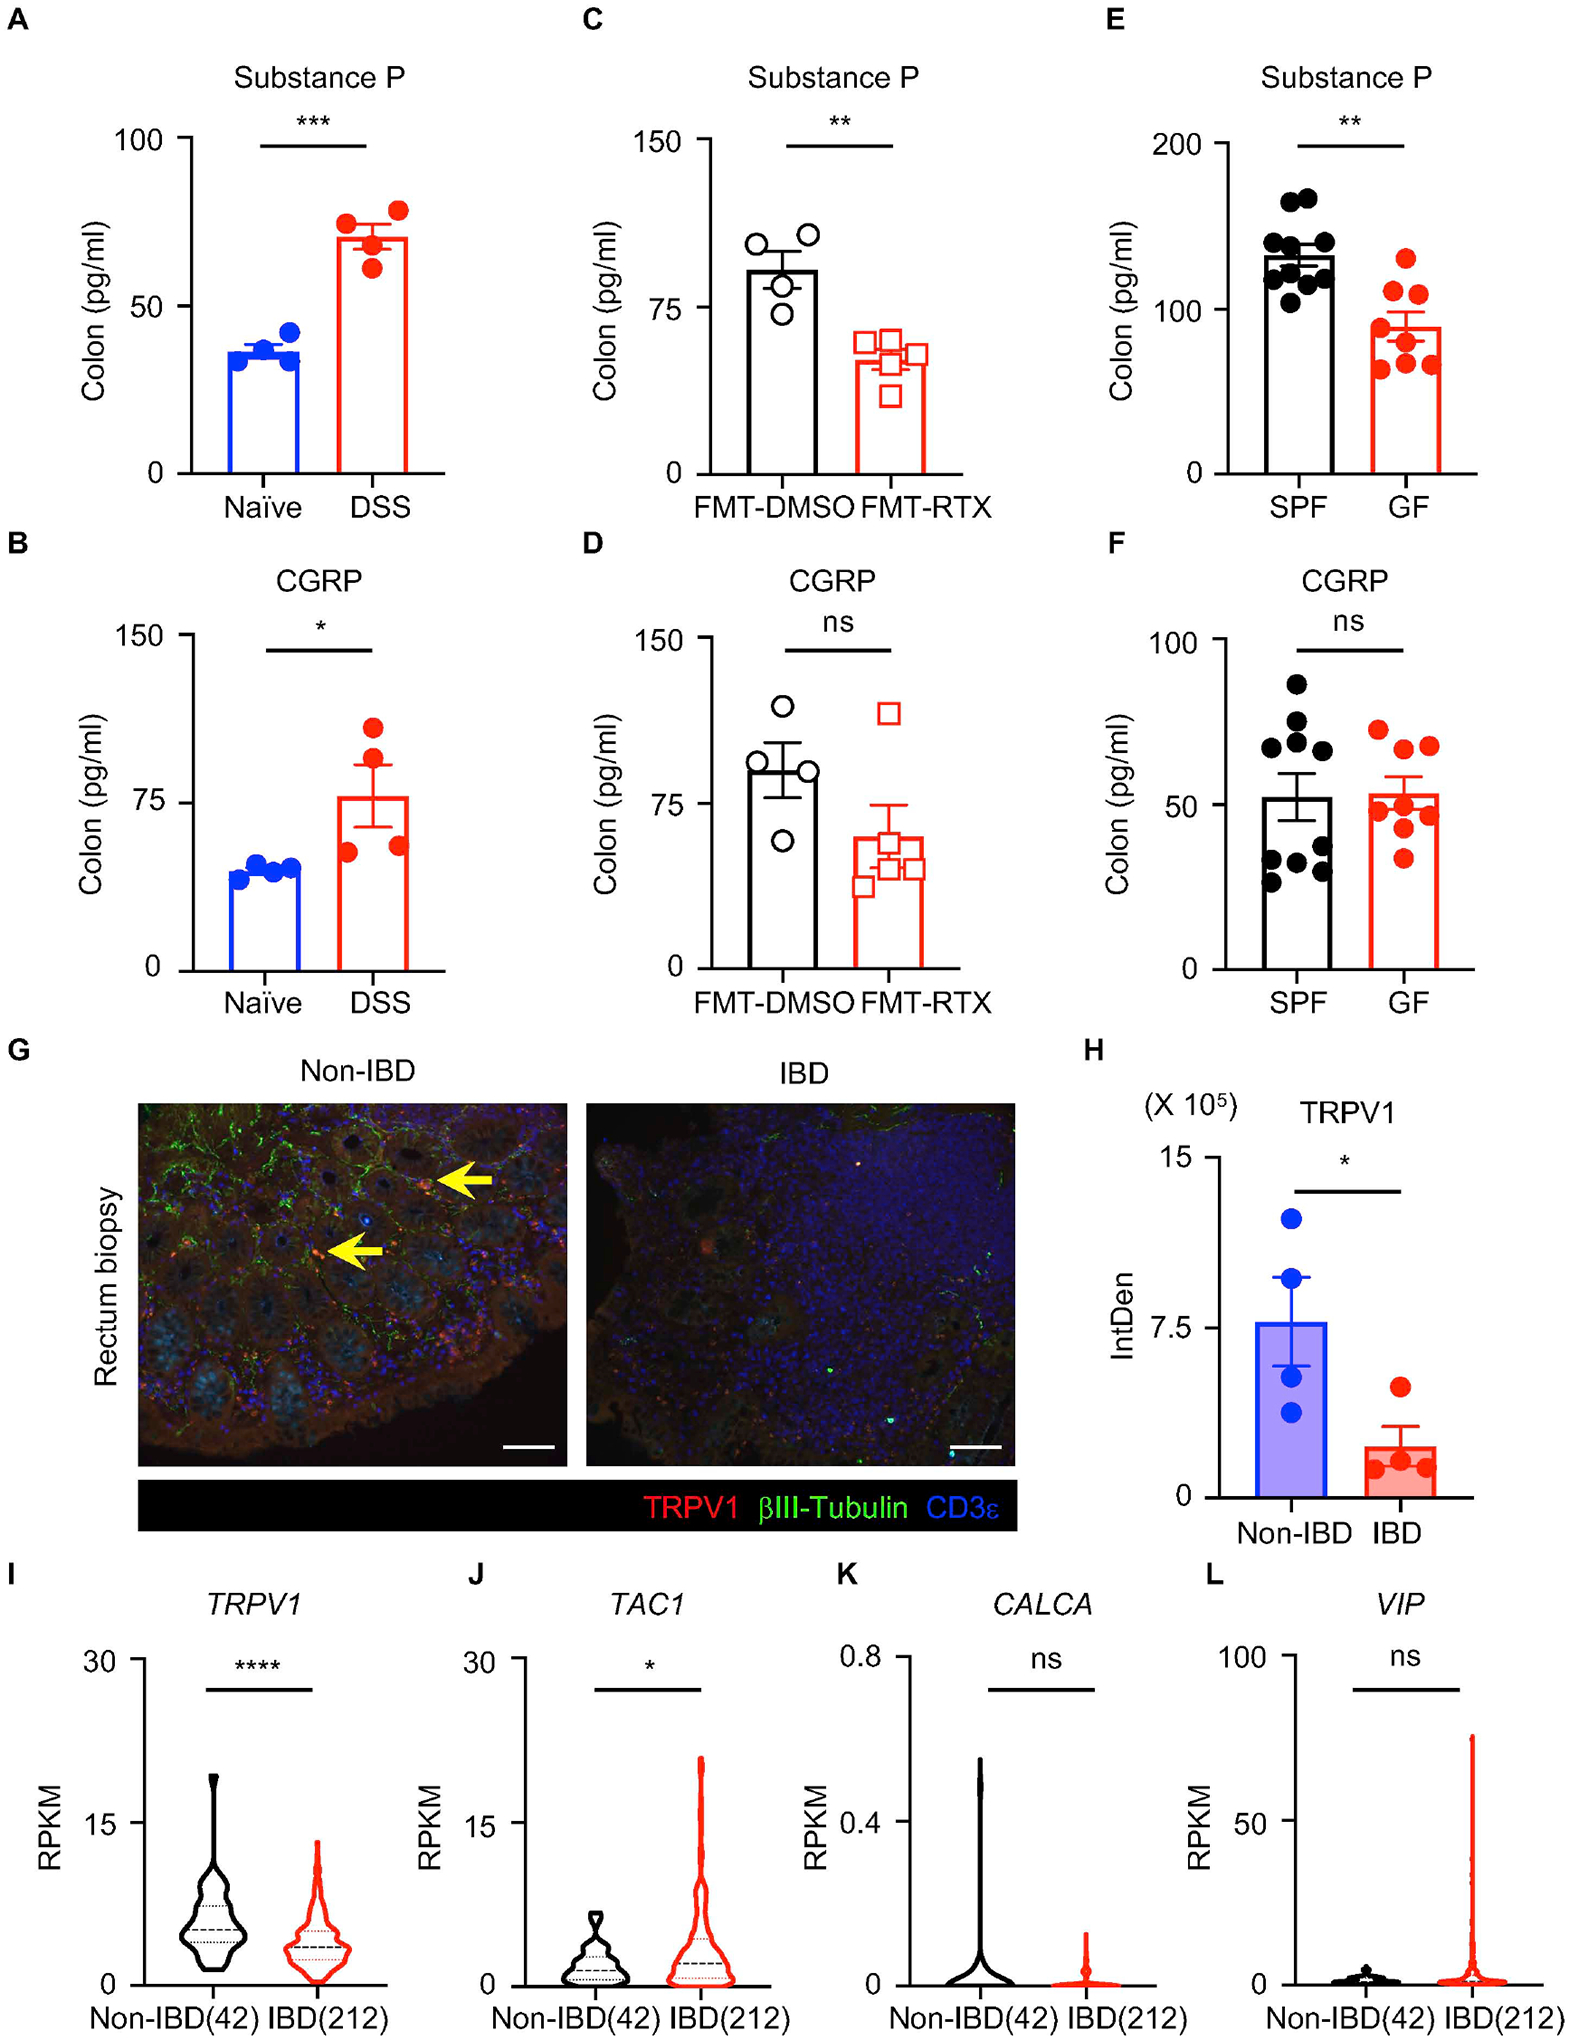
Nociceptive pain is a hallmark of many chronic inflammatory conditions including inflammatory bowel diseases (IBDs); however, whether pain-sensing neurons influence intestinal inflammation remains poorly defined. Employing chemogenetic silencing, adenoviral-mediated colon-specific silencing, and pharmacological ablation of TRPV1+ nociceptors, we observed more severe inflammation and defective tissue-protective reparative processes in a murine model of intestinal damage and inflammation. Disrupted nociception led to significant alterations in the intestinal microbiota and a transmissible dysbiosis, while mono-colonization of germ-free mice with Gram+Clostridium spp. promoted intestinal tissue protection through a nociceptor-dependent pathway. Mechanistically, disruption of nociception resulted in decreased levels of substance P, and therapeutic delivery of substance P promoted tissue-protective effects exerted by TRPV1+ nociceptors in a microbiota-dependent manner. Finally, dysregulated nociceptor gene expression was observed in intestinal biopsies from IBD patients. Collectively, these findings indicate an evolutionarily conserved functional link between nociception, the intestinal microbiota, and the restoration of intestinal homeostasis.

Keywords: IBD; TRPV1(+) nociceptor; intestinal damage and inflammation; intestinal microbiota; neuron-microbiota crosstalk; substance P; tissue protection.


Conflict of interest statement

Declaration of interests D.A. has contributed to scientific advisory boards at Pfizer, Takeda, and the KRF.

Figures

Figure 1.
Figure 1.. Chemogenetic silencing of TRPV1+ nociceptors lead to enhanced susceptibility to DSS-induced colitis.
(A, B) Naïve and inflamed mouse colons from Trpv1-Cre/tdTomato reporter mice, stained for βIII-tubulin (green) and DAPI (white). S, submucosa; M, muscularis. Yellow arrows show representative TRPV1+ nociceptor innervation. (C to H) Disease and recovery of DSS-treated TRPV1hM4Di and their littermate control mice were monitored by daily weight loss (C), clinical disease score (D), colon length (E) and H&E staining of the distal colon on day 10 (F). (G, H) PAS staining of the distal colon and analysis of PAS+ goblet cells per crypt. (I, J) Frequency of colonic neutrophils from mice in (C) on day 10, pre-gated on live, CD45+ events. (K to M) Flow cytometric analysis of T cell cytokine production from mice in (C) on day 10, pre-gated on live, CD45+ CD4+ events. (N to P) Disease and recovery of DSS-treated Trpv1-Cre mice infected with AAV9 viruses were monitored by daily weight loss (N), colon length (O) and H&E staining of the distal colon on day 10 (P). Scale bars = 50 μm in (A), (B), (F) and (P), and 100 μm in (G). Data are representative of three independent experiments with n=4 to 5 mice per group in (C to J, N to Q). Data are pooled from three independent experiments with n=4–5 mice per group in each experiment in (L) and (M). Data are Mean ± SEM. ns, not significant, * P < 0.05, ** P < 0.01, *** P < 0.001.
Figure 2.
Figure 2.. TRPV1+ nociceptor ablation exacerbates DSS-induced colitis.
(A) DRG nociceptor marker gene expression was assessed in DRGs isolated from DMSO- or RTX-treated B6 mice at steady state. (B, C) Immunofluorescence microscopy and quantification of TRPV1+ DRGs isolated from DMSO- or RTX-treated B6 mice at day 10 post DSS administration. (D to G) The Promethion Metabolic Cage System was used to measure daily food (D) and water intake (E), locomotion (F) and energy expenditure of each mouse (G) treated with DMSO or RTX. (H to M) Disease and recovery of DSS-treated DMSO- and RTX-treated B6 mice were monitored by daily weight loss (H), clinical disease score (I), colon length (J) and H&E staining of the distal colon (K) at day 14. (L, M) PAS staining of the distal colon and analysis of PAS+ goblet cells per crypt. (N, O) Frequency of colonic neutrophils from mice in (H) on day 10, pre-gated on live, CD45+ events. (P to R) Flow cytometric analysis of T cell cytokine production from mice in (H) on day 10, pre-gated on live, CD45+ CD4+ events. Scale bars = 200 μm in (B) and 50 μm in (K) and 100 μm in (L). Data are representative of three independent experiments with n=3 to 5 mice per group in (A to O). Data are pooled from three independent experiments with n=4–5 mice per group in each experiment in (P to R). Data are Mean ± SEM. ns, not significant, * P < 0.05, ** P < 0.01, *** P < 0.001.
Figure 3.
Figure 3.. TRPV1+ nociceptor ablation leads to a transmissible dysbiosis.
(A) Fecal microbial composition was analyzed by 16S rRNA gene sequencing with principal coordinates analysis in DMSO- or RTX-treated mice. (B) Averaged relative abundance at the phylum level. (C) Phylum-specific qPCR of fecal samples from DMSO- or RTX-treated mice. (D) FMT donor and recipient fecal microbial composition was analyzed by 16S rRNA gene sequencing, presented as averaged relative abundance at the genus level. (E to H) Disease and recovery of DSS-treated FMT mice were monitored by daily weight loss (E), clinical disease score (F), colon length (G) and H&E staining of distal colon (H) at day 10. (I, J) Frequency of colonic neutrophils from mice in (E) on day 10, pre-gated on live, CD45+ events. (K to N) Disease and recovery of DSS-treated cohoused mice were monitored by daily weight loss (K), clinical disease score (L), colon length (M), and H&E staining of distal colon (N) at day 10. Scale bars = 50 μm in (H) and (N). Data are representative of two independent experiments with n=3–5 per group. Data are Mean ± SEM. * P < 0.05, ** P < 0.01, *** P < 0.001, **** P < 0.0001.
Figure 4.
Figure 4.. Manipulation of the intestinal microbiota improves DSS-induced colitis susceptibility upon TRPV1+ nociceptor ablation.
(A) DMSO- or RTX-treated mice administered with vehicle or broad spectrum antibiotic cocktail (ABX), vancomycin, or neomycin were exposed to DSS for 5 days and disease and recovery were monitored daily. (B to E) Daily weight loss (B), clinical disease score (C), colon length (D), and H&E staining of the distal colon (E) in vehicle or ABX-treated mice at day 10. (F to I) Daily weight loss (F), clinical disease score (G), colon length (H) and H&E staining of the distal colon (I) in vancomycin-treated mice at day 10. (J to M) Daily weight loss (J), clinical disease score (K), colon length (L) and H&E staining of the distal colon (M) in neomycin-treated mice at day 10. (N to Q) Daily weight loss (N), clinical disease score (O), colon length (P) and H&E staining of the distal colon (Q) in Clostridium spp.-colonized ex-GF mice at day 10. Scale bars = 50 μm in (E), (I), (M) and (Q). Data are representative of two independent experiments with n=3–7 per group. Data are Mean ± SEM. ns, not significant, * P < 0.05, ** P < 0.01, *** P < 0.001.
Figure 5.
Figure 5.. Substance P is required for tissue protection mediated by TRPV1+ nociceptors.
(A, B) Colon substance P and CGRP levels in DSS-treated TRPV1hM4Di or their littermate control mice. (C, D) Colon substance P and CGRP levels in DSS-treated TRPV1wt/wt mice infected with AAV9 viruses. (E, F) Colon substance P and CGRP levels in DSS-treated DMSO- or RTX-treated mice. (G to J) Disease and recovery of DSS-treated DMSO- or RTX-treated mice administered with substance P were assessed from day 0 to day 10 by daily weight loss (G), clinical disease score (H), colon length (I) and H&E staining of the distal colon (J) at day 10. (K to N) Disease and recovery of DSS-treated TRPV1hM4Di or their littermate control administered with substance P were assessed by daily weight loss (K), clinical disease score (L), colon length (M) and H&E staining of the distal colon (N) at day 10. Scale bars = 50 μm in (J) and (N). Data are representative of two independent experiments with n=4–5 per group. Data are shown as mean ± SEM. ns, not significant, * P < 0.05, ** P < 0.01, *** P < 0.001, **** P < 0.0001.
Figure 6.
Figure 6.. Substance P mediates tissue protection from DSS-induced colitis in a microbiota-dependent manner.
(A to D) Disease and recovery of DSS-treated Tac1+/+ and Tac1−/− mice were monitored by daily weight loss (A), clinical disease score (B), colon length (C), and H&E staining of the distal colon (D) at day 10. (E to H) Disease and recovery of DSS-treated DMSO- or RTX-treated Tac1−/− mice were monitored by daily weight loss (E), clinical disease score (F), colon length (G) and H&E staining of the distal colon (H) at day 10. (I, J) Principal coordinates analysis (I) and averaged relative abundance at the genus level (J) of feces from Tac1+/+ and Tac1−/− mice at steady state. (K to N) Disease and recovery of DSS-treated single housed or cohoused Tac1+/+ and Tac1−/− mice were monitored by daily weight loss (K), clinical disease score (L), colon length (M), and H&E staining of the distal colon (N). (O to R) Disease and recovery of DSS-treated FMT mice were monitored by daily weight loss (O), clinical disease score (P), colon length (Q) and H&E staining of distal colon (R) at day 10. Scale bars = 50 μm in (D), (H), (N) and (R). Data are representative of three independent experiments with n=3–5 per group. Data are Mean ± SEM. ns, not significant, * P < 0.05, ** P < 0.01, *** P < 0.001, **** P < 0.0001.
Figure 7.
Figure 7.. Nociceptive neuropeptide expression is altered in intestinal inflammation and dysbiosis in mouse and human.
(A, B) Colon substance P and CGRP levels in naïve or DSS-treated mice. (C, D) Colon substance P and CGRP levels in DSS-treated FMT-DMSO or FMT-RTX mice. (E, F) Colon substance P and CGRP levels in DSS-treated SPF or GF mice. (G, H) Representative sections and quantification of TRPV1 fluorescence intensity of pediatric non-IBD and IBD colon biopsy samples, stained for TRPV1 (red), βIII-tubulin (green) and CD3ε (blue). Yellow arrows show representative TRPV1+ nociceptor innervation. Scale bars = 100 μm in (G). (I to L) Analysis of RNA-Seq dataset of pediatric IBD biopsy samples with violin plots of TRPV1, TAC1, CALCA and VIP expression. Data are pooled from three independent experiments with n=3–4 mice per group in (E, F). Data are Mean ± SEM. ns, not significant, * P < 0.05, *** P < 0.001, *** P < 0.005, **** P < 0.0001.

Comment in

References

    1. Abraham C, and Cho JH (2009). Inflammatory bowel disease. N Engl J Med 361, 2066–2078. - PMC - PubMed
    1. Alenghat T, Osborne LC, Saenz SA, Kobuley D, Ziegler CG, Mullican SE, Choi I, Grunberg S, Sinha R, Wynosky-Dolfi M, et al. (2013). Histone deacetylase 3 coordinates commensal-bacteria-dependent intestinal homeostasis. Nature 504, 153–157. - PMC - PubMed
    1. Ansaldo E, Farley TK, and Belkaid Y (2021). Control of Immunity by the Microbiota. Annu Rev Immunol 39, 449–479. - PubMed
    1. Atarashi K, Tanoue T, Oshima K, Suda W, Nagano Y, Nishikawa H, Fukuda S, Saito T, Narushima S, Hase K, et al. (2013). Treg induction by a rationally selected mixture of Clostridia strains from the human microbiota. Nature 500, 232–236. - PubMed
    1. Atarashi K, Tanoue T, Shima T, Imaoka A, Kuwahara T, Momose Y, Cheng G, Yamasaki S, Saito T, Ohba Y, et al. (2011). Induction of colonic regulatory T cells by indigenous Clostridium species. Science 331, 337–341. - PMC - PubMed

Publication types