. 2023 May;72(5):939-950.
doi: 10.1136/gutjnl-2022-328084. Epub 2022 Oct 14.

Identification of bacterial lipopeptides as key players in IBS

Affiliations

Identification of bacterial lipopeptides as key players in IBS

Camille Petitfils et al. Gut. 2023 May.

Abstract

Objectives: Clinical studies revealed that early-life adverse events contribute to the development of IBS in adulthood. The aim of our study was to investigate the relationship between prenatal stress (PS), gut microbiota and visceral hypersensitivity with a focus on bacterial lipopeptides containing γ-aminobutyric acid (GABA).

Design: We developed a model of PS in mice and evaluated, in adult offspring, visceral hypersensitivity to colorectal distension (CRD), colon inflammation, barrier function and gut microbiota taxonomy. We quantified the production of lipopeptides containing GABA by mass spectrometry in a specific strain of bacteria decreased in PS, in PS mouse colons, and in faeces of patients with IBS and healthy volunteers (HVs). Finally, we assessed their effect on PS-induced visceral hypersensitivity.

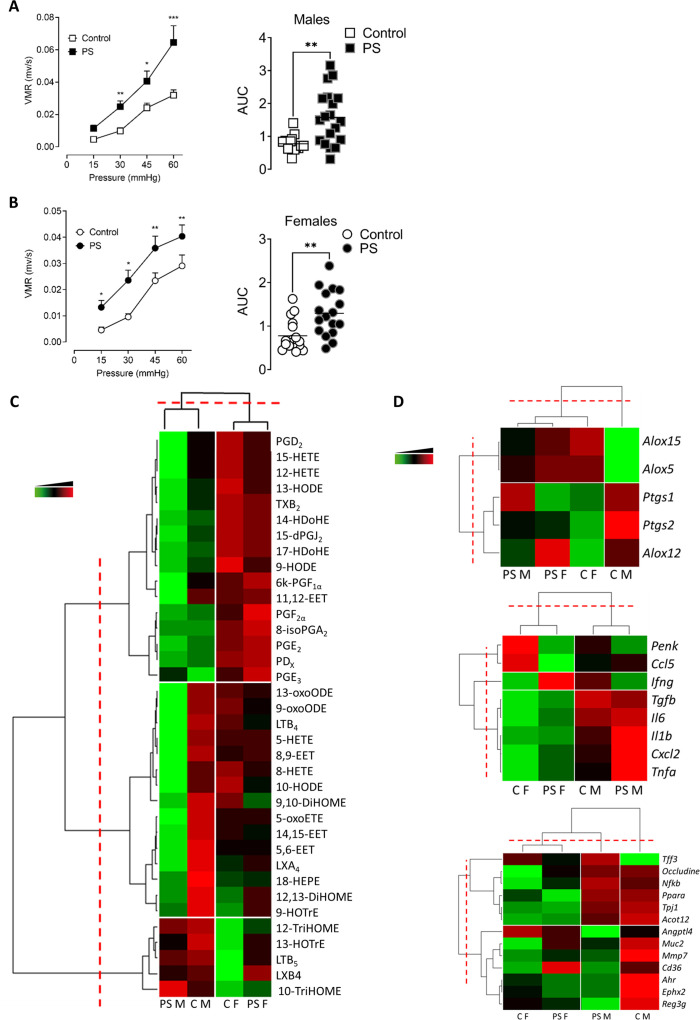
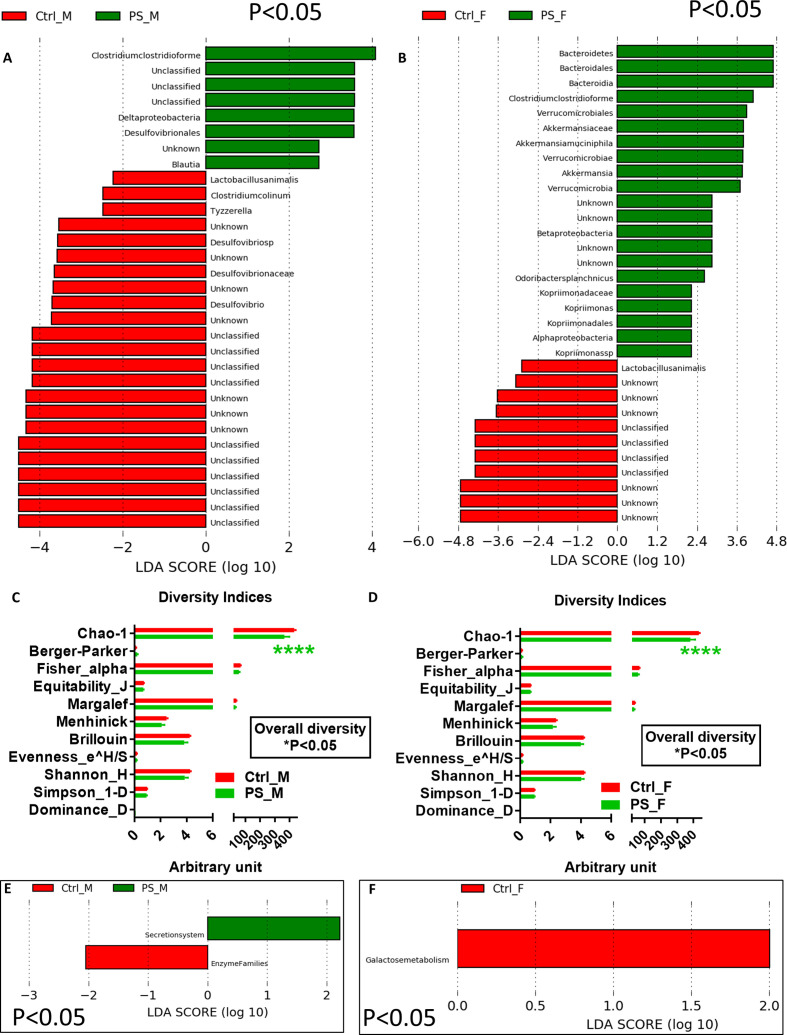
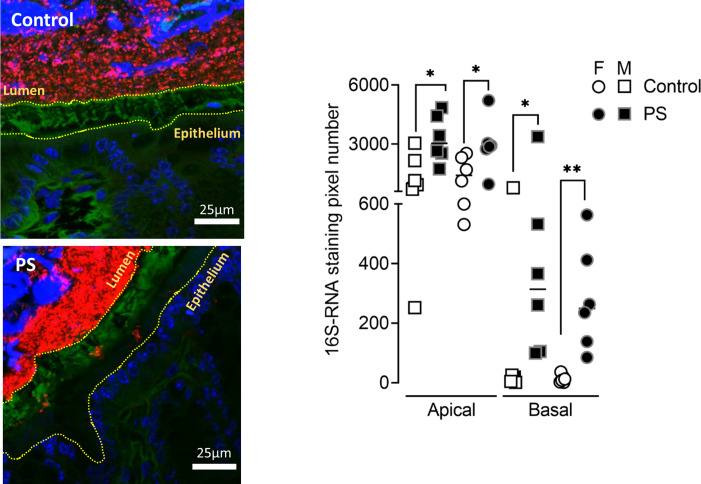
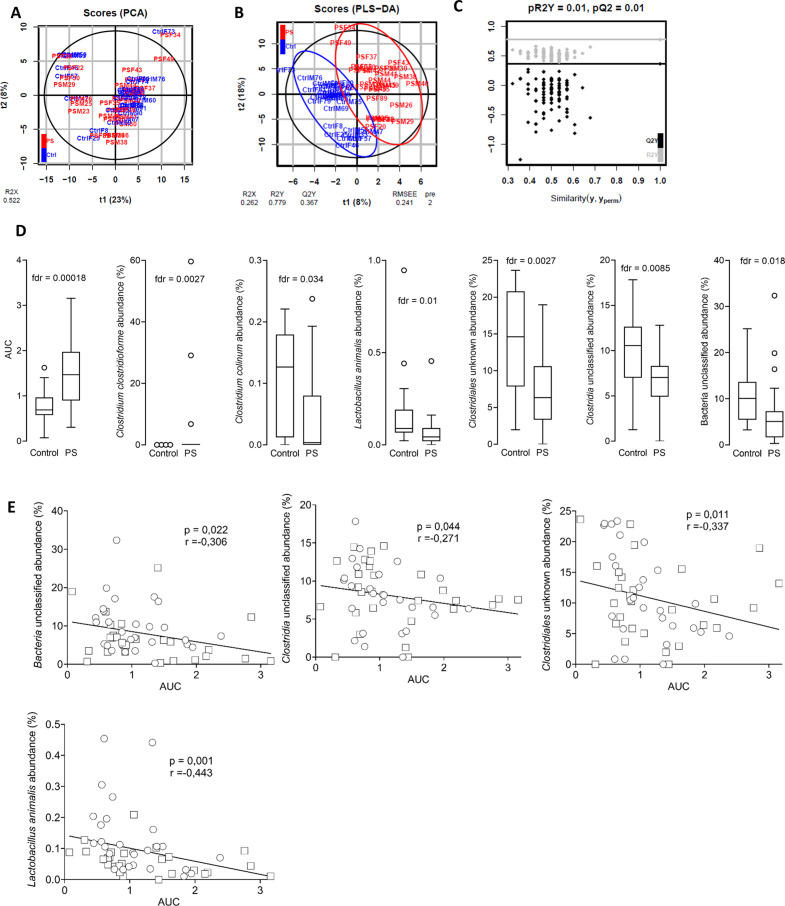
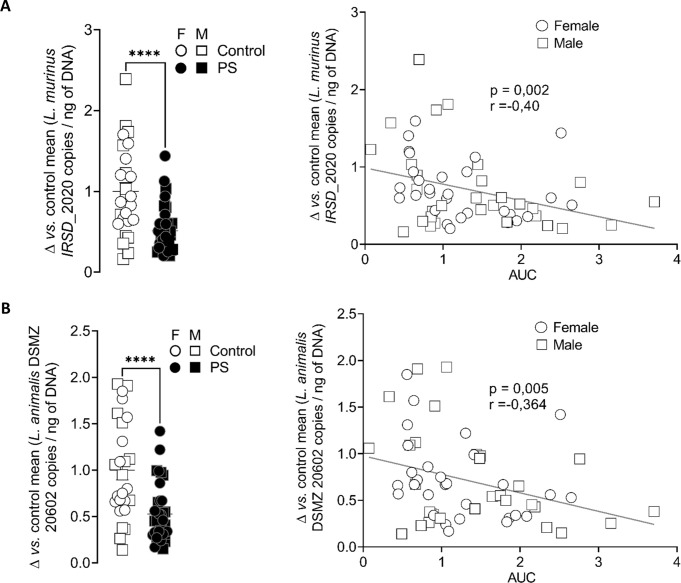
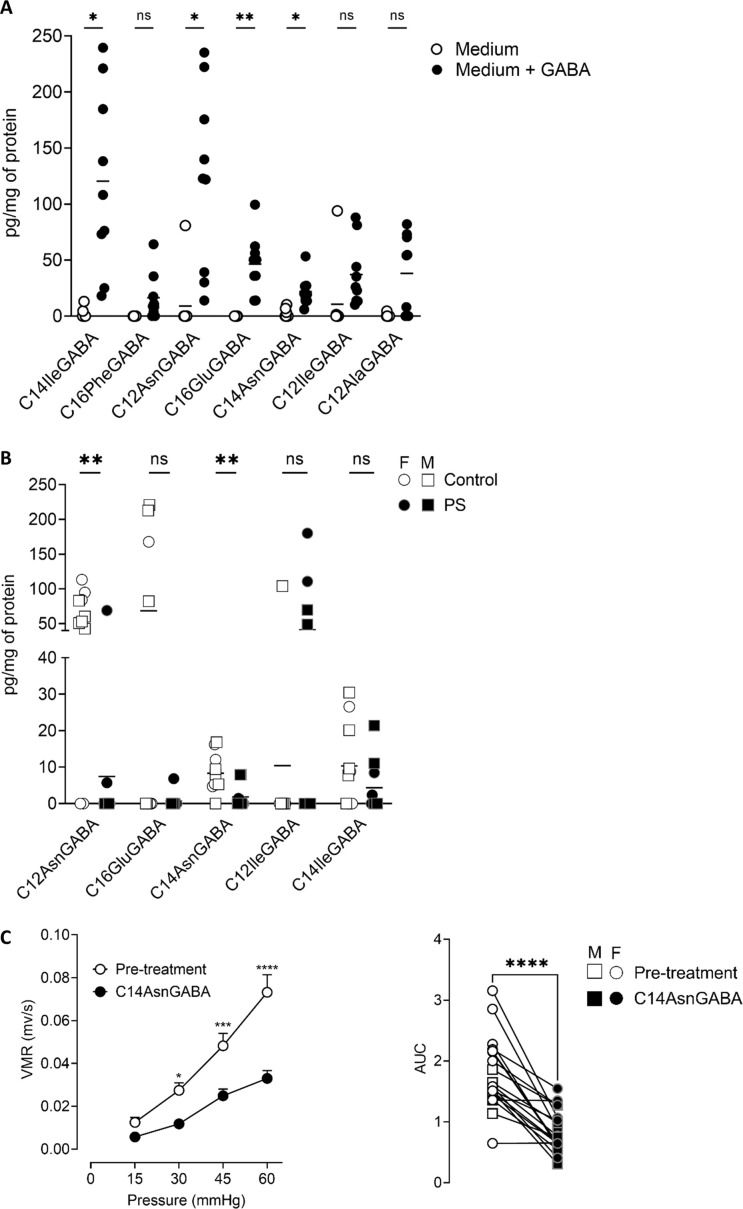
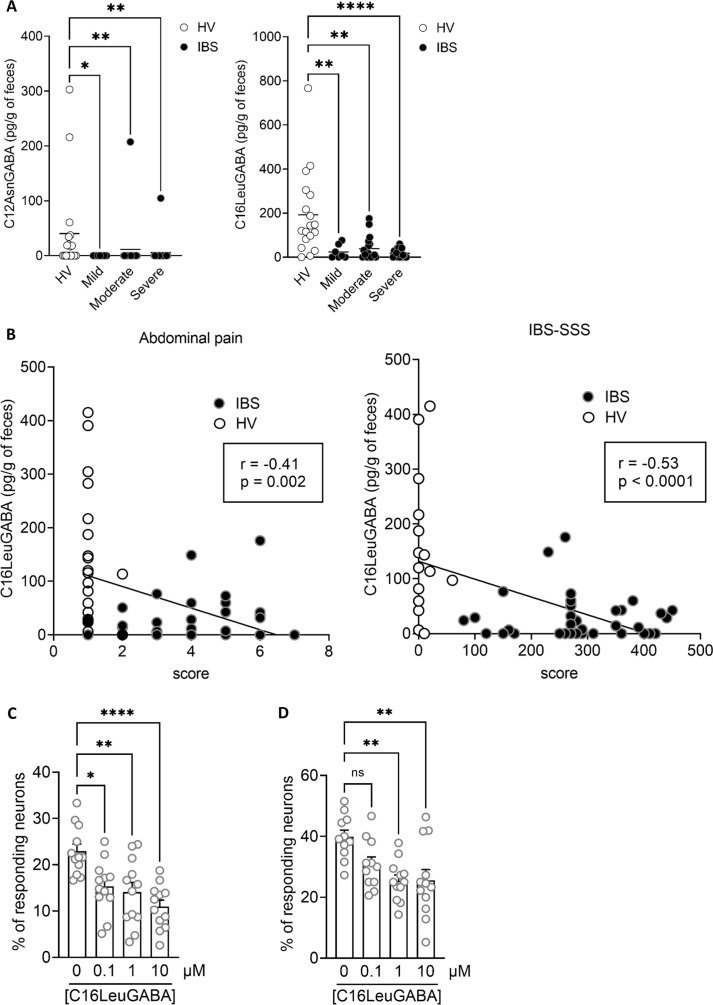
Results: Prenatally stressed mice of both sexes presented visceral hypersensitivity, no overt colon inflammation or barrier dysfunction but a gut microbiota dysbiosis. The dysbiosis was distinguished by a decreased abundance of Ligilactobacillus murinus, in both sexes, inversely correlated with visceral hypersensitivity to CRD in mice. An isolate from this bacterial species produced several lipopeptides containing GABA including C14AsnGABA. Interestingly, intracolonic treatment with C14AsnGABA decreased the visceral sensitivity of PS mice to CRD. The concentration of C16LeuGABA, a lipopeptide which inhibited sensory neurons activation, was decreased in faeces of patients with IBS compared with HVs.

Conclusion: PS impacts the gut microbiota composition and metabolic function in adulthood. The reduced capacity of the gut microbiota to produce GABA lipopeptides could be one of the mechanisms linking PS and visceral hypersensitivity in adulthood.

Keywords: ENTERIC BACTERIAL MICROFLORA; IRRITABLE BOWEL SYNDROME; LACTIC ACID BACTERIA; LIPIDS; VISCERAL HYPERSENSITIVITY.


Conflict of interest statement

Competing interests: PP is a senior fellow of the Institut Universitaire de France. CM has been awarded the UEG Research Award 2020 for her stay at The University of Gothenburg and by the FARE Fellowship of the French Gastroenterology Society in 2015.

Figures

Figure 1
Figure 1
PS induces visceral hypersensitivity in the adult offspring. VMR to colorectal distensions in control (white) or PS (black) mice in response to increasing pressures of distension (15, 30, 45 and 60 mm Hg) was measured in both male (A) and female (B) offspring. Data are expressed as mean±SEM (n=14–19 mice/group, three independent experiments). Statistical analysis was performed using two-way analysis of variance and subsequent Sidak multiple comparison test. *P<0.05, **P<0.01, ***P<0.001 significantly different from the control group. The results are also expressed as AUC presented as scatter dot plot with the mean. Statistical analysis was performed using a Mann-Whitney test. **P<0.01, significantly different from the control group. (C) Heat map of PUFA metabolites quantified by liquid chromatography coupled to mass spectrometry. Data are shown in a matrix format: each row represents a single PUFA metabolite, and each column represents a group of mice: C M=control males, PS M=PS males, C F=control females, PS F=PS females. each colour patch represents the normalised quantity of PUFA metabolites (row) in a group of mice (column), with a continuum of quantity from bright green (lowest) to bright red (highest). The pattern and length of the branches in the dendrogram on the left, reflect the relatedness of the PUFA metabolites, on top the relatedness of the mouse groups. The dashed red line is the dendrogram distance used to cluster PUFA metabolites and mouse groups. (n=15 mice/group, 2 independent experiments). (D) Heatmap of mRNA expression of genes coding for enzymes implicated in PUFA metabolism (top panel), colonic immune response (middle panel) and gut homeostasis (bottom panel). Data are shown in a matrix format: each row represents a single PUFA metabolite, and each column represents a group of mice: CM, CF, PSM and PSF. Each colour patch represents the normalised gene expression (row) in a group of mice (column), with a continuum of quantity from bright green (lowest) to bright red (highest). The pattern and length of the branches in the dendrogram on the left reflect the relatedness of the gene expression on top the relatedness of the mouse groups. The dashed red line is the dendrogram distance used to cluster genes and mouse groups (n=15 mice/group, three independent experiments). AUC, area under the curve; CF, control female; CM, control male; PS, prenatal stress; PSF, prenatal stress male female; PSM, prenatal stress male; PUFA, polyunsaturated fatty acid; VMR, visceromotor response.
Figure 2
Figure 2
PS induces a gut microbiota dysbiosis both in male and female mice. LDA score in male (A) and female (B) PS mice versus control mice; diversity indices in male (C) and female (D) PS mice versus control mice; PICRUSt-based predicted gut microbial functions in male (E) and female (F) PS mice versus control mice (n=15 mice/group). **** P<0.0001 significantly different from the control group. Ctrl, control; LDA, linear discriminant analysis; PS, prenatal stress; PSF, prenatal stress male female; PSM, prenatal stress male.
Figure 3
Figure 3
PS alters gut microbiota spatial organisation in adulthood. Bacteria were labelled with the universal probe Eub338 (red); wheat germ agglutinin-Fluorescein-5-isothiocyanate (FITC) was used to stain the polysaccharide-rich mucus layer (green); and the epithelial cell nucleus was stained with 4',6-diamidino-2-phénylindole (DAPI; blue). Bacteria penetration into the mucus was measured in both M (square) and F (circle) control (white symbols) and PS (black symbols) mice by image processing on Fiji by quantifying the number of 16S RNA-labelled pixel between the edge of the lumen and the middle of the mucus (apical) and between the middle of the mucus and the edge of the epithelium (basal). The results are expressed as scatter dot plot with the mean. Statistical analysis was performed using Mann-Whitney test. * P<0.05, **P<0.01, significantly different from the control group. (n=12 mice/group; four images/mice, two independent experiments). F, female; M, male; PS, prenatal stress.
Figure 4
Figure 4
The abundance of Lactobacillus animalis is inversely correlated to visceral hypersensitivity in adulthood. Multivariate analysis of the complete cohort: (A) two-dimensional PCA (R2=52%) score plot of data generated from 56 samples (control, n=28, blue; PS, n=28, red). each dot corresponds to an individual. (B) two-dimensional PLS-DA (R2X=26.2%, R2Y=77.9%, Q2=0.367) score plot of data generated from 53 samples (control, n=26, blue; PS, n=27, red). Each dot corresponds to an individual. The black ellipse corresponds to a 95% CI based on the Hotelling’s T2. RMSEE, root mean square error (C) Permutation test result for PLS-DA model validation. (D) Box plots of discriminant (variable importance in projection >1) and significant (false discovery rate (FDR)-corrected p value of Wilcoxon test <0.05) variables. (E) Spearman correlations were used to analyse the correlation between the faecal microbiota abundances and visceral motor response to colorectal distension expressed in AUC, in male (square) and female (circle) offspring. P and R values are indicated on each graph. AUC, area under the curve; PS, prenatal stress.
Figure 5
Figure 5
Ligilactobacillus murinus IRSD_2020 concentration is decreased in PS mouse faeces. The levels of the L. murinus strain IRSD_2020 (A) and of the reference L. murinus/animalis strain DSMZ 20602 (B) were quantified by TaqMan real-time PCR in the faeces of control mice (white) or PS mice (black), in the M (square) and F(circle) offspring. Data are expressed as scatter dot plot with the mean. Statistical analysis was performed using Mann-Whitney test. ****P<0.0001, significantly different from the control group (n=27–36 mice/group, three independent experiments). Spearman correlations were used to analyse the correlation between the faecal bacteria quantity and visceral motor response to colorectal distension expressed in AUC, in M (square) and F (circle) offspring. P and R values are indicated on each graph. AUC, area under the curve; F, female; M, male; PS, prenatal stress
Figure 6
Figure 6
Ligilactobacillus murinus IRSD_2020 produces an analgesic lipopeptide. (A) Concentration of lipopeptides quantified by LC-MS/MS in the bacterial pellets of L. murinus IRSD_2020 cultivated without (white circle) or with (4 mg/mL) (black circle) GABA. Data are expressed as scatter dot plot with the mean (n=9). Statistical analysis was performed using Mann-Whitney test. *P<0.05, **P<0.01, significantly different from the corresponding L. murinus IRSD_2020 without GABA. (B) Concentration of lipopeptides quantified by LC-MS/MS in the colon of M (square) and F (circle) control (white) and PS mice (black). Data are expressed as scatter dot plot with the mean (n=9–10). Statistical analysis was performed using Mann-Whitney test. **P<0.01, significantly different from the corresponding control group. (C) VMR to colorectal distensions in response to increasing pressures of distension (15, 30, 45 and 60 mm Hg) was measured in both M and FM PS offspring. Measurements were done before (white) and after intracolonic administrations of C14AsnGABA (black). Data are expressed as mean±SEM (n=19 mice/group, two independent experiments). Statistical analysis was performed using two-way analysis of variance and subsequent Sidak multiple comparison test. *P<0.05, ***P<0.001, ****P<0.0001 significantly different from the pretreatment group. The results are also expressed as area under the curve (AUC) presented as scatter dot plot with the mean for M (square) and F (circle) mice. statistical analysis was perform using a Wilcoxon test. ****p<0.0001, significantly different from the pretreatment group. F, female; GABA, LC-MS/MS, iquid chromatography–tandem mass spectrometry; M, male; ns, not significant; PS, prenatal stress; VMR, visceromotor response.
Figure 7
Figure 7
Lipopeptide–GABA concentrations are decreased in the faeces of patients with IBS. (A) 16LeuGABA (left panel) and C12AsnGABA (right panel) concentrations quantified by liquid chromatography–tandem mass spectrometry; in the faeces of HVs (n=18, white) and patients with IBS (black) with an IBS-SSS corresponding to mild (n=7), moderate (n=18) or severe (n=18) IBS. Data are expressed as scatter dot plots with the mean. Statistical analysis was performed using Kruskal-Wallis analysis of variance and subsequent Dunn multiple comparison test. **P<0.01, **P<0.001 significantly different from HVs. (B) Spearman correlations were used to analyse the correlation between the concentration of CL16LeuGABA and abdominal pain score (left panel) or IBS-SSS (right panel) in HVs (white) and patients with IBS (black). P and R values are indicated on each graph. (C) Percentage of responding neurons pretreated with increasing amounts of C16LeuGABA or vehicle (HBSS/MeOH 0.06%, 0 µM) and treated with capsaicin (500 nM) or (D) a mix of GPCR agonists (histamine, serotonin and bradykinin, 10 µM each). Data are represented as mean±SEM; n=4 independent experiments of two to three wells per condition and 20–50 neurons per well. Statistical analysis was performed using Kruskal–Wallis analysis of variance and subsequent Dunn post hoc test. *P<0.05, **P<0.01, ****P<0.0001 significantly different from capsaicin or GPCR mix. GPCR, G protein-coupled receptor; IBS-SSS, IBS Severity Scoring System; ns, not significant; HV, healthy volunteer.

References

    1. Enck P, Aziz Q, Barbara G, et al. . Irritable bowel syndrome. Nat Rev Dis Primers 2016;2:16014. 10.1038/nrdp.2016.14 - DOI - PMC - PubMed
    1. Surdea-Blaga T, Băban A, Dumitrascu DL. Psychosocial determinants of irritable bowel syndrome. World J Gastroenterol 2012;18:616. 10.3748/wjg.v18.i7.616 - DOI - PMC - PubMed
    1. Blanchard EB, Lackner JM, Jaccard J, et al. . The role of stress in symptom exacerbation among IBS patients. J Psychosom Res 2008;64:119–28. 10.1016/j.jpsychores.2007.10.010 - DOI - PubMed
    1. Chang L. The role of stress on physiologic responses and clinical symptoms in irritable bowel syndrome. Gastroenterology 2011;140:761–5. 10.1053/j.gastro.2011.01.032 - DOI - PMC - PubMed
    1. Caparros-Gonzalez RA, Torre-Luque Adela, Romero-Gonzalez B, et al. . Stress during pregnancy and the development of diseases in the offspring: a Systematic-Review and meta-analysis. Midwifery 2021;97:102939. 10.1016/j.midw.2021.102939 - DOI - PubMed

Publication types