. 2022 Oct 14;13(1):6078.
doi: 10.1038/s41467-022-33458-8.

Fibrocytes boost tumor-supportive phenotypic switches in the lung cancer niche via the endothelin system

Affiliations

Fibrocytes boost tumor-supportive phenotypic switches in the lung cancer niche via the endothelin system

Andreas Weigert et al. Nat Commun. .

Abstract

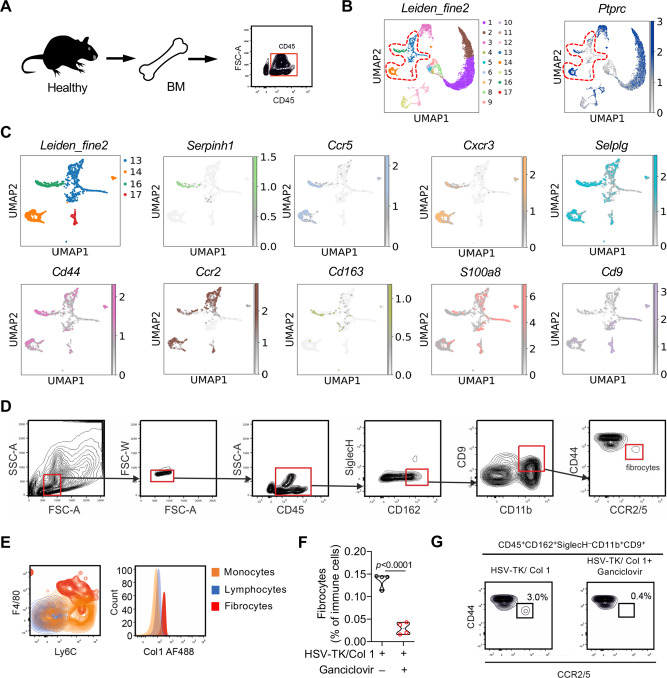
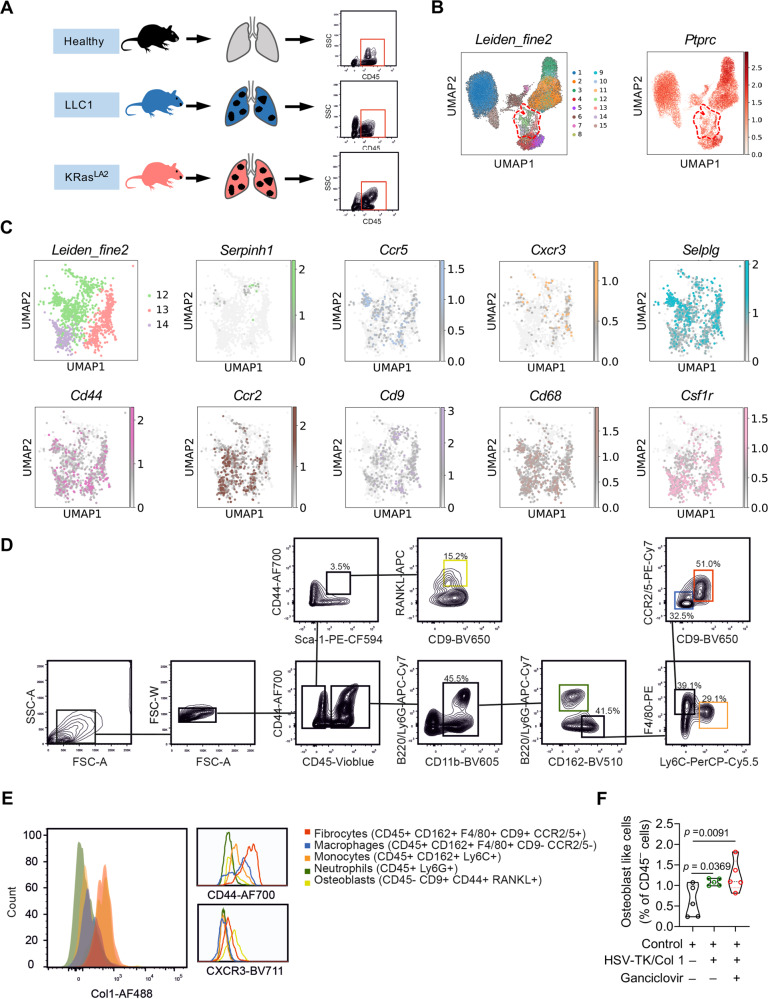
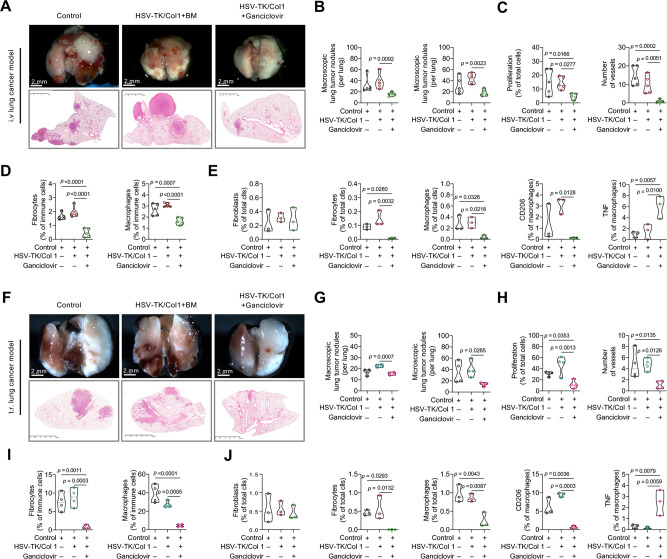
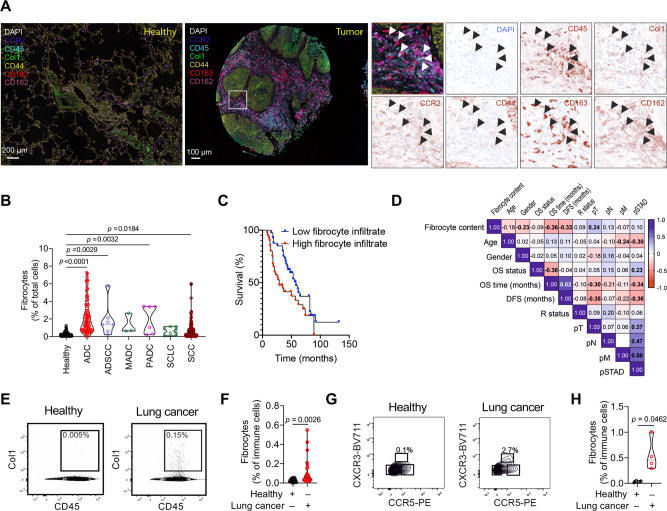
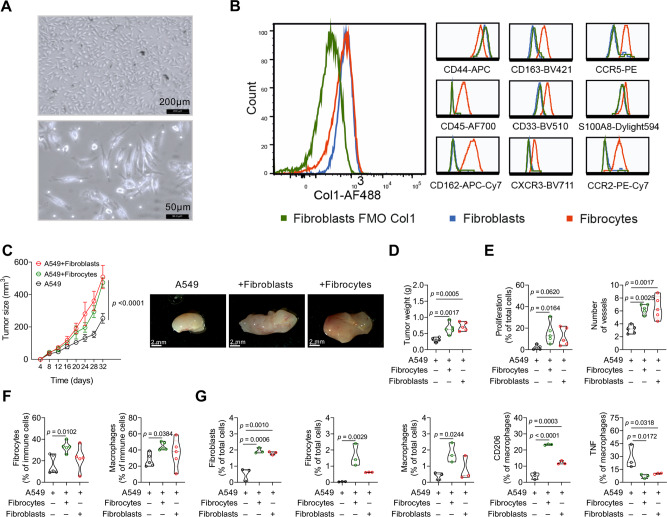
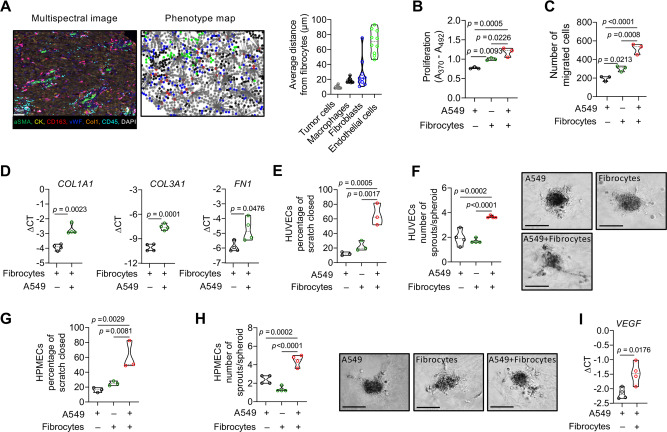
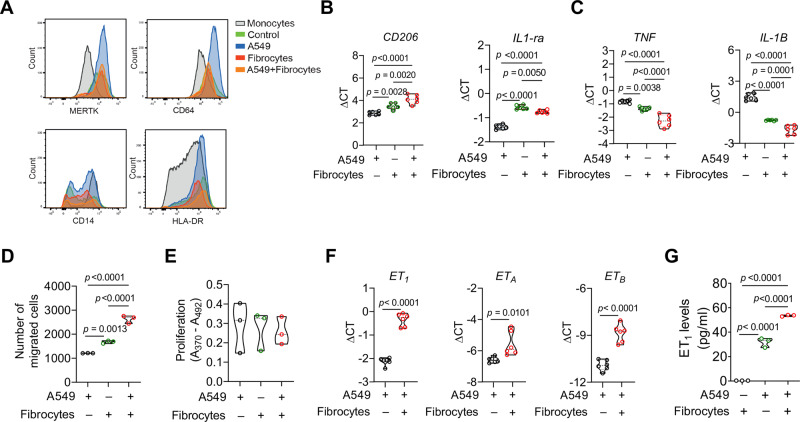
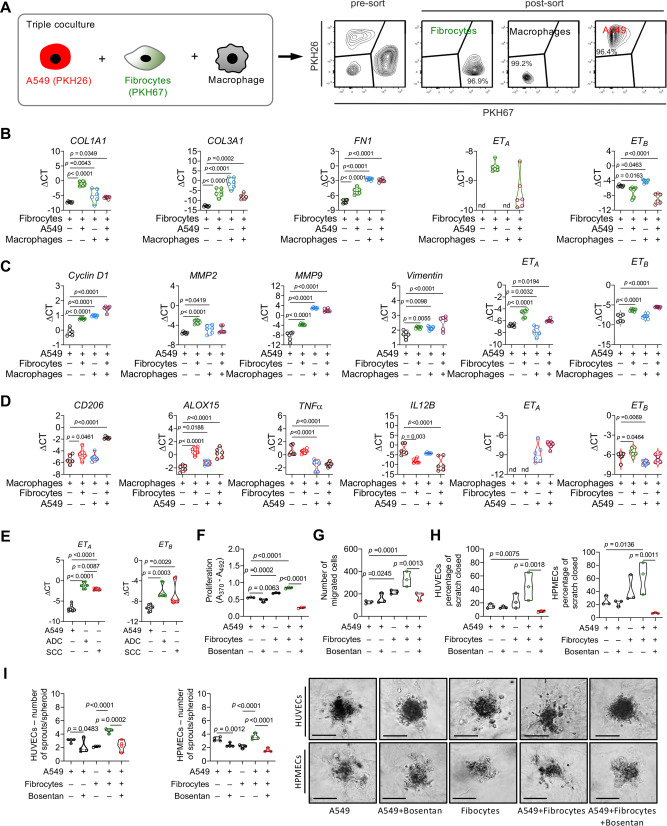
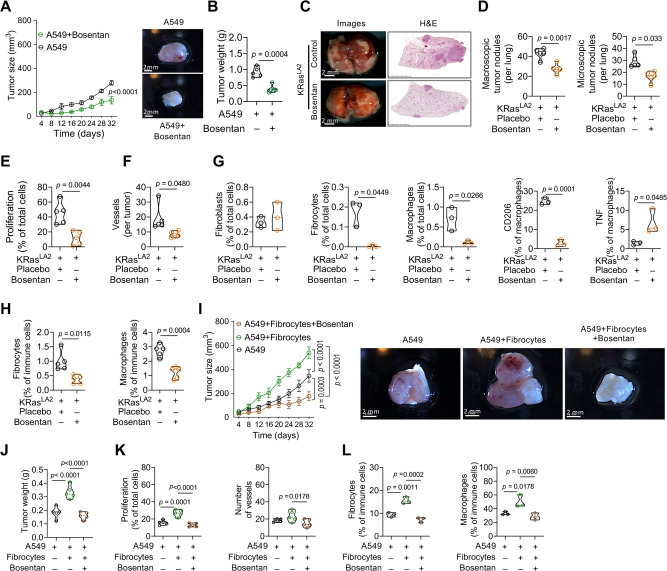
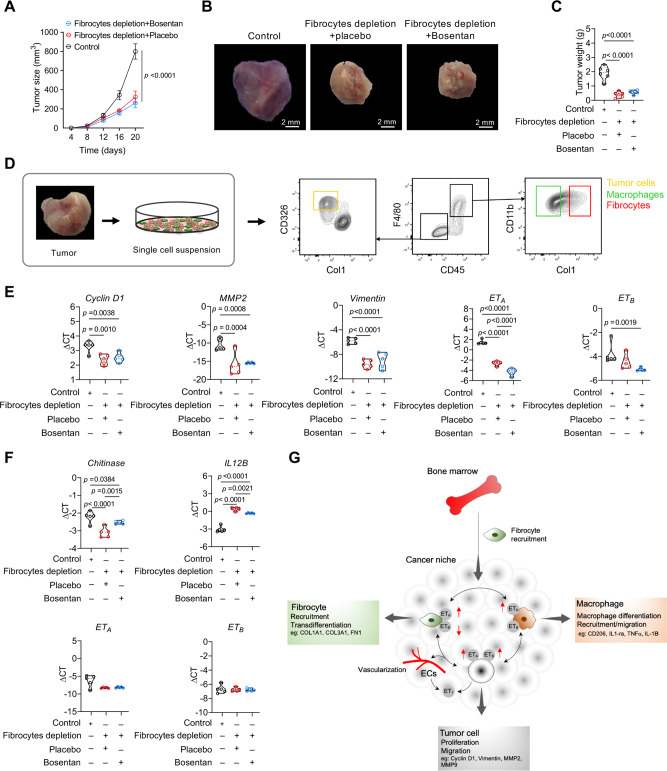
Fibrocytes are bone marrow-derived monocytic cells implicated in wound healing. Here, we identify their role in lung cancer progression/ metastasis. Selective manipulation of fibrocytes in mouse lung tumor models documents the central role of fibrocytes in boosting niche features and enhancing metastasis. Importantly, lung cancer patients show increased number of circulating fibrocytes and marked fibrocyte accumulation in the cancer niche. Using double and triple co-culture systems with human lung cancer cells, fibrocytes, macrophages and endothelial cells, we substantiate the central features of cancer-supporting niche: enhanced cancer cell proliferation and migration, macrophage activation, augmented endothelial cell sprouting and fibrocyte maturation. Upregulation of endothelin and its receptors are noted, and dual endothelin receptor blockade suppresses all cancer-supportive phenotypic alterations via acting on fibrocyte interaction with the cancer niche. We thus provide evidence for a crucial role of fibrocytes in lung cancer progression and metastasis, suggesting targets for treatment strategies.


Conflict of interest statement

The authors declare no competing interests.

Figures

Fig. 1
Fig. 1. Single-cell RNA-seq identifies a combination of fibrocyte specific markers.
A Schematic diagram of CD45+ cell isolation from the bone marrow of a C57BL/6 mouse. B Uniform manifold approximation and projection (UMAP) representation of the data clustered by the Leiden algorithm revealing 17 clusters (left). Expression of Prprc (CD45) is shown in the panel on the right. C UMAP representation of all cells belonging to cluster 13, 14, 16, and 17 by the Leiden algorithm. Expression of Serpinh1, Ccr5, Cxcr3, Selplg, Cd44, Ccr2, Cd163, S100a8 and Cd9 are shown. D Representative FACS contour plots of fibrocytes (CD45+SiglecH, CD162+CD9+CD11b+CD44+CCR2/5+) in bone marrow of C57BL/6 mice. (E) Representative FACS contour plot and histogram showing Ly6C, F4/80, and Col1 expression in monocytes (CD11b+/Ly6G-; orange), lymphocytes (CD11b; blue) and fibrocytes (CD45+/SiglecH, CD162+CD9+CD11b+CD44+CCR2/5+; red). F Quantification of fibrocytes in fibrocyte-depleted mice (HSV-TK/Col1+Ganciclovir) and control mice (HSV-TK/Col1), n = 4. p-values were determined by two-tailed unpaired t–test with Welch’s correction. G Representative FACS contour plots of fibrocytes in fibrocyte-depleted (HSV-TK/Col1+Ganciclovir) and control (HSV-TK/Col1) mice. Source data are provided in the source data file.
Fig. 2
Fig. 2. Lung cancer CD45+ cells scRNA-seq validates identified fibrocyte specific markers.
A Schematic diagram of CD45+ cell isolation from the healthy, LLC1 and KRasLA2 lung tumor models. B UMAP representation of the data clustered by the Leiden algorithm revealing 15 clusters (left). Expression of Prprc (CD45) is shown in the panel on the right. C UMAP representation of all cells belonging to cluster 12, 13, and 14 by the Leiden algorithm. Expression of Serpinh1, Ccr5, Cxcr3, Selplg, Cd44, Ccr2, Cd9, Cd68, and Csf1r are shown. D Gating strategy used to identify fibrocytes, monocytes, macrophages, neutrophils and osteoblast-like cells. Representative flow-cytometric analysis used to identify fibrocytes (CD45+CD11b+CD162+F4/80+CCR2/5+CD9+CD44+Col1+), monocytes (CD45+CD11b+/Ly6C+), macrophages (CD45+CD11b+CD162+F4/80+CCR2/5lo/CD9), neutrophils (CD45+CD11b+Ly6G+) and osteoblast-like cells (CD45CD44+CD9+ RANKL+). E Representative FACS histograms show expression of Col-1, CD44, CXCR3 in fibrocytes (CD45+CD162+F4/80+CD9+CCR2/5+), macrophages (CD45+CD162+F4/80+CD9CCR2/5), monocytes (CD45+CD162+Ly6C+), neutrophils (CD45+Ly6G+) and osteoblast-like cells (CD45CD9+CD44+RANKL+). F Quantification of osteoblast-like cells (CD45CD9+CD44+RANKL+) in the i.v. lung tumor model from fibrocyte-depleted (HSV-TK/Col1+Ganciclovir), HSV-TK/Col1 compared with control lung tumor tissue by FACS analysis. n = 5. p-values were determined by One-way ANOVA with Fisher’s LSD test. Source data are provided in the source data file.
Fig. 3
Fig. 3. Fibrocyte depletion reduces lung tumor progression in LLC1 syngeneic mouse lung tumor models.
A Photographs (upper panel) of whole lung (scale bar, 2 mm) and Hematoxylin and eosin (H&E) stainings (down panel) of lung sections (scale bar, 2.5 mm) that represents intravenous (i.v.) lung metastasis model in fibrocyte-depleted (HSV-TK/Col1+Ganciclovir) and control mice (HSV-TK/Col1+BM and control), n = 5. B Quantification of macroscopic and microscopic lung tumor nodules from fibrocyte-depleted and control lung tumors, n = 5. C Quantification of PCNA+ proliferating cells (n = 5, 7 images per lung tumor) and vWF+ vessels (n = 5, 5 images per lung tumor) from fibrocyte-depleted and control lung tumors by immunohistochemistry. D Quantification of fibrocytes (CD45+CD162+F4/80+CD9+CCR2/5+) and macrophages (CD45+CD162+F4/80+CD9CCR2/5) from fibrocyte-depleted and control lung tumors by FACS analysis, n = 5. E Quantification of fibroblasts (CD45CD163Col1+), fibrocytes (CD45+CD163+CCR2+Col1+), and macrophages (CD45+CD163+CCR2Col1), M2-like (CD206+) and M1-like (TNF+) macrophages from fibrocyte-depleted and control lung tumors by multiplex immunofluorescence, n = 3. F Representative photographs (upper panel) of whole lung (scale bar, 2 mm) and H&E stainings (down panel) of lung sections (scale bar, 2.5 mm) to represent tumor relapse (t.r.) lung metastasis model in fibrocyte-depleted and control mice, n = 5. G Quantification of macroscopic and microscopic lung tumor nodules from fibrocyte-depleted and control lung tumors, n = 5. H Quantification of PCNA+ proliferating cells (n = 4, 7 images per lung tumor) and vWF+ vessels (n = 4, 5 images per lung tumor) from fibrocyte-depleted and control lung tumors by immunohistochemistry. I Quantification of fibrocytes (CD45+CD162+F4/80+CD9+CCR2/5+) and macrophages (CD45+CD162+F4/80+CD9CCR2/5) with the markers described above from fibrocyte-depleted and control lung tumors by FACS analysis, n = 4. J Quantification of fibroblasts (CD45-CD163Col1+), fibrocytes (CD45+CD163+CCR2+Col1+), macrophages (CD45+CD163+CCR2Col1), M2-like (CD206+) and M1-like (TNF+) macrophages from fibrocyte-depleted and control lung tumors by multiplex immunofluorescence, n = 3. BE, GJ p-values were determined using One-way ANOVA with Fisher’s LSD test. Source data are provided in the source data file.
Fig. 4
Fig. 4. High fibrocyte infiltrates negatively correlate with overall and disease-free survival time and positively correlate with pT.
A, B Representative multispectral images of tissue samples from healthy lung and lung tumor tissue (left panel). Tissues were stained with CD45 (cyan) and Col1 (green), CD44 (yellow) and CD163 (red), CCR2 (blue) and CD162 (magenta) antibodies. Nuclei were counterstained with DAPI (white). Right side panel represents zoomed-in images from the squared area. Arrows indicate fibrocytes (CD45+Col1+CD44+CD163+CCR2+CD162+) scale bar, 200 µm (healthy), 100 µm (tumor). Quantification of fibrocytes in lung tissue from healthy donors (n = 59) relative to individuals with adenocarcinoma (ADC, n = 86), adenosquamous carcinoma (ADSCC, n = 7), mucous adenocarcinoma (MADC, n = 3), Papillary adenocarcinoma (PADC, n = 6), small cell carcinoma (SCLC, n = 8) and squamous cell carcinoma (SCC, n = 94) using a TMA. P-values were determined using One-way ANOVA with Fisher’s LSD test. C Kaplan-Meier plots reveal patient survival according to fibrocyte infiltrates in the lung tumor tissue (n = 80). D Heatmap showing the correlation of tissue categories or cell subsets with clinical parameters. Non-parametric correlation analysis (Spearman) was performed, and p-values for survival analyses were calculated using log-rank test (n = 80). Fields with significant correlations (p < 0.05) are indicated in bold script. E Representative contour plots for identification of circulating CD45+Col1+ fibrocytes from PBMCs of healthy donors and lung cancer patients. F Relative quantification of CD45+Col1+ fibrocytes from PBMCs of healthy donors (n = 20) and lung cancer patients (n = 30). p-values were determined using two-tailed unpaired t-test with Welsh’s correction. G Representative contour plots for identification of circulating (CD45+CD33+CD162+CD44+CCR2/5+CXCR3+Col1+) fibrocytes from PBMCs of healthy donors and lung cancer patients. H Relative quantification of fibrocytes from PBMCs of healthy donors (n = 4) and lung cancer patients (n = 4). p-values were determined using two-tailed unpaired t-test. Source data are provided in the source data file.
Fig. 5
Fig. 5. Co-injection of fibrocytes and fibroblasts with lung cancer cells augments tumor growth.
Human fibrocytes were isolated from PBMCs. A Fibrocytes were depicted by bright field microscopy with different magnifications (n = 10, scale bar, 200 µm, and 50 µm). B Representative flow cytometry plots show the purity of fibrocytes using CD45+, Col1+, CD44+, CD163+ CCR5+, CD33+, S100A8+ CD162+, CXCR3+, CCR2+ as markers compared to fibroblasts. Col1 fluorescence minus one (FMO) control indicates efficacy of the Col1 antibody. CG Co-injection of human lung cancer A549 cells with fibrocytes and fibroblasts into BALB/c nude mice. C Tumor size from mice injected with A549 (cancer cells) alone or co-injected with fibrocytes and fibroblasts. p values were determined using Two-way ANOVA with Fisher’s LSD test, n = 5. Representative pictures (scale bar, 2 mm) and (D) tumor weight of tumors from mice injected with A549 or co-injected with fibrocytes and fibroblasts after 32 days. n = 5, p-values were determined using One-way ANOVA with Fisher’s LSD test. E Quantification of PCNA+ proliferating cells (n = 5, 5 images per lung tumor) and vWF+ vessels (n = 5, 5 images per lung tumor) in tumor tissues from mice injected with A549 or co-injected with fibrocytes and fibroblasts by immunohistochemistry. p-values were determined using One-way ANOVA with Fisher’s LSD test. F Quantification of fibrocytes (CD45+CD11b+CD162+F4/80+CCR2/5+CD9+CD44+Col1+) and macrophages (CD45+CD11b+CD162+F4/80+CCR2/5CD9) in tumors from mice injected with A549 or co-injected with fibrocytes and fibroblasts by FACS analysis, n = 5, p-values were determined using One-way ANOVA with Fisher’s LSD test. G Quantification of fibroblasts (CD45CD163Col1+), fibrocytes (CD45+CD163+CCR2+Col1+), and macrophages (CD45+CD163+CCR2Col1), M2-like (CD206+) and M1-like (TNF+) in tumors from mice injected with A549 or co-injected with fibrocytes and fibroblasts by multiplex immunofluorescence, n = 3. p-values were determined using One-way ANOVA with Fisher’s LSD test. Source data are provided in the source data file.
Fig. 6
Fig. 6. Cross-talk between fibrocytes and cancer cells promotes tumor cell proliferation, migration and endothelial cell sprouting.
A Representative multispectral image of cells in the human tumor microenvironment labeled with antibodies against pan-cytokeratin (CK), CD45, Col1, CD163, vWF, aSMA, and DAPI, n = 10. Colored dots in the cell phenotype map shows, cancer cell (gray, n = 52,867), macrophages (block, n = 9468), endothelial cells (green, n = 1376), fibrocytes (red, n = 1174), and fibroblasts (blue, n = 5766). Quantification of (B) proliferation (n = 3 independent experiments, 8 technical replicates) and (C) migration (n = 3 independent experiments, 3 technical replicates) of A549 in the presence of CM from A549 or fibrocytes or A549 + fibrocyte co-cultures. D COL1A1, COL3A1, and FN1 mRNA expression of fibrocytes or A549 + fibrocytes co-cultures, n = 4. E Quantification of scratch assay in HUVECs in presence of CM from A549 or fibrocytes or A549 + fibrocyte co-cultures (n = 3 independent experiments, 3 technical replicates). F Quantification (left) and representative pictures (right, scale bar, 130 µm) of sprouting spheroids of HUVECs in the presence of CM from A549 or fibrocytes or A549 + fibrocyte co-cultures (n = 4 independent experiments, 5 technical replicates). G Quantification of scratch assay in HPMECs in the presence of CM from A549 or fibrocytes or A549 + fibrocyte co-cultures (n = 3 independent experiments, 3 technical replicates). H Quantification (left) and representative pictures (right, scale bar, 130 µm) of sprouting spheroids of HPMECs in the presence of CM from A549 or fibrocytes or A549 + fibrocyte co-cultures. I VEGF mRNA expression of A549 or A549 co-cultured with fibrocytes, n = 4. B, C, EH p-values were determined using One-way ANOVA with Fisher’s LSD test. D, I p-values were determined using Two-tailed unpaired t-test with Welsh’s correction Unpaired t-test. Source data are provided in the source data file.
Fig. 7
Fig. 7. Cross-talk between fibrocytes and cancer cells promotes macrophage activation, migration and endothelial system in cancer cells.
A FACS analysis of MERTK, CD64, CD14 and HLA-DR cell surface expression on monocytes or monocyte-derived macrophages. The control (green curve) corresponds to macrophages differentiated with human serum. B, C Expression of macrophage markers CD206, IL1-ra, TNF, and IL-1B in macrophages incubated with CM from A549 or A549 + fibrocytes co-cultures, n = 6. D Migration (n = 3 independent experiments, 3 technical replicates) and (E) proliferation (n = 3 independent experiments, 8 technical replicates) of macrophages incubated with CM from A549 or fibrocytes or A549 + fibrocyte co-cultures. E ET1, ETA and ETB mRNA expression in A549 or A549 + fibrocyte coculture, n = 6. G Endothelin levels of A549 or fibrocytes or A549 + fibrocytes CM, n = 3. BE, G P-values were determined using One-way ANOVA with Fisher’s LSD test. F P-values were determined using two-tailed unpaired t-test with Welsh’s correction. Source data are provided in the source data file.
Fig. 8
Fig. 8. Triple cross-talk among fibrocytes, cancer cells and macrophages affect tumor cell, macrophage and fibroblast phenotypes and Bosentan inhibits tumor cell proliferation and migration, and endothelial cell sprouting.
A Schematic experimental plan showing fibrocytes and A549 labeled with membrane dyes (PKH26 and PKH67) and co-cultured with unlabeled macrophages. Cell populations were later separated by FACS sorting. B mRNA expression of COL1A1, COL3A1, FN1, ETA and ETB in fibrocytes co-cultured A549 or macrophages or A549 + macrophages, n = 6. C mRNA expression of Cyclin D1, MMP2, MMP9, Vimentin, ETA and ETB in A549 cells co-cultured fibrocytes or macrophages or fibrocytes+macrophages. D mRNA expression of CD206, ALOX15, TNFα, IL12B, ETA and ETB in macrophages co-cultured fibrocytes or A549 or fibrocytes or A549 + fibrocytes, n = 6 individual experiments, n = 6. E mRNA expression of ETA and ETB in A549 cells and primary human cancer cells (adenocarcinoma cells, ADC; and squamous cell carcinoma, SCC), n = 8. F, G A549 cells were co-cultured with fibrocytes in the presence and absence of bosentan. F Proliferation (n = 3 independent experiments, 5 technical replicates) and (G) migration (n = 3 independent experiments, 3 technical replicates) of A549 cells after incubation with CM from A549 or fibrocytes and fibrocytes+A549 in the presence and absence of bosentan. H Scratch assay of HUVECs and HPMECs incubated with CM from A549 cells or fibrocytes or fibrocyte + A549 cells in the presence and absence of bosentan (n = 3 independent experiments, 3 technical replicates). I Sprouting assay of HUVECs and HPMECs incubated with CM from A549 cells or fibrocytes or fibrocyte + A549 cells in the presence and absence of bosentan (n = 4 independent experiments, 5 technical replicates). Representative pictures (scale bar, 100 µm) of sprouting spheroids from HUVEC and HPMECs after incubation with CM from A549 cells compared with fibrocytes and fibrocytes co-cultures in the presence and absence of bosentan. BI p-values were determined using One-way ANOVA with Fisher’s LSD test. Source data are provided in the source data file.
Fig. 9
Fig. 9. Dual antagonism of ETA and ETB inhibits primary lung tumor growth.
A Tumor growth curve over 32-days period and tumor images at end of the experiment (scale bar 2 mm) A549 and A549 + bosentan treated tumors, n = 5. B Tumor weight at day 32, A549 and A549 + bosentan, n = 5. C Representative photographs (left; scale bar, 2 mm) of whole lungs and H&E stainings of lung sections (right; scale bar, 2.5 mm) in KRasLA2 mice with or without (placebo) bosentan treatment, n = 5. D Quantification of macroscopic and microscopic lung tumor nodules in the KRasLA2 mice with or without bosentan treatment, n = 5. Quantification of (E) PCNA+ proliferating cells (n = 5, 8 images per lung) and (F) vWF+ vessels (n = 5, 5 images per lung) in KRasLA2 mice with or without bosentan treatment. G Quantification of fibroblasts, fibrocytes, macrophages, M2-like and M1-like macrophages with the markers (as described in Fig. 3 legend) in KRasLA2 mice with or without bosentan treatment, n = 3. H Quantification of fibrocytes and macrophages with the markers in KRasLA2 mice with or without bosentan treatment, n = 5. IL A549 or A549 + fibrocytes were subcutaneously (s.c.) injected in BALB/c nude mice in presence or absence of bosentan. I Tumor growth curve of A549 or A549 + fibrocytes s.c. tumors in presence or absence of bosentan, n = 5. Representative images of the tumors (scale bar, 2 mm). J Tumor weight during 32 days, of A549 or A549 + fibrocytes s.c. tumors in presence or absence of bosentan, n = 5. Quantification of the (K) PCNA+ proliferating cells (n = 5, 8 images per tumor), CD31+ vessels (n = 5, 5 images per tumor) in A549 or A549 + fibrocytes tumors in presence or absence of bosentan. L Quantification of fibrocytes and macrophages with the markers in A549 or A549 + fibrocytes s.c. tumors in presence or absence of bosentan, n = 3. A, I p-values were determined using two-way ANOVA with Bonferroni’s multiple comparison, B, DH p-values were determined using two-tailed unpaired t-test with Welch’s correction and (JL) p-values were determined using One-way ANOVA with Fisher’s LSD test. Source data are provided in the source data file.
Fig. 10
Fig. 10. Dual antagonist of ETA and ETB inhibits tumor growth mainly via fibrocytes.
AC Mice that were transplanted with HSV-TK/Col1 bone marrow were subcutaneously (s.c.) instilled with LLC1 cells and treated with bosentan. A Tumor growth curve of control or fibrocyte depleted tumors+placebo and fibrocyte depleted tumors+bosentan during 20 days, n = 6. p-values were determined using Two-way ANOVA with Bonferroni’s multiple comparison. B Representative images of tumor size (scale bar, 2 mm). C Tumor weight was measured on day 20 of control or fibrocyte depleted tumors+placebo and fibrocyte depleted tumors + bosentan, n = 6. D Schematic experimental setup indicating the FACS-sorting strategy to isolate cancer cells, fibrocytes and macrophages from control or fibrocyte depleted tumors + placebo and fibrocyte depleted tumors+bosentan. E mRNA expression of Cyclin D1, MMP2, Vimentin, ETA and ETB in sorted cancer cells from control or fibrocyte depleted tumors + placebo and fibrocyte depleted tumors + bosentan, n = 5. F mRNA expression of Chitinase, IL12B, ETA and ETB in sorted macrophages from control or fibrocyte depleted tumors + placebo and fibrocyte depleted tumors + bosentan, n = 5. G Schematic diagram of the mechanism of cross-talk among fibrocytes, cancer cells and macrophages in the lung cancer niche. Increased fibrocyte recruitment and subsequent accumulation in the lung tissues lead to interaction with cancer cells and tumor microenvironmental cells, and activation of the endothelin and its receptors that supports tumor cell growth, immune modulation, and angiogenesis. ETA Endothelin receptor A, ETB Endothelin receptor B, ET1 Endothelin 1, COL1A1 Collagen 1A1, COL3A1 Collagen 3A1, FN1 Fibronectin 1, MMP2 Matrix metalloprotease 2, MMP9 Matrix metalloprotease 9, IL-1-ra Interleukin 1 receptor antagonist, TNF-α Tumor necrosis factor-alpha, IL-1B Interleukin-1 beta. A, C, E, F p-values were determined using One-way ANOVA with Fisher’s LSD test. Source data are provided in the source data file.

Similar articles

Cited by

References

    1. Bucala R, Spiegel LA, Chesney J, Hogan M, Cerami A. Circulating fibrocytes define a new leukocyte subpopulation that mediates tissue repair. Mol. Med. 1994;1:71–81. doi: 10.1007/BF03403533. - DOI - PMC - PubMed
    1. Quan TE, Cowper S, Wu SP, Bockenstedt LK, Bucala R. Circulating fibrocytes: Collagen-secreting cells of the peripheral blood. Int J. Biochem. Cell Biol. 2004;36:598–606. doi: 10.1016/j.biocel.2003.10.005. - DOI - PubMed
    1. Chesney J, Metz C, Stavitsky AB, Bacher M, Bucala R. Regulated production of type I collagen and inflammatory cytokines by peripheral blood fibrocytes. J. Immunol. 1998;160:419–425. - PubMed
    1. Florez-Sampedro L, Song S, Melgert BN. The diversity of myeloid immune cells shaping wound repair and fibrosis in the lung. Regeneration (Oxf.) 2018;5:3–25. doi: 10.1002/reg2.97. - DOI - PMC - PubMed
    1. Shipe R, et al. Number, activation, and differentiation of circulating fibrocytes correlate with asthma severity. J. Allergy Clin. Immunol. 2016;137:750–757. doi: 10.1016/j.jaci.2015.07.037. - DOI - PMC - PubMed

Publication types