. 2022 Oct 14;13(1):6069.
doi: 10.1038/s41467-022-33733-8.

Opposing functions of circadian protein DBP and atypical E2F family E2F8 in anti-tumor Th9 cell differentiation

Affiliations

Opposing functions of circadian protein DBP and atypical E2F family E2F8 in anti-tumor Th9 cell differentiation

Sang-A Park et al. Nat Commun. .

Abstract

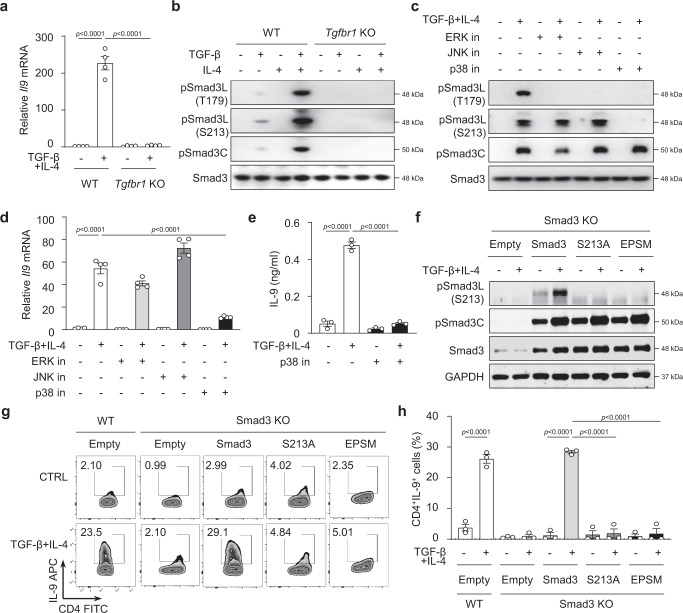
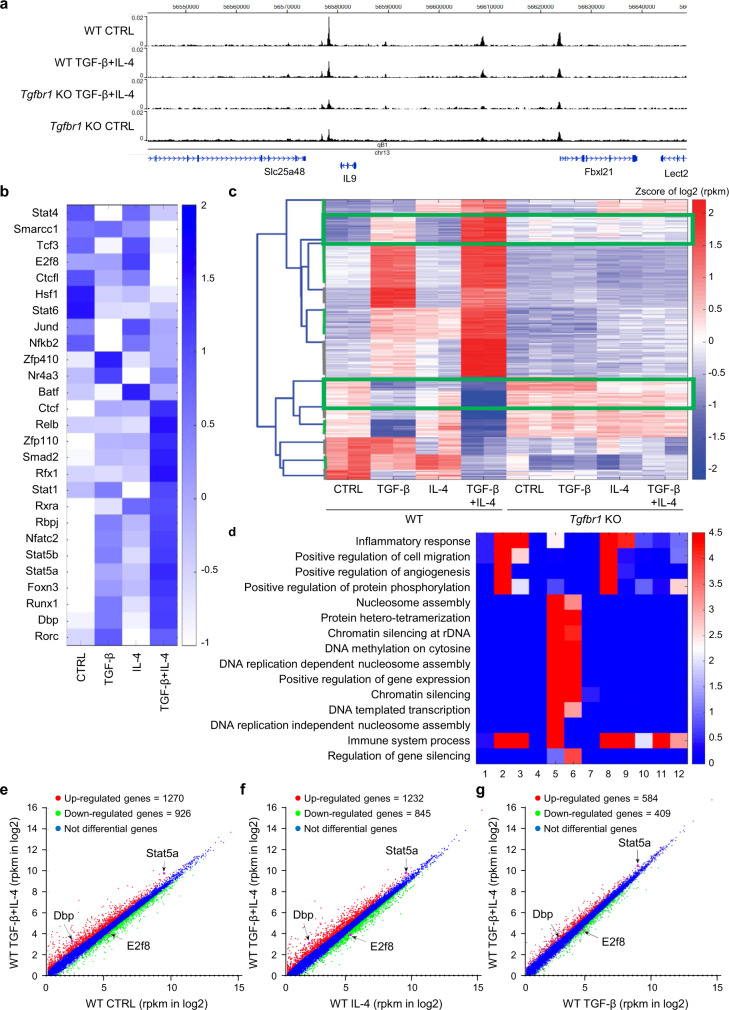
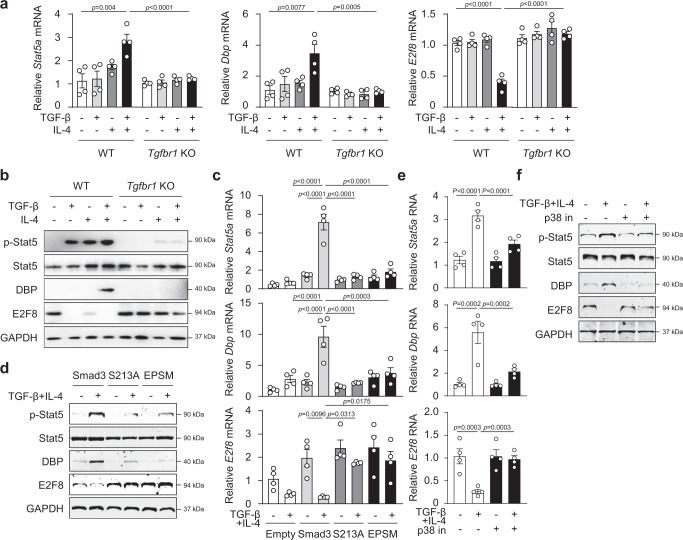
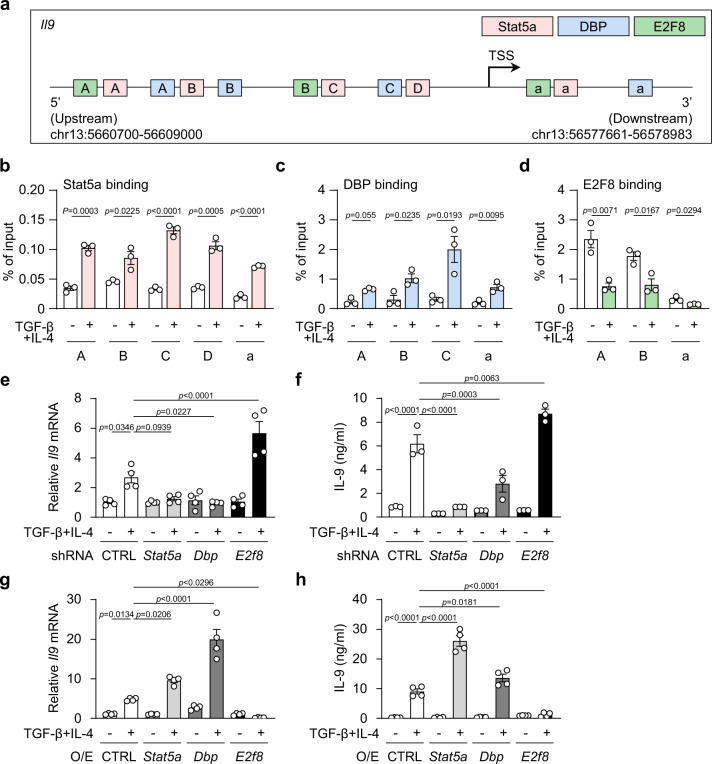
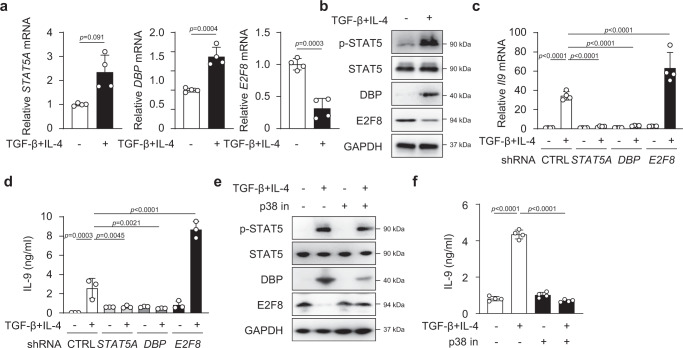
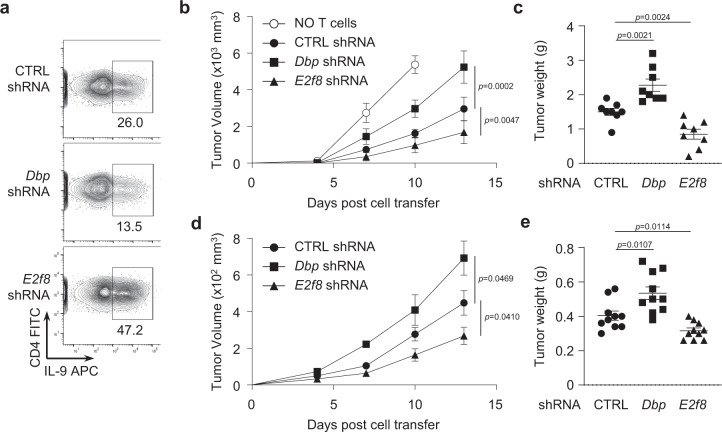
Interleukin-9 (IL-9)-producing CD4+ T helper cells (Th9) have been implicated in allergy/asthma and anti-tumor immunity, yet molecular insights on their differentiation from activated T cells, driven by IL-4 and transforming growth factor-beta (TGF-β), is still lacking. Here we show opposing functions of two transcription factors, D-binding protein (DBP) and E2F8, in controlling Th9 differentiation. Specifically, TGF-β and IL-4 signaling induces phosphorylation of the serine 213 site in the linker region of the Smad3 (pSmad3L-Ser213) via phosphorylated p38, which is necessary and sufficient for Il9 gene transcription. We identify DBP and E2F8 as an activator and repressor, respectively, for Il9 transcription by pSmad3L-Ser213. Notably, Th9 cells with siRNA-mediated knockdown for Dbp or E2f8 promote and suppress tumor growth, respectively, in mouse tumor models. Importantly, DBP and E2F8 also exhibit opposing functions in regulating human TH9 differentiation in vitro. Thus, our data uncover a molecular mechanism of Smad3 linker region-mediated, opposing functions of DBP and E2F8 in Th9 differentiation.


Conflict of interest statement

The authors declare no competing interests.

Figures

Fig. 1
Fig. 1. Phosphorylation of Smad3 linker Ser213 site is essential for Th9 differentiation by TGF-β and IL-4 stimulation.
a Expression of Il9 mRNA in naïve CD4+ T cells from Tgfbr1f/f ER-cre+ mice that had been treated with Oil (WT) or tamoxifen (Tgfbr1 KO) for 5 days stimulated with TGF-β plus IL-4 for 24 h. The results are presented relative to those of the control gene Hprt. b Western blot analysis of phosphorylated linker region Thr179 (pSmad3L-T179), Ser213 (pSmad3L-S213) sites and C-terminal (pSmad3C) of Smad3 and total Smad3 (Smad3) in WT and Tgfbr1 KO CD4+ T cells cultured with medium, TGF-β, IL-4 or TGF-β plus IL-4 for 2 h. c Western blotting of Smad3 phosphorylation in normal CD4+ T cells pre-treated with the indicated inhibitors and then cultured with TGF-β plus IL-4 for 2 h. d Real time RT-PCR analysis of Il9 mRNA in CD4+ T cells pre-treated with the indicated inhibitors as in c and then cultured with TGF-β plus IL-4 for 24 h. e IL-9 protein in cell culture supernatants were measured by ELISA in CD4+ T cells cultured with TGF-β plus IL-4 with or without p38 inhibitor for 72 h. f Phosphorylation of indicated Smad3 linker regions and C-terminal in Smad3−/− CD4+ T cells transfected with intact WT Smad3, and S213A- or EPSM-Smad3 mutants (scheme depicted in Supplementary Fig. 2a–c), followed by TGF-β plus IL-4 stimulation for 2 h. g Intracellular staining of IL-9 by flow cytometry as in f after 72 h. h Summary of results in g. a, d These data were representative of four independent experiments or b, c, eh pooled from three experiments. These data were analyzed by one-way ANOVA with Tukey’s test. Graphs show the mean ± SEM. Source data are provided as a Source Data file.
Fig. 2
Fig. 2. Identification of Stat5a, Dbp and E2f8 as critical transcription factors for Il9 gene transcription.
a A genome browser showed the genome wide profiles of DNase-seq data in four conditions including Control WT, WT TGF-β + IL-4, Tgfbr1 KO TGF-β + IL-4 and Control Tgfbr1 KO. b A heatmap showed the gene expression levels for the enriched transcription factor motifs for Il9 in four conditions including WT Control, TGF-β, IL-4 and TGF-β + IL4. c A heatmap showed the clustering results (12 clusters in Supplementary Data 2) of the RNA-seq data in right conditions. The heatmap represents the Z-score of log 2-transformed rpkm expression levels. Two specific clusters were selected (with green border line) based on the distinct difference between WT TGF-β + IL-4 and all other conditions. d A heatmap showed the enriched GO terms for genes in each of the 12 clusters. e A scatter plot showed the comparison between the gene expression level of WT TGF-β + IL-4 versus control. f A scatter plot showed the comparison between the gene expression level of WT TGF-β + IL-4 versus WT IL-4. g A scatter plot showed the comparison between the gene expression level of WT TGF-β + IL-4 versus WT TGF-β.
Fig. 3
Fig. 3. TGF-β plus IL-4 signaling increases DBP but decreases E2F8 during Th9 differentiation.
a RT-PCR analysis and b Western blotting of Stat5, DBP and E2F8 in WT and Tgfbr1 KO CD4+ T cells cultured with TGF-β, IL-4 or TGF-β plus IL-4. Expression of Stat5a, DBP and E2F8 during TGF-β and IL-4 stimulation in WT, S213A- or EPSM-Smad3 mutants transfected CD4+ T cells c, d or p38 inhibitor-pretreated CD4+ T cells e, f as in a, b. a, c, e The data were representative of four independent experiments or b, d, f three experiments. Data were analyzed by two-way ANOVA with Tukey’s test. Graphs show the mean ± SEM. Source data are provided as a Source Data file.
Fig. 4
Fig. 4. Increased DBP but decreased E2F8 binding at Il9 gene during Th9 differentiation.
a Identification of Stat5a, DBP and E2F8 binding elements in the Il9 gene. bd ChIP assay analysis for binding of Stat5a, DBP and E2F8 to the promoter region of the Il9 during Th9 differentiation. e, g Expression of Il9 mRNA and f, h ELISA of IL-9 and in CD4+ T cells transfected with Stat5a, Dbp or E2f8 specific shRNA e, f or overexpressing virus g, h followed by stimulation with TGF-β plus IL-4. O/E, Overexpressed. bd, f These data were representative of three independent experiments or e, g, h four experiments. These data were analyzed by b, d two-tailed unpaired Student’s t test or eh one-way ANOVA with Tukey’s test. Graphs show the mean ± SEM. Source data are provided as a Source Data file.
Fig. 5
Fig. 5. The functions of DBP and E2F8 in human TH9 differentiation.
a RT-PCR analysis and b Western blotting of STAT5, DBP and E2F8 in human CD4+ T cells cultured with TGF-β plus IL-4 for 5 days. c Expression of Il9 mRNA after 3 days and d ELISA of IL-9 after 5 days in human CD4+ T cells transfected with STAT5A, DBP or E2F8 specific siRNA, followed by stimulation with TGF-β plus IL-4. e Western blotting of STAT5, DBP and E2F8 and f IL-9 protein were measured by ELISA in human CD4+ T cells cultured with TGF-β plus IL-4 with or without p38 inhibitor for 5 days. a, c, f These data are representative of four independent experiments or b, d, e three experiments. These data were analyzed by a two-tailed unpaired Student’s t-test or c, d, f one-way ANOVA with Tukey’s test. Graphs show the mean ± SEM. Source data are provided as a Source Data file.
Fig. 6
Fig. 6. DBP and E2F8 play opposite roles of Th9 cell mediated anti-tumor activity in vivo.
a Intracellular staining of IL-9 produced by CD4+ T cells with indicated shRNA transfection before cells were transferred into Rag1−/− mice. Tumor growth over time in 8-week-old male and female Rag1−/− mice given intravenous transfer of CTRL, Dbp or E2f8 shRNA treated CD4+ T cells along with simultaneous subcutaneous injection of b B16 melanoma cells (male: n = 5 and female: n = 3 mice per group) or d MCA205 fibrosarcoma cells (male: n = 5 and female: n = 5 mice per group) on day 0. c, e Tumor weight at the end of experiments from b and d. These data were analyzed by two-tailed unpaired Student’s t-test. These data were representative of two independent experiments. Graphs show the mean±SEM. Source data are provided as a Source Data file.

Similar articles

Cited by

References

    1. Dardalhon V, et al. IL-4 inhibits TGF-beta-induced Foxp3+ T cells and, together with TGF-beta, generates IL-9+ IL-10+ Foxp3(-) effector T cells. Nat. Immunol. 2008;9:1347–1355. doi: 10.1038/ni.1677. - DOI - PMC - PubMed
    1. Schmitt E, et al. IL-9 production of naive CD4+ T cells depends on IL-2, is synergistically enhanced by a combination of TGF-beta and IL-4, and is inhibited by IFN-gamma. J. Immunol. 1994;153:3989–3996. - PubMed
    1. Veldhoen M, et al. Transforming growth factor-beta ‘reprograms’ the differentiation of T helper 2 cells and promotes an interleukin 9-producing subset. Nat. Immunol. 2008;9:1341–1346. doi: 10.1038/ni.1659. - DOI - PubMed
    1. Gomez-Rodriguez J, et al. Itk is required for Th9 differentiation via TCR-mediated induction of IL-2 and IRF4. Nat. Commun. 2016;7:10857. doi: 10.1038/ncomms10857. - DOI - PMC - PubMed
    1. Staudt V, et al. Interferon-regulatory factor 4 is essential for the developmental program of T helper 9 cells. Immunity. 2010;33:192–202. doi: 10.1016/j.immuni.2010.07.014. - DOI - PubMed

Publication types