. 2022 Oct 14;13(1):6081.
doi: 10.1038/s41467-022-33824-6.

The gut microbe Bacteroides fragilis ameliorates renal fibrosis in mice

Affiliations

The gut microbe Bacteroides fragilis ameliorates renal fibrosis in mice

Wei Zhou et al. Nat Commun. .

Abstract

Renal fibrosis is an inevitable outcome of various manifestations of progressive chronic kidney diseases (CKD). The need for efficacious treatment regimen against renal fibrosis can therefore not be overemphasized. Here we show a novel protective role of Bacteroides fragilis (B. fragilis) in renal fibrosis in mice. We demonstrate decreased abundance of B. fragilis in the feces of CKD patients and unilateral ureteral obstruction (UUO) mice. Oral administration of live B. fragilis attenuates renal fibrosis in UUO and adenine mice models. Increased lipopolysaccharide (LPS) levels are decreased after B. fragilis administration. Results of metabolomics and proteomics studies show decreased level of 1,5-anhydroglucitol (1,5-AG), a substrate of SGLT2, which increases after B. fragilis administration via enhancement of renal SGLT2 expression. 1,5-AG is an agonist of TGR5 that attenuates renal fibrosis by inhibiting oxidative stress and inflammation. Madecassoside, a natural product found via in vitro screening promotes B. fragilis growth and remarkably ameliorates renal fibrosis. Our findings reveal the ameliorative role of B. fragilis in renal fibrosis via decreasing LPS and increasing 1,5-AG levels.


Conflict of interest statement

The authors declare no competing interests.

Figures

Fig. 1
Fig. 1. The anti-fibrotic effects of B fragilis in UUO model.
A The relative abundance of B. fragilis in the CKD and control groups from Renmin Hospital of Wuhan University measured by qPCR (n = 10). ***p = 0.0005. B The relative abundance of B. fragilis in the CKD and control groups from the Putuo People’s Hospital measured by qPCR (n = 15). ***p < 0.0001. Box plots show center line as median, whiskers show maxima and minima, and box limits show upper and lower quartiles. C Pearson’s analysis of the correlations between B. fragilis level and the blood urea nitrogen (BUN) and serum creatinine (Scr). D Picture of left kidneys of mice with different treatments (n = 3). E The renal index (mg/g) was calculated by dividing the wet renal weight by the body weight (n = 6). ***p = 0.0001 for E: Sham vs. UUO, p = 0.9682 for E: Sham vs. UUO + BF, ***p  <  0.0001 for E: Sham vs. UUO + HBF, ###p = 0.0006 for E: UUO vs. UUO + BF, p = 0.9992 for E: UUO vs. UUO + HBF. F Biochemical parameters including blood urea nitrogen (BUN), serum creatinine (Scr), serum total cholesterol (TC), triglyceride (TG) in each of mice (n = 5). ***p = 0.0003 for BUN: Sham vs. UUO, p = 0.2261 for BUN: Sham vs. UUO + BF, ***p = 0.0006 for BUN: Sham vs. UUO + HBF, #p = 0.0246 for BUN: UUO vs. UUO + BF, p = 0.9992 for BUN: UUO vs. UUO + HBF; *p = 0.0105 for SCR: Sham vs. UUO, #p = 0.0436 for SCR: UUO vs. UUO + BF; *p = 0.0152 for TC: Sham vs. UUO, p = 0.9999 for TC: Sham vs. UUO + BF, *p = 0.0443 for TC: Sham vs. UUO + HBF, #p = 0.0240 for TC: UUO vs. UUO + BF, p = 0.9915 for TC: UUO vs. UUO + HBF; ***p = 0.0007 for TG: Sham vs. UUO, p = 0.8042 for TG: Sham vs. UUO + BF, **p = 0.0031 for TG: Sham vs. UUO + HBF, ##p = 0.0070 for TG: UUO vs. UUO + BF, p = 0.9609 for TG: UUO vs. UUO + HBF. G Representative immunofluorescence staining of Vimentin and E-Cadherin in kidneys of mice as indicated (scale bar, 20 μm. magnification, ×200). H Quantitative analysis of Fig. 1G (n = 3). ***p  <  0.0001 for VIMENTIN: Sham vs. UUO, p = 0.0896 for VIMENTIN: Sham vs. UUO + BF, ###p  < 0.0001 for VIMENTIN: UUO vs. UUO + BF; ***p  <  0.0001 for E-CADHERIN: Sham vs. UUO, **p = 0.0011 for E-CADHERIN: Sham vs. UUO + BF, ##p = 0.0017 for E-CADHERIN: UUO vs. UUO + BF. I Kidney expression of FN, Col I and α-SMA from Sham, UUO and B. fragilis -treated UUO mice, assayed by Western blot. J Quantitative analysis of Fig. 1I (n = 3). ***p  <  0.0001 for FN: Sham vs. UUO, p = 0.3994 for FN: Sham vs. UUO + BF, ###p = 0.0002 for FN: UUO vs. UUO + BF; **p = 0.0026 for COL-1: Sham vs. UUO, p = 0.7546 for COL-1: Sham vs. UUO + BF, ##p = 0.0062 for COL-1: UUO vs. UUO + BF; ***p  <  0.0001 for α-SMA: Sham vs. UUO, **p = 0.0024 for α-SMA: Sham vs. UUO + BF, ###p  < 0.0001 for α-SMA: UUO vs. UUO + BF. K Representative photomicrographs of the H&E staining and Masson’s trichrome staining from left kidneys of Sham, UUO, and B. fragilis -treated UUO mice (H&E and Masson’s staining; scale bar, 100 μm, magnification, ×200). L Bar graph depicts renal injury scores and renal interstitial fibrosis scores based on H&E staining or Masson’s trichrome staining (n = 3). ***p  < 0.0001 for injury scores: Sham vs. UUO, **p = 0.0064 for injury scores: Sham vs. UUO + BF, ***p  < 0.0001 for injury scores: Sham vs. UUO + HBF, ##p = 0.0018 for injury scores: UUO vs. UUO + BF, p  > 0.9999 for injury scores: UUO vs. UUO + HBF; ***p  < 0.0001 for fibrosis scores: Sham vs. UUO, **p = 0.0085 for fibrosis scores: Sham vs. UUO + BF, ***p  < 0.0001 for fibrosis scores: Sham vs. UUO + HBF, ##p = 0.0041 for fibrosis scores: UUO vs. UUO + BF, p  > 0.9999 for fibrosis scores: UUO vs. UUO + HBF. Data are presented as mean ± SD. Comparison in A, B were performed with a two-tailed Mann-Whitney U test. Comparisons in E, F, H, J, and L were compared using One-Way ANOVA followed by Sidak’s multiple comparisons test. *P < 0.05, **P < 0.01, ***P < 0.001 (compared with sham group), #P < 0.05, ##P < 0.01, ###P < 0.001 (compared with UUO group). Individual data points are independent biological replicates unless otherwise stated.
Fig. 2
Fig. 2. Inhibition of oxidative stress and the TGF-β/Smad signaling pathway by B. fragilis and the discovery of 1,5-AG by untargeted and targeted metabolomics.
A Kidney expression of TGF-β/Smad signaling pathway from Sham, UUO and B fragilis-treated UUO mice, assayed by Western blot. B Quantitative analysis of panel A (n = 3). **p = 0.0070 for TGF-β: Sham vs. UUO, p = 0.9998 for TGF-β: Sham vs. UUO + BF, ##p = 0.0076 for TGF-β: UUO vs. UUO + BF; **p = 0.0049 for SMAD2: Sham vs. UUO, p = 0.2267 for SMAD2: Sham vs. UUO + BF, #p = 0.0470 for SMAD2: UUO vs. UUO + BF; *p = 0.0128 for SMAD3: Sham vs. UUO, p = 0.6852 for SMAD3: Sham vs. UUO + BF, #p = 0.0444 for SMAD3: UUO vs. UUO + BF. C Representative Western blot of Nrf2, Keap1, 12-LOX, Rac-1. D Quantitative analysis of panel C (n = 3). *p = 0.0118 for NRF2: Sham vs. UUO, p = 0.4377 for NRF2: Sham vs. UUO + BF, #p = 0.0241 for NRF2: UUO vs. UUO + BF; **p = 0.0065 for KEAP1: Sham vs. UUO, *p = 0.0290 for KEAP1: Sham vs. UUO + BF, #p = 0.0276 for KEAP1: UUO vs. UUO + BF, Comparison in KEAP1 were performed with a two-tailed Student’s t test; **p = 0.0010 for 12-LOX: Sham vs. UUO, p = 0.5931 for 12-LOX: Sham vs. UUO + BF, ##p = 0.0029 for 12-LOX: UUO vs. UUO + BF; **p = 0.0014 for RAC1: Sham vs. UUO, *p = 0.0455 for RAC1: Sham vs. UUO + BF, #p = 0.0351 for RAC1: UUO vs. UUO + BF. E OPLS-DA in the indicated groups (n = 7). F Disturbed metabolic pathways for differential metabolites from sham vs UUO groups. G Heatmap of the differential metabolites. The asterisk indicates that the metabolite can be regulated by B. fragilis. H The concentration of 1,5-AG in serum from Sham, UUO and B. fragilis-treated UUO groups using GC-MS based targeted metabolomics (n = 7). *p = 0.0138 for H: Sham vs. UUO, p = 0.9746 for H: Sham vs. UUO + BF, #p = 0.0317 for H: UUO vs. UUO + BF. I OPLS-DA plot of CKD patients (n = 115) and healthy controls (n = 113) of serum from the Affiliated Hospital of Nanjing University of Chinese Medicine through GC-MS based untargeted metabolomics. J GC-MS based targeted metabolomics of 1,5-AG in the sera of CKD and healthy controls (n = 110) from Ningbo Hospital of Zhejiang University. ***p  < 0.0001. K LC-MS based targeted metabolomics of 1,5-AG in the sera of CKD and controls (n = 100) from Putuo People’s Hospital. ***p  < 0.0001. Box plots show center line as median, whiskers show maxima and minima, and box limits show upper and lower quartiles. Data are presented as mean ± SD. Comparison in J, K were performed with a two-tailed Mann-Whitney U test. Comparisons in B, D and H were compared using One-Way ANOVA followed by Sidak’s multiple comparisons test. *P < 0.05, **P < 0.01, ***P < 0.001 (compared with sham or healthy control group), #P < 0.05, ##P < 0.01, ###P < 0.001 (compared with UUO group). Individual data points are independent biological replicates unless otherwise stated.
Fig. 3
Fig. 3. The anti-fibrotic effects of 1, 5-AG in UUO model.
A Picture of left kidneys of mice with different treatments (n = 3). B The renal index (mg/g) (n = 6). ***p = 0.0008 for B: Sham vs. UUO, p = 0.3372 for B: Sham vs. 1, 5-AG, #p = 0.0221 for B: UUO vs. 1, 5-AG. C Western blots show fibrotic protein expression in kidneys from all groups. D Quantitative analysis of fibrotic protein (n=3). ***p = 0.0002 for FN: Sham vs. UUO, p = 0.0637 for FN: Sham vs. 1, 5-AG, ##p = 0.0017 for FN: UUO vs. 1, 5-AG; **p = 0.0024 for COL-1: Sham vs. UUO, p = 0.9068 for COL-1: Sham vs. 1, 5-AG, ##p = 0.0043 for COL-1: UUO vs. 1, 5-AG; ***p < 0.0001 for α-SMA: Sham vs. UUO, *p = 0.0170 for α-SMA: Sham vs. 1, 5-AG, ##p = 0.0011 for α-SMA: UUO vs. 1, 5-AG. E Biochemical parameters including BUN, Scr, TC, TG in each of mice (n = 5). ***p = 0.0002 for BUN: Sham vs. UUO, *p = 0.0319 for BUN: Sham vs. 1, 5-AG, #p = 0.0361 for BUN: UUO vs. 1, 5-AG; *p = 0.0146 for SCR: Sham vs. UUO, p = 0.2637 for SCR: Sham vs. 1, 5-AG, #p = 0.0309 for SCR: UUO vs. 1, 5-AG, Comparison in SCR were performed with a two-tailed Student’s t test; *p = 0.0159 for TC: Sham vs. UUO, p = 0.9351 for TC: Sham vs. 1, 5-AG, #p = 0.0429 for TC: UUO vs. 1, 5-AG; **p = 0.0038 for TG: Sham vs. UUO, p = 0.9255 for TG: Sham vs. 1, 5-AG, #p = 0.0107 for TG: UUO vs. 1, 5-AG. F Representative photomicrographs of the H&E staining and Masson’s trichrome staining from left kidneys of Sham, UUO, and 1, 5-AG-treated UUO mice (H&E and Masson’s staining; scale bar, 100 μm; magnification, ×200). G Bar graphs depict renal injury scores and renal interstitial fibrosis scores based on H&E staining or Masson’s trichrome staining (n = 3). **p = 0.0012 for injury scores: Sham vs. UUO, *p = 0.0423 for injury scores: Sham vs. 1, 5-AG, #p = 0.0332 for injury scores: UUO vs. 1, 5-AG; ***p = 0.0003 for fibrosis scores: Sham vs. UUO, *p = 0.0139 for fibrosis scores: Sham vs. 1, 5-AG, ##p = 0.0079 for fibrosis scores: UUO vs. 1, 5-AG. H Kidney expression of TGF-β/Smad signaling pathway from Sham, UUO and 1, 5-AG-treated UUO mice, assayed by Western blot. (I) Quantitative analysis of Fig. 3H (n = 3). **p = 0.0031 for TGF-β: Sham vs. UUO, p = 0.4396 for TGF-β: Sham vs. 1, 5-AG, #p = 0.0138 for TGF-β: UUO vs. 1, 5-AG; ***p = 0.0002 for SMAD2: Sham vs. UUO, **p = 0.0053 for SMAD2: Sham vs. 1, 5-AG, #p = 0.0126 for SMAD2: UUO vs. 1, 5-AG; ***p = 0.0002 for SMAD3: Sham vs. UUO, p = 0.3792 for SMAD3: Sham vs. 1, 5-AG, ###p = 0.0006 for SMAD3: UUO vs. 1, 5-AG. J Representative Western blot of Nrf2, Keap1, 12-LOX, Rac-1. (K) Quantitative analysis of Fig. 3J (n = 3). *p = 0.0156 for NRF2: Sham vs. UUO, p = 0.4461 for NRF2: Sham vs. 1, 5-AG, #p = 0.0331 for NRF2: UUO vs. 1, 5-AG; ***p  < 0.0001 for KEAP1: Sham vs. UUO, **p = 0.0019 for KEAP1: Sham vs. 1, 5-AG, ###p = 0.0007 for KEAP1: UUO vs. 1, 5-AG; ***p  < 0.0001 for 12-LOX: Sham vs. UUO, p = 0.9980 for 12-LOX: Sham vs. 1, 5-AG, ###p  < 0.0001 for 12-LOX: UUO vs. 1, 5-AG; ***p  < 0.0001 for RAC1: Sham vs. UUO, p = 0.1273 for RAC1: Sham vs. 1, 5-AG, ###p  < 0.0001 for RAC1: UUO vs. 1, 5-AG. Data are presented as mean ± SD. Comparisons in B, D, E, G, I and K were compared using One-Way ANOVA followed by Sidak’s multiple comparisons test. *P < 0.05, **P < 0.01, ***P < 0.001 (compared with sham group), #P < 0.05, ##P < 0.01, ###P < 0.001 (compared with UUO group). Individual data points are independent biological replicates unless otherwise stated.
Fig. 4
Fig. 4. 1,5-AG as an agonist of TGR5 and knockdown of TGR5 abolishing the anti-fibrotic effect of 1,5-AG.
A Immunohistochemical micrographs of TGR5 in the kidney tissues of IgA patients (scale bar, 100 μm). B IHC scores of Fig. 4A (n = 3) **p =0.0021. C TGR5 protein expressions of kidney in UUO and adenine models. **p = 0.0054 for UUO model: Sham vs. UUO, p = 0.5034 for UUO model: Sham vs. 1, 5-AG, #p = 0.0237 for UUO model: UUO vs. 1, 5-AG; ***p = 0.0003 for adenine model: Control vs. Ade, *p = 0.0446 for adenine model: Control vs. 1, 5-AG, ##p = 0.0034 for adenine model: Ade vs. 1, 5-AG. D TGR5, FN, Col-I and Vimentin expressions in primary mouse renal tubular cells (PRTC) after treatment with TGF-β (10 ng/mL) + high glucose (30 mM) and 1,5-AG (50 μM). E Quantitative analysis of Fig. 4D (n = 3). ***p = 0.0001 for TGR5: Control vs. Model, **p = 0.0028 for TGR5: Control vs. 1, 5-AG, #p = 0.0137 for TGR5: Model vs. 1, 5-AG; ***p  < 0.0001 for FN: Control vs. Model, ***p = 0.0006 for FN: Control vs. 1, 5-AG, ##p = 0.0043 for FN: Model vs. 1, 5-AG; *p = 0.0149 for COL-1: Control vs. Model, p = 0.1713 for COL-1: Control vs. 1, 5-AG, #p = 0.0247 for COL-1: Model vs. 1, 5-AG, Comparison in COL-1 were performed with a two-tailed Student’s t test; **p = 0.0075 for VIMENTIN: Control vs. Model, *p = 0.0270 for VIMENTIN: Control vs. 1, 5-AG, #p = 0.0231 for VIMENTIN: Model vs. 1, 5-AG, Comparison in VIMENTIN were performed with a two-tailed Student’s t test. F The cAMP levels in adenine model. *p = 0.0130 for cAMP: Control vs. Ade, #p = 0.0376 for cAMP: Ade vs. 1, 5-AG. G The root mean square deviation (RMSD) of protein backbone atoms and 1,5-AG during the molecular dynamics (MD) simulation. H Molecular docking and the binding mode of 1,5-AG to TGR5 through the MD simulation. I Representative Western blot of Nrf2, Keap1, and HO-1. J Quantitative analysis of Fig. 4I (n = 3). **p = 0.0058 for NRF2: Control vs. Model, p = 0.9139 for NRF2: Control vs. 1, 5-AG, #p = 0.0107 for NRF2: Model vs. 1, 5-AG; ***p  < 0.0001 for KEAP1: Control vs. Model, **p = 0.0015 for KEAP1: Control vs. 1, 5-AG, ##p = 0.0048 for KEAP1: Model vs. 1, 5-AG; **p = 0.0029 for HO-1: Control vs. Model, *p = 0.0261 for HO-1: Control vs. 1, 5-AG, ##p = 0.0097 for HO-1: Model vs. 1, 5-AG, Comparison in HO-1 were performed with a two-tailed Student’s t test. K FN, Col-I and Vimentin expressions in PRTC after treatment with siRNA against TGR5 or negative control. L Quantitative analysis of panel K (n = 3). ***p < 0.0001 for FN; **p = 0.0027 for COL-1; *p = 0.0117 for VIMENTIN. M The effect of SBI-115 on anti-fibrotic effect of 1,5-AG in PRTC. N Quantitative analysis of panel M (n = 3). **p = 0.0023 for FN; **p = 0.0036 for COL-1; ***p = 0.0002 for VIMENTIN. Data are presented as mean ± SD. Comparison in B were performed with a two-tailed Student’s t test. Comparisons in C, E, F, J, L and N were compared using One-Way ANOVA followed by Sidak’s multiple comparisons test. *P < 0.05, **P < 0.01, ***P < 0.001 (compared with sham or control group), #P < 0.05, ##P < 0.01, ###P < 0.001 (compared with model group). Individual data points are independent biological replicates unless otherwise stated.
Fig. 5
Fig. 5. SGLT2 as a 1,5-AG transporter in the kidney.
A Differentially expressed proteins of kidney tissues in UUO vs Sham are highlighted with volcano plot. The blue dots indicate the downregulated proteins, and the red dots indicate the upregulated proteins. B Western blot shows SGLT2 protein expression in kidneys from sham, UUO and UUO + BF (B. fragilis). C Quantitative analysis of panel B (n = 3). ***p = 0.0004 for SGLT2: Sham vs. UUO, **p = 0.0072 for SGLT2: Sham vs. UUO + BF, #p = 0.0394 for SGLT2: UUO vs. UUO + BF. D mRNA level of Slc5a2 was investigated in the GEO database using 153 subjects. Log-transformed SLC5A2 mRNA level was compared not only between glomeruli from healthy people (Normal) (n = 14) and lupus nephritic patients (LN) (n = 32), but also between tubulointerstitium from healthy people (n = 15) and lupus nephritic patients (n = 32) using Mann-Whitney U test; Log-transformed SLC5A2 mRNA level was compared not only between glomeruli from healthy people (n = 9) and hypertensive nephropathic patients (HN) (n = 9), but also between glomeruli from healthy people (n = 15) and IgA nephropathic patients (n = 27) using Mann-Whitney U test. **p = 0.0083 for Glomeruli HN; ***p < 0.0001 for Glomeruli LN; **p = 0.0096 for Glomeruli IgA; **p = 0.0091 for Tubulointerstitium LN. E mRNA level of SLC5A2 in the indicated groups (n = 6). ***p  < 0.0001 for Slc5a2: Sham vs. UUO, *p = 0.0140 for SGLT2: Sham vs. UUO + BF, #p = 0.0124 for SGLT: UUO vs. UUO + BF. F The root mean square deviation (RMSD) of protein backbone atoms and 1,5-AG during the molecular dynamics (MD) simulation. G, H Molecular docking and the binding mode of 1,5-AG to SGLT2 through the MD simulation. I Empagliflozin significantly decreased the serum concentration of 1,5-AG in control mice (n = 10). ***p = 0.0003. Box plots show center line as median, whiskers show maxima and minima, and box limits show upper and lower quartiles. J Cellular uptake experiments of 1,5-AG-13C6 were performed in stably SGLT2 transfected HEK293 vs wide-type (WT) cells (n = 6). ***p = 0.0022. Data are presented as mean ± SD. Comparison in D was performed with a two-tailed Mann-Whitney U test. Comparison in I and J were performed with a two-tailed Student’s t test. Comparisons in C, E were compared using One-Way ANOVA followed by Sidak’s multiple comparisons test. *P < 0.05, **P < 0.01, ***P < 0.001 (compared with sham group or normal subjects), #P < 0.05, ##P < 0.01, ###P < 0.001 (compared with UUO group). Individual data points are independent biological replicates unless otherwise stated.
Fig. 6
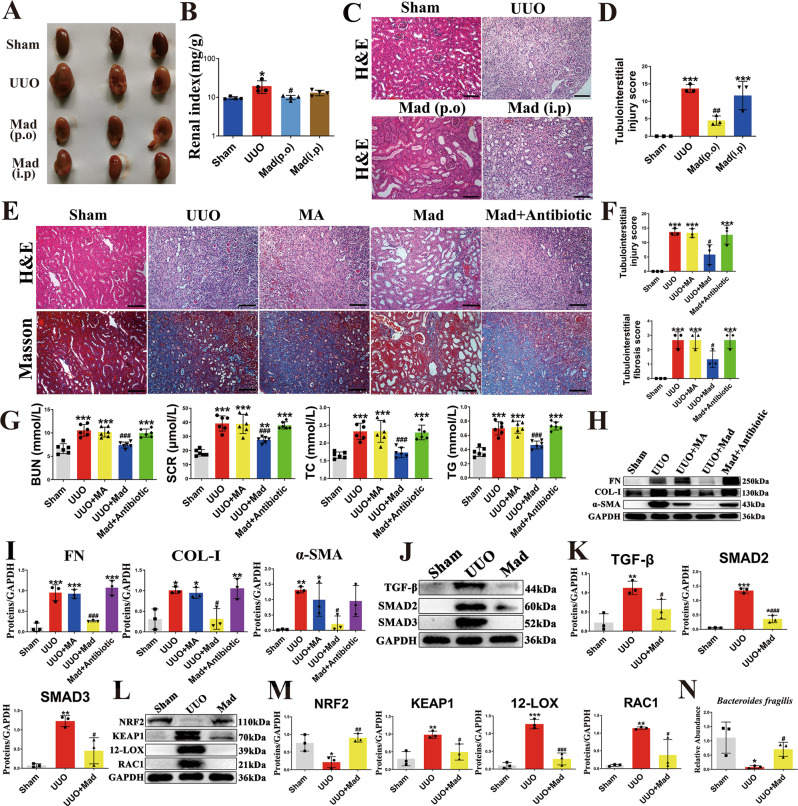
Fig. 6. The anti-fibrotic effects of Mad in UUO model.
A Picture of left kidneys of mice with different treatments (n = 3). B The renal index (mg/g) (n = 3). *p = 0.0140 for B: Sham vs. UUO, p  > 0.9999 for B: Sham vs. Mad (p.o), p = 0.7027 for B: Sham vs. Mad (i.p), #p = 0.0175 for B: UUO vs. Mad (p.o), p = 0.1476 for B: UUO vs. Mad (i.p). C Representative photomicrographs of the H&E staining from left kidneys of Sham, UUO, Mad (p.o.) or Mad (i.p.)-treated UUO mice. D Bar graphs depict renal injury scores based on H&E staining (n = 3). ***p = 0.0003 for injury score: Sham vs. UUO, p = 0.1712 for injury score: Sham vs. Mad (p.o), ***p = 0.0010 for injury score: Sham vs. Mad (i.p), ##p = 0.0047 for injury score: UUO vs. Mad (p.o), p = 0.8302 for injury score: UUO vs. Mad (i.p). E Representative photomicrographs of the H&E staining and Masson’s trichrome staining from left kidneys of Sham, UUO, UUO + MA, UUO + Mad (p.o.), UUO + Mad + Antibiotic mice (H&E and Masson’s staining; scale bar, 100 μm; magnification, ×200). F Bar graphs depict renal injury scores and renal interstitial fibrosis scores based on H&E staining or Masson’s trichrome staining (n = 3). ***p = 0.0002 for injury score: Sham vs. UUO, ***p = 0.0002 for injury score: Sham vs. UUO + MA, p = 0.0692 for injury score: Sham vs. UUO + Mad, ***p = 0.0003 for injury score: Sham vs. Mad+Antibiotic, p  > 0.9999 for injury score: UUO vs. UUO + MA, #p = 0.0119 for injury score: UUO vs. UUO + Mad, p = 0.9984 for injury score: UUO vs. Mad+Antibiotic; ***p = 0.0006 for fibrosis score: Sham vs. UUO, ***p = 0.0006 for fibrosis score: Sham vs. UUO + MA, p = 0.0687 for fibrosis score: Sham vs. UUO + Mad, ***p = 0.0006 for fibrosis score: Sham vs. Mad+Antibiotic, p  > 0.9999 for fibrosis score: UUO vs. UUO + MA, #p = 0.0101 for fibrosis score: UUO vs. UUO + Mad, p  > 0.9999 for fibrosis score: UUO vs. Mad+Antibiotic. G Biochemical parameters including BUN, Scr, TC, TG in each of mice (n = 6). ***p  < 0.0001 for BUN: Sham vs. UUO, ***p < 0.0001 for BUN: Sham vs. UUO + MA, p = 0.7803 for BUN: Sham vs. UUO + Mad, ***p < 0.0001 for BUN: Sham vs. Mad+Antibiotic, p = 0.9949 for BUN: UUO vs. UUO + MA, ###p  < 0.0001 for BUN: UUO vs. UUO + Mad, p = 0.9366 for BUN: UUO vs. Mad+Antibiotic; ***p  < 0.0001 for SCR: Sham vs. UUO, ***p < 0.0001 for SCR: Sham vs. UUO + MA, **p = 0.0074 for SCR: Sham vs. UUO + Mad, ***p < 0.0001 for SCR: Sham vs. Mad+Antibiotic, p  > 0.9999 for SCR: UUO vs. UUO + MA, ###p = 0.0005 for SCR: UUO vs. UUO + Mad, p = 0.9982 for SCR: UUO vs. Mad+Antibiotic; ***p  < 0.0001 for TC: Sham vs. UUO, ***p < 0.0001 for TC: Sham vs. UUO + MA, p = 0.9957 for TC: Sham vs. UUO + Mad, ***p = 0.0001 for TC: Sham vs. Mad+Antibiotic, p  > 0.9999 for TC: UUO vs. UUO + MA, ###p = 0.0003 for TC: UUO vs. UUO + Mad, p > 0.9999 for TC: UUO vs. Mad+Antibiotic; ***p  < 0.0001 for TG: Sham vs. UUO, ***p < 0.0001 for TG: Sham vs. UUO + MA, p = 0.1726 for TG: Sham vs. UUO + Mad, ***p < 0.0001 for TG: Sham vs. Mad+Antibiotic, p = 0.9997 for TG: UUO vs. UUO + MA, ###p  < 0.0001 for TG: UUO vs. UUO + Mad, p = 0.9810 for TG: UUO vs. Mad+Antibiotic. H Kidney expression of FN, Col I and α-SMA from all groups, assayed by Western blot. I Quantitative analysis of Fig. 6H (n = 3). ***p = 0.0001 for FN: Sham vs. UUO, ***p = 0.0002 for FN: Sham vs. UUO + MA, p = 0.8340 for FN: Sham vs. UUO + Mad, ***p < 0.0001 for FN: Sham vs. Mad+Antibiotic, p  > 0.9999 for FN: UUO vs. UUO + MA, ###p = 0.0006 for FN: UUO vs. UUO + Mad, p = 0.9149 for FN: UUO vs. Mad+Antibiotic; *p = 0.0133 for COL-1: Sham vs. UUO, *p = 0.0240 for COL-1: Sham vs. UUO + MA, p  > 0.9999 for COL-1: Sham vs. UUO + Mad, **p = 0.0086 for COL-1: Sham vs. Mad+Antibiotic, p  > 0.9999 for COL-1: UUO vs. UUO + MA, #p = 0.0139 for COL-1: UUO vs. UUO + Mad, p > 0.9999 for COL-1: UUO vs. Mad+Antibiotic; **p = 0.0079 for α-SMA: Sham vs. UUO, *p = 0.0480 for α-SMA: Sham vs. UUO + MA, p = 0.9946 for α-SMA: Sham vs. UUO + Mad, p = 0.0607 for α-SMA: Sham vs. Mad+Antibiotic, p = 0.9054 for α-SMA: UUO vs. UUO + MA, #p = 0.0223 for α-SMA: UUO vs. UUO + Mad, p = 0.8440 for α-SMA: UUO vs. Mad+Antibiotic. J Kidney expression of TGF-β/Smad signaling pathway from Sham, UUO, Mad-treated UUO mice, assayed by Western blot. K Quantitative analysis of Fig. 6J (n = 3). **p = 0.0050 for TGF-β: Sham vs. UUO, #p = 0.0428 for TGF-β: UUO vs. UUO + Mad; ***p  < 0.0001 for SMAD2: Sham vs. UUO, *p = 0.0173 for SMAD2: Sham vs. UUO + Mad, ###p  < 0.0001 for SMAD2: UUO vs. UUO + Mad; **p = 0.0018 for SMAD3: Sham vs. UUO, p = 0.2011 for SMAD3: Sham vs. UUO + Mad, #p = 0.0135 for SMAD3: UUO vs. UUO+Mad. L Representative Western blot of Nrf2, keap1, 12-LOX, Rac-1. M Quantitative analysis of Fig. 6L (n = 3). *p = 0.0271 for NRF2: Sham vs. UUO, p = 0.7328 for NRF2: Sham vs. UUO + Mad, ##p = 0.0091 for NRF2: UUO vs. UUO + Mad; **p = 0.0083 for KEAP1: Sham vs. UUO, #p = 0.0351 for KEAP1: UUO vs. UUO + Mad; ***p = 0.0001 for 12-LOX: Sham vs. UUO, p = 0.3690 for 12-LOX: Sham vs. UUO + Mad, ###p = 0.0003 for 12-LOX: UUO vs. UUO + Mad; **p = 0.0065 for RAC1: Sham vs. UUO, p = 0.4954 for RAC1: Sham vs. UUO + Mad, #p = 0.0300 for RAC1: UUO vs. UUO + Mad. N The relative abundance of B. fragilis in the sham, UUO and UUO + Mad groups measured by qPCR (n = 3). *p = 0.0309 for N: Sham vs. UUO, #p = 0.0122 for N: UUO vs. UUO + Mad. Data are presented as mean ± SD. Comparison in N were performed with a two-tailed Student’s t test. Comparisons in B, D, F, G, I, K, M and N were compared using One-Way ANOVA followed by Sidak’s multiple comparisons test. *P < 0.05, **P < 0.01, ***P < 0.001 (compared with sham group), #P < 0.05, ##P < 0.01, ###P < 0.001 (compared with UUO group). Individual data points are independent biological replicates unless otherwise stated.
Fig. 7
Fig. 7. The anti-fibrotic effects of B fragilis, 1,5-AG and Mad in the adenine model.
A Representative photomicrographs of the H&E staining and Masson’s trichrome staining from left kidneys of sham, adenine, B. fragilis-treated UUO mice, 1,5-AG-treated adenine mice and Mad-treated adenine mice (H&E and Masson’s staining; scale bar, 100 μm, magnification, ×200). B Bar graphs depict renal injury scores and renal interstitial fibrosis scores based on H&E staining or Masson’s trichrome staining (n = 5). ***p  < 0.0001 for injury score: Control vs. Ade, ##p = 0.0045 for injury score: Ade vs. BF, #p = 0.0421 for injury score: Ade vs. 1,5-AG, ###p = 0.0001 for injury score: Ade vs. Mad; ***p  < 0.0001 for fibrosis score: Control vs. Ade, ###p  < 0.0001 for fibrosis score: Ade vs. BF, ###p = 0.0002 for fibrosis score: Ade vs. 1,5-AG, ###p < 0.0001 for fibrosis score: Ade vs. Mad. (C) Biochemical parameters including blood urea nitrogen (BUN), serum creatinine (Scr) (n=9). ***p  < 0.0001 for BUN: Control vs. Ade, ##p = 0.0029 for BUN: Ade vs. BF, ###p = 0.0009 for BUN: Ade vs. 1,5-AG, ###p < 0.0001 for BUN: Ade vs. Mad; ***p  < 0.0001 for SCR: Control vs. Ade, ###p  < 0.0001 for SCR: Ade vs. BF, ###p  < 0.0001 for SCR: Ade vs. 1,5-AG, ###p = 0.0002 for SCR: Ade vs. Mad. (D) Kidney expression of FN, Col I and α-SMA from Sham, UUO and B. fragilis-treated adenine mice, assayed by Western blot. E Quantitative analysis of Fig. 7D (n = 3). *p = 0.0166 for FN: Control vs. Ade, ##p = 0.0080 for FN: Ade vs. BF, Comparison in FN were performed with a two-tailed Student’s t test; ***p  < 0.0001 for COL-1: Control vs. Ade, *p = 0.0335 for COL-1: Control vs. BF, ###p  < 0.0001 for COL-1: Ade vs. BF; ***p  < 0.0001 for α-SMA: Control vs. Ade, **p = 0.0082 for α-SMA: Control vs. BF, ###p = 0.0002 for α-SMA: Ade vs. BF. F Kidney expression of FN, Col I and α-SMA from sham, adenine and 1,5-AG-treated adenine mice, assayed by Western blot. G Quantitative analysis of Fig. 7F (n = 3). ***p = 0.0010 for FN: Control vs. Ade, p = 0.0822 for FN: Control vs. 1,5-AG, #p = 0.0128 for FN: Ade vs. 1,5-AG; *p = 0.0108 for COL-1: Control vs. Ade, #p = 0.0266 for COL-1: Ade vs. 1,5-AG, Comparison in COL-1 were performed with a two-tailed Student’s t test; **p = 0.0040 for α-SMA: Control vs. Ade, p = 0.8409 for α-SMA: Control vs. 1,5-AG, ##p = 0.0085 for α-SMA: Ade vs. 1,5-AG. (H) Kidney expression of FN, Col I and α-SMA from control, adenine and Mad-treated adenine mice, assayed by Western blot. I Quantitative analysis of Fig. 7H (n=3). *p = 0.0191 for FN: Control vs. Ade, p = 0.5363 for FN: Control vs. Mad, ##p = 0.0048 for FN: Ade vs. Mad; **p = 0.0018 for COL-1: Control vs. Ade, p = 0.9225 for COL-1: Control vs. Mad, ##p = 0.0030 for COL-1: Ade vs. Mad; **p = 0.0044 for α-SMA: Control vs. Ade, p = 0.4676 for α-SMA: Control vs. Mad, #p = 0.0198 for α-SMA: Ade vs. Mad. J Western blot shows SGLT2 protein expression in kidneys from control, adenine and adenine + BF groups. K Quantitative analysis of Fig. 7J (n = 3). **p = 0.0078 for K: Control vs. Ade, *p = 0.0428 for K: Control vs. BF, #p = 0.0238 for K: Ade vs. BF, Comparison in K were performed with a two-tailed Student’s t test. Data are presented as mean ± SD. Comparisons in B, C, E, G and I were compared using One-Way ANOVA followed by Sidak’s multiple comparisons test. *P < 0.05, **P < 0.01, ***P < 0.001 (compared with control group), #P < 0.05, ##P < 0.01, ###P < 0.001 (compared with adenine group). Individual data points are independent biological replicates unless otherwise stated.
Fig. 8
Fig. 8. Proposed mechanism for the inhibition of renal fibrosis by B. fragilis.
The relative abundance of B. fragilis is decreased in the feces of CKD patients and UUO mice. Oral administration of live B. fragilis attenuates renal fibrosis in UUO and adenine mice models. Increased LPS levels are decreased after B. fragilis administration. 1,5-AG, a substrate of SGLT2, increases after B. fragilis administration via enhancement of renal SGLT2 expression. 1,5-AG is an agonist of TGR5 that attenuates renal fibrosis by inhibiting oxidative stress and inflammation. Mad promotes B. fragilis growth and remarkably ameliorates renal fibrosis.

References

    1. Jha V, et al. Chronic kidney disease: global dimension and perspectives. Lancet. 2013;382:260–272. doi: 10.1016/S0140-6736(13)60687-X. - DOI - PubMed
    1. Humphreys BD. Mechanisms of renal fibrosis. Annu. Rev. Physiol. 2017;7:10–17. - PubMed
    1. Humphreys BD. Mechanisms of renal fibrosis. Annu Rev. Physiol. 2018;80:309–326. doi: 10.1146/annurev-physiol-022516-034227. - DOI - PubMed
    1. Inker LA, et al. KDOQI US commentary on the 2012 KDIGO clinical practice guideline for the evaluation and management of CKD. Am. J. Kidney Dis. 2014;63:713–735. doi: 10.1053/j.ajkd.2014.01.416. - DOI - PubMed
    1. Turner JM, Bauer C, Abramowitz MK, Melamed ML, Hostetter TH. Treatment of chronic kidney disease. Kidney Int. 2012;81:351–362. doi: 10.1038/ki.2011.380. - DOI - PubMed

Publication types

LinkOut - more resources