. 2022 Oct 14;13(1):6020.
doi: 10.1038/s41467-022-33735-6.

TLCD1 and TLCD2 regulate cellular phosphatidylethanolamine composition and promote the progression of non-alcoholic steatohepatitis

Affiliations

TLCD1 and TLCD2 regulate cellular phosphatidylethanolamine composition and promote the progression of non-alcoholic steatohepatitis

Kasparas Petkevicius et al. Nat Commun. .

Abstract

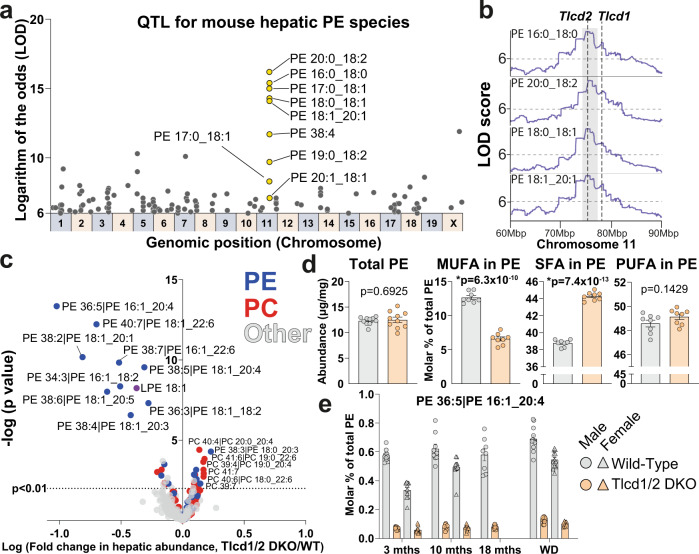
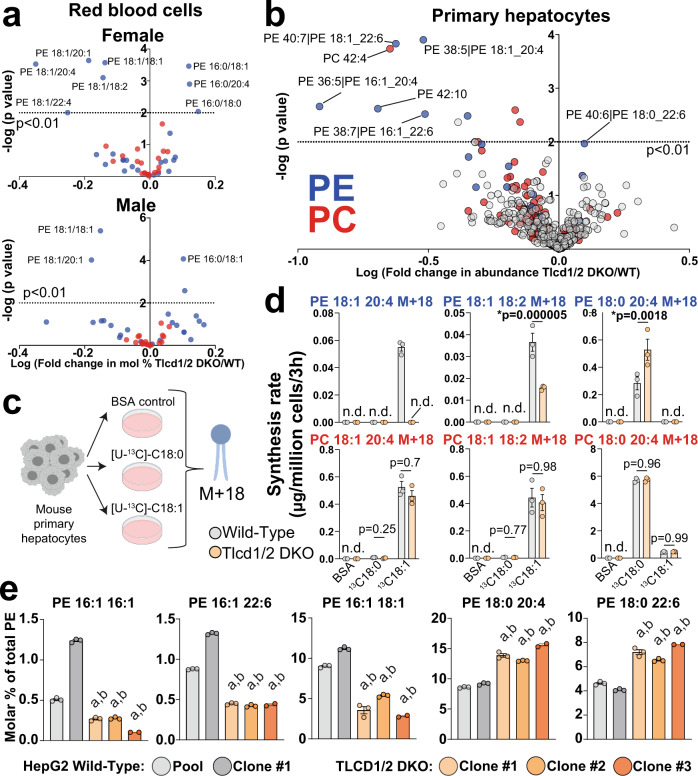
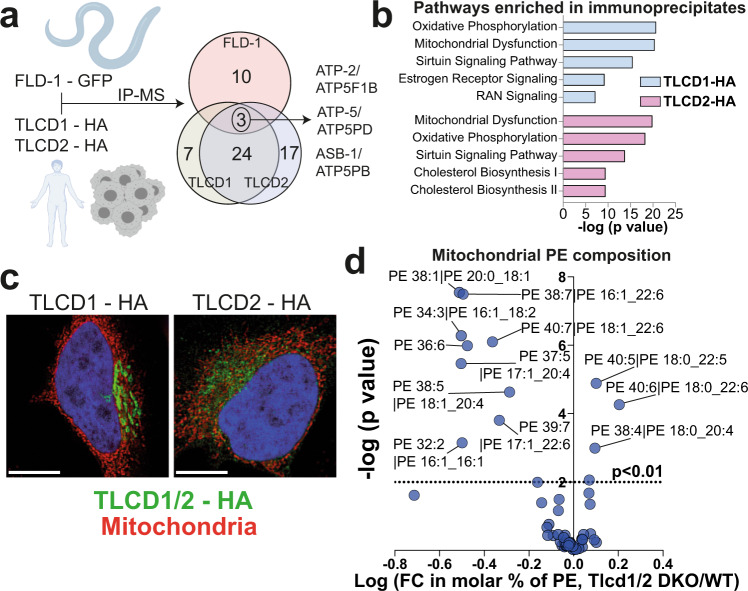
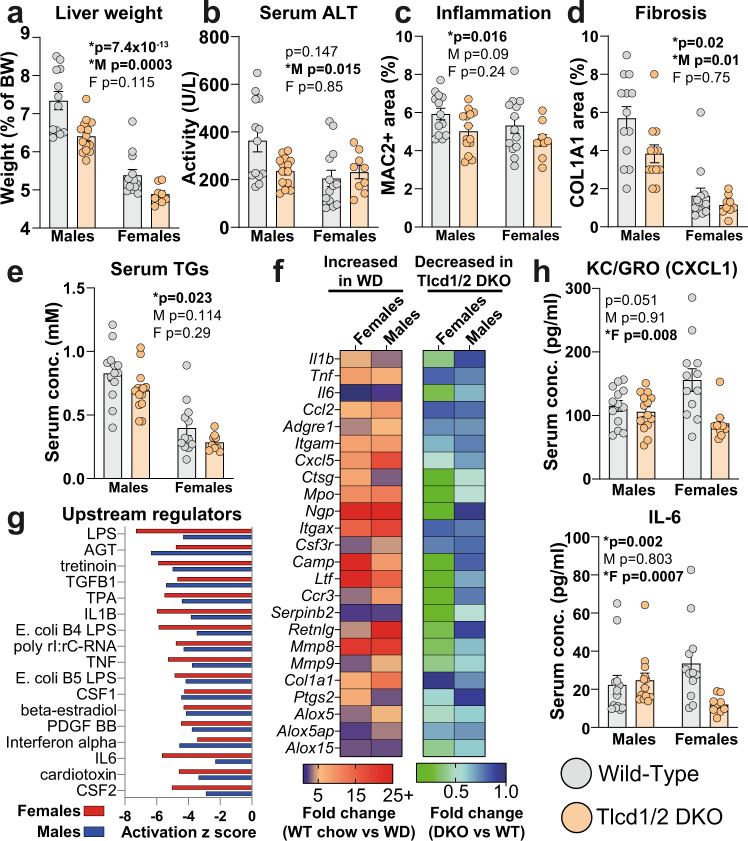
The fatty acid composition of phosphatidylethanolamine (PE) determines cellular metabolism, oxidative stress, and inflammation. However, our understanding of how cells regulate PE composition is limited. Here, we identify a genetic locus on mouse chromosome 11, containing two poorly characterized genes Tlcd1 and Tlcd2, that strongly influences PE composition. We generated Tlcd1/2 double-knockout (DKO) mice and found that they have reduced levels of hepatic monounsaturated fatty acid (MUFA)-containing PE species. Mechanistically, TLCD1/2 proteins act cell intrinsically to promote the incorporation of MUFAs into PEs. Furthermore, TLCD1/2 interact with the mitochondria in an evolutionarily conserved manner and regulate mitochondrial PE composition. Lastly, we demonstrate the biological relevance of our findings in dietary models of metabolic disease, where Tlcd1/2 DKO mice display attenuated development of non-alcoholic steatohepatitis compared to controls. Overall, we identify TLCD1/2 proteins as key regulators of cellular PE composition, with our findings having broad implications in understanding and treating disease.


Conflict of interest statement

K.P., H.P., M.S.G., A.A., A.-C.A., K.M.-B., E.L.A., M.U., L.A., L.A., J.F., S.W., I.A., R.L., D.K., H.G.-K., L.L., R.N., G.P., S.H., G.S., M.B., M.M., and X.-R.P. are presently employed by AstraZeneca and may be AstraZeneca shareholders. The remaining authors declare no competing interests.

Figures

Fig. 1
Fig. 1. Tlcd1 and Tlcd2 genes regulate the levels of SFA- and MUFA-containing PE species in mouse liver.
a Quantitative trait loci for all PE species measured by LC–MS/MS in the total liver of 8 different founder strains (n = 8 mice/strain) and 384 diversity outbred mice, then mapped onto the mouse genome. This reveals the genomic position and founder strain allele effect pattern for each PE species (data from Linke et al.) b LOD score plots for selected hepatic PE species across the indicated region in mouse chromosome 11 (graphs adapted from lipidgenie.com). The position of Tlcd1/2 genes is indicated with dotted lines. c Volcano plot of lipid species measured with high confidence (490 species in total, PC indicated in red and PE in blue) in wild-type and Tlcd1/2 DKO chow-fed, 3-month-old male mouse livers (n = 10 mice/group). d Total measured PE levels and molar percentage of MUFA and SFA fatty acyl chains in PE species of the same mice as in c. Separate analysis was performed for PE acyl chain composition (n = 8 mice/group). e The levels of PE with 16:1 and 20:4 acyl chains, expressed as molar percentage of total PE species, measured in chow-fed 3-month old male (n = 10 mice/genotype) and female (n = 10 mice/genotype), 10-month old male (n = 9 WT, 7 DKO) and female (n = 10 WT, 9 DKO), 18-month-old male (8 WT, 9 DKO), as well as 10-month old male (n = 12 WT, 13 DKO) and female (n = 13 WT, 9 DKO) fed WD for 32 weeks. In c, d, data are presented as mean values ± SEM. In c, the logarithms of multiple unpaired two-tailed student’s t-test p values (not adjusted for multiple comparisons) are plotted on the y axis. In d, two-tailed student’s t-test p values are indicated on graphs. In e, statistical differences were not assessed. Source data for a, c–e are provided as a Source Data file.
Fig. 2
Fig. 2. TLCD1/2 promote MUFA incorporation into PE species in a cell-intrinsic manner.
a Volcano plots of selected PC (19 species, red) and PE (26 species, blue) species measured in red blood cells isolated from 8-month-old male (n = 12 WT, 11 Tlcd1/2 DKO) and female (6 WT, 9 Tlcd1/2 DKO) mice. b Volcano plot of lipid species measured with high confidence (492 species in total, PC indicated in red and PE in blue) in primary hepatocytes isolated from Wild-type and Tlcd1/2 DKO chow-fed, 3-month-old female mice (n = 3 mice/genotype) after 2 days of culture. c Outline of PE pulse-labeling experiment. d The levels of indicated PE and PC species containing stable label (mass + 18 Da) in primary hepatocytes isolated from wild-type and Tlcd1/2 DKO chow-fed, 3-month-old female mice (n = 3 mice/genotype), treated with 100 µM [U-13C]−18:0 or −18:1 for 3 h. e The levels of indicated PE species (expressed as molar % of total measured PE) measured in a pool or single clone-derived HepG2 cells transfected with non-targeting gRNA, and in CRISPR-edited TLCD1/2 DKO three single clone-derived cell populations. N = 3 technical replicates per sample. In d, e, data are presented as mean values ± SEM. In a, b, the logarithms of multiple unpaired two-tailed student’s t-test p values (not adjusted for multiple comparisons) are plotted on the y axis. In d, two-way ANOVA Sidak’s multiple comparisons post-hoc test p values are indicated on graphs, and n.d. indicates undetectable levels of measured lipid. In e, a indicates p < 0.0001 vs wild-type pool, and bp < 0.0001 vs wild-type clone 1 using one-way-ANOVA with Sidak’s multiple comparisons post-hoc test. Source data for a, b, d, e are provided as a Source Data file.
Fig. 3
Fig. 3. TLCD1/2 interact with mitochondria and regulate hepatocyte mitochondrial PE composition.
a Design and summary of GFP-FLD-1 and HA-TLCD1/2 IP experiments performed in C. elegans GFP-FLD-1 strains (n = 4 biological replicates) and in HepG2 cells with stable HA-TLCD1 or HA-TLCD2 expression (n = 5 clones/condition). IP-MS: immunoprecipitation followed by mass spectrometry. Overlapping hits (ATP synthase subunits) are indicated. b Ingenuity Pathway Analysis (using genome-wide proteome reference database) of the interacting proteins enriched in either HA-TLCD1 or HA-TLCD2 HepG2 IPs compared to negative controls. The list of protein hits for each pathway are provided in the Supplementary data 2. c Representative (from 2 independent experiments, each containing >100 imaged individual cells) IHC images of HeLa cells with stable HA-TLCD1 and HA-TLCD2 expression, co-stained for HA tag (FITC) and mitochondria (Deep Red FM). White scale bar = 20 µm. d Volcano plot of PE species measured with high confidence (expressed as molar % of total PE species for each sample) in mitochondria isolated from the livers of wild-type and Tlcd1/2 DKO chow-fed, 3-month-old male mice (n = 7 mice/genotype). In b, p values were calculated by Ingenuity Pathway Analysis software. In d, the logarithms of multiple unpaired two-tailed student’s t-test p values (not adjusted for multiple comparisons) are plotted on the y axis. Source data for d are provided as a Source Data file.
Fig. 4
Fig. 4. Tlcd1/2 deficiency reduces the severity of NASH in WD-fed mice.
a Liver weights (normalized to body weights), b circulating ALT activity, c quantification of hepatic MAC2+ histological staining, d quantification of hepatic COL1A1+ histological staining, e circulating triglyceride levels in 10-month-old male and female wild-type and Tlcd1/2 DKO mice, fed WD for 32 weeks. f The ratios between the average expression values of indicated hepatic genes in male and female groups. Left heatmap shows the ratios of WD/chow wild-type group average expression values, and the right heatmap—the ratios of Tlcd1/2 DKO/wild-type WD group average expression values. g Ingenuity Pathway Analysis of predicted upstream regulators that are differentially activated in Tlcd1/2 WD-fed mouse livers compared to respective controls. h Serum levels of pro-inflammatory cytokines KC/GRO and IL-6 in WD-fed mice. In ae and h, data are presented as mean values ± SEM. In all panels, N = 9 chow-fed wild-type males and 10 females, 7 Tlcd1/2 DKO males and 9 females; 13 WD-fed wild-type males and 13 females, 14 Tlcd1/2 DKO males and 9 females. P values are indicated on each graph for genotype factor in 2-way-ANOVA, with genotype differences in male and female groups evaluated using Sidak’s multiple comparisons post-hoc test. Source data for a–f and h are provided as a Source Data file.

References

    1. Harayama T, Riezman H. Understanding the diversity of membrane lipid composition. Nat. Rev. Mol. Cell Biol. 2018;19:281–296. doi: 10.1038/nrm.2017.138. - DOI - PubMed
    1. Doll S, et al. ACSL4 dictates ferroptosis sensitivity by shaping cellular lipid composition. Nat. Chem. Biol. 2017;13:91–98. doi: 10.1038/nchembio.2239. - DOI - PMC - PubMed
    1. Raphael W, Sordillo LM. Dietary polyunsaturated fatty acids and inflammation: the role of phospholipid biosynthesis. Int J. Mol. Sci. 2013;14:21167–21188. doi: 10.3390/ijms141021167. - DOI - PMC - PubMed
    1. Meer GV, Kroon AIPMD. Lipid map of the mammalian cell. J. Cell. Sci. 2011;124:5–8. doi: 10.1242/jcs.071233. - DOI - PubMed
    1. Richter-Dennerlein R, et al. DNAJC19, a mitochondrial cochaperone associated with cardiomyopathy, forms a complex with prohibitins to regulate cardiolipin remodeling. Cell Metab. 2014;20:158–171. doi: 10.1016/j.cmet.2014.04.016. - DOI - PubMed

Publication types

MeSH terms