

doi: 10.1038/s41477-022-01260-5.
Epub 2022 Oct 14.
Concerted expansion and contraction of immune receptor gene repertoires in plant genomes
Affiliations
- PMID: 36241733
- PMCID: PMC9579050
- DOI: 10.1038/s41477-022-01260-5
Item in Clipboard
Concerted expansion and contraction of immune receptor gene repertoires in plant genomes
Nat Plants.
2022 Oct.
Abstract
Recent reports suggest that cell-surface and intracellular immune receptors function synergistically to activate robust defence against pathogens, but whether they co-evolve is unclear. Here we determined the numbers of cell-surface and intracellular immune receptors in 350 species. Surprisingly, the number of receptor genes that are predicted to encode cell-surface and intracellular immune receptors is strongly correlated. We suggest this is consistent with mutual potentiation of immunity initiated by cell-surface and intracellular receptors being reflected in the concerted co-evolution of the size of their repertoires across plant species.
© 2022. The Author(s).
Conflict of interest statement
The authors declare no competing interests.
Figures
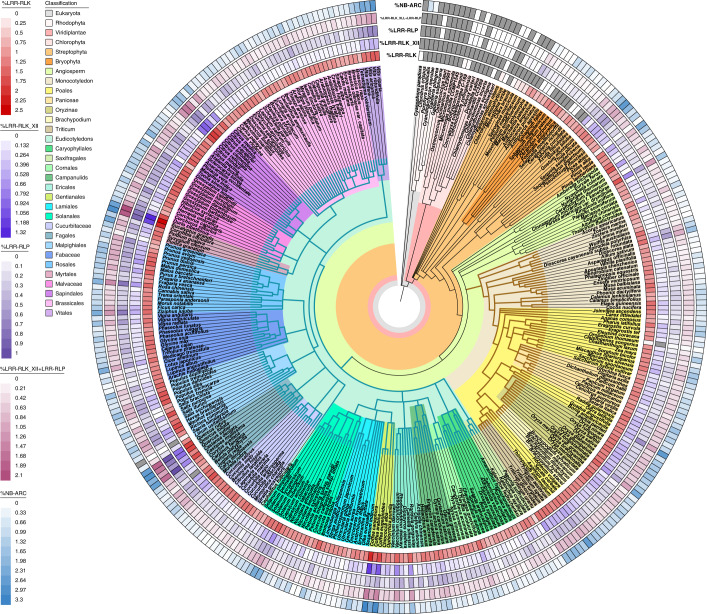
Phylogenetic tree of 350 plant species, including 300 angiosperms, 79 monocot species and 208 eudicot species. Heat maps represent the percentages (%) of LRR-RLKs, LRR-RLK_XIIs (red), LRR-RLPs (purple), LRR-RLK-XIIs + LRR-RLPs (magenta) and NB-ARCs (blue) in their corresponding annotated proteomes. Grey boxes in heat maps indicate null values where no receptors were identified. Brown branches indicate monocots, and teal branches represent eudicots.
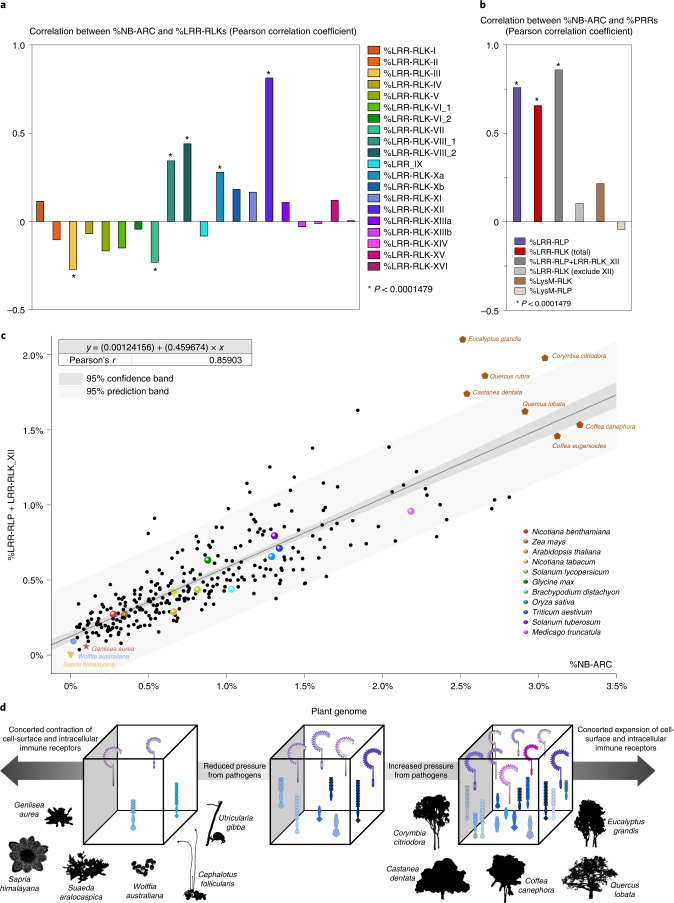
a,b, Correlation between %NB-ARC and %LRR-RLKs and %PRRs in 300 angiosperms. Bar chart represents the Pearson correlation coefficient, with significant values indicated with asterisks. Two-sided test of significance was performed, and Bonferroni correction was performed to adjust the P value for the multiple independent tests performed (Extended Data Fig. 6). Summary of statistical analyses and individual P values are provided in Supplementary Table 4. c, Scatter plot of %LRR-RLP + LRR-RLK-XII against %NB-ARC. Black line represents the linear trend, with dark-grey shade representing the 95% confidence interval and light-grey shade representing the 95% prediction interval. Several parasitic species, carnivorous species, aquatic species and trees are indicated as yellow inverted triangles, orange stars, blue circles and brown pentagons, respectively. Model organisms are also indicated as spheres of different colours. d, Schematic illustration of the co-expansion and co-contraction of immune receptors in plant genomes.

Table representing the characterized subgroup members in Arabidopsis thaliana; the biological processes of which the characterized members are involved in, and expression of subgroup members during effector-triggered immunity (ETI). Red shade represents increased expression and blue shade represents decreased expression during ETI. X-axis values represents log2(fold change during ETI relative to untreated samples). Box-plot elements: centre line, median; bounds of box, 25th and 75th percentiles; whiskers, 1.5 × IQR from 25th and 75th percentiles. RNA-seq data analysed here were reported previously. ETI is activated by estradiol-induced expression of AvrRps4 in Arabidopsis thaliana for 4 hours. Number of genes (n) from each LRR-RLK subgroup: I, n = 15; II, n = 15; III, n = 33; IV, n = 4; V, n = 6; VI-1, n = 4; V1-2, n = 5; VII, n = 7; VIII-1, n = 4; VIII-2, n = 12; IX, n = 3; Xa, n = 3; Xb, n = 9; XI, n = 28; XII, n = 8; XIIIa, n = 3; XIIIb, n = 3; XIV, n = 2; XV, n = 2; XVI, n = 1.

Phylogenetic tree of 350 plant species, with heatmaps representing the assembled genome size, number (no.) of annotated proteins and number (no.) of primary transcripts. Brown branches indicates monocots and teal branches represent eudicots.

Protein sequences from all 350 proteomes were first filtered for the primary gene models. Primary-transcript proteomes were then filtered and NB-ARC, LRR-RLP, LysM-RLK, LysM-RLP and LRR-RLK proteins were identified. LRR-RLK genes were further classified into 20 subgroups according to their alignment to the Arabidopsis thaliana subgroups. Details of the pipeline are described in the methods section.

a, Scatter plot of number of NB-ARC genes identified in this study against number of NB-ARC genes identified in Baggs et al for the corresponding plant species. b, Scatter plot of number of LRR-RLKs identified in this study against number of LRR-RLKs identified in Dufayard et al for the corresponding plant species. c, Scatter plot of number of NB-ARC genes identified in this study against number of NB-ARC genes identified in Li et al (RGAugury database) for the corresponding plant species (ref). d, Scatter plot of number of RLK genes (LRR- and LysM-RLKs only) identified in this study against number of RLK genes (any RLKs, including LRR- and LysM-RLKs) identified in Li et al (RGAugury database) for the corresponding plant species. e, Scatter plot of number of RLP genes (LRR- and LysM-RLPs only) identified in this study against number of RLP genes (any RLPs, including LRR- and LysM-RLPs) identified in Li et al (RGAugury database) for the corresponding plant species. For each plot, the black line represents the linear trend, with dark grey shade represents the 95% confidence interval and light grey shade represents the 95% prediction interval.
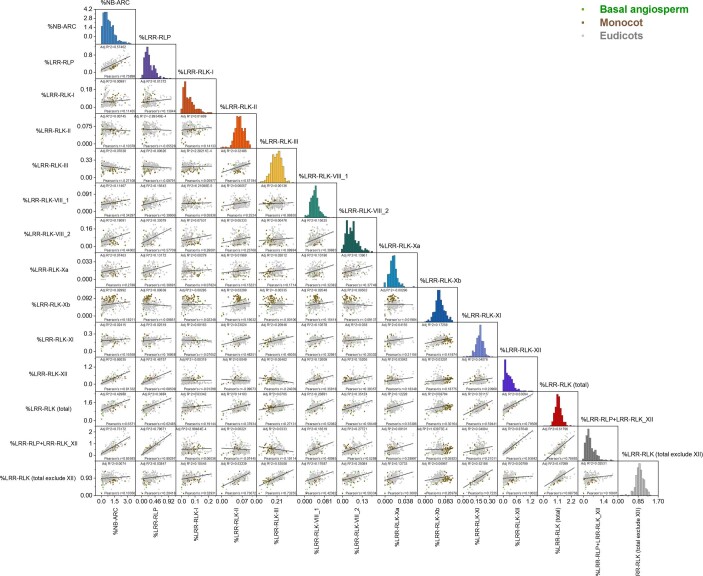
Bottom left boxes include scatter plot between the corresponding % receptor-gene families in 300 angiosperms. Black line represents the linear trend. Grey dots represent basal angiosperms (n = 13), brown dots represent monocots (n = 79) and green dots represent eudiots (n = 208). The Pearson correlation coefficient (Pearson’s r) is indicated below each scatter plot. The diagonal boxes include the distribution of % receptor-gene families in 300 angiosperms.

Bottom left squares indicate the strength of correlation between the corresponding % receptor-gene families in 300 angiosperms. Two-sided test of significance was performed, and Bonferroni correction was performed to adjust the p-value for all the independent tests. The Bonferroni-corrected p-value at α = 0.05 would be 0.0001479. Thus, P-values < 0.0001479 are considered as significant after correction. Red circles indicate significant and positive linear correlations, blue circles indicate significant and negative linear correlations and crosses (X) indicate insignificant correlations. The sizes of circles represent the strength of the correlations. Top right squares indicate the values of Pearson correlation coefficient between the corresponding %receptor-gene families in 300 angiosperms. Red values represent positive correlations and blue values represent negative correlations. Exact p-values and summary of statistical analyses are provided in Supplementary Table 4.

To test whether the receptor percentage (%) found per species correlate with phylogenetic relationship, %receptor and the species phylogenetic tree were converted to distance matrices and tested for correlation with the Mantel tests. a, Mantel test for the correlation between distance matrices obtained for % receptor family proteins in 350 species. Histogram shows the correlation coefficient between % PRRs and % NB-ARCs. b, Partial Mantel test for the correlation between distance matrices obtained for % receptor in 238 species, taking phylogenetic distances into account. Histogram shows the correlation coefficient between % PRRs and % NB-ARCs. c, Mantel test for the correlation between distance matrices obtained for %receptors and phylogenic distances in 238 species. Histogram shows the correlation coefficient between %receptor and phylogeny. One-sided test of significance was performed. P-values were corrected for multiple testing to reflect false discovery rates (FDRs, for details please refer to methods). Summary of statistical analyses are provided in Supplementary Table 4.

a, Phylogenetic tree of the species used in the analysis. Pearson correlation between %LRR-RLK_XII+LRR-RLP and %NB-ARC in b, Monocots, c, Eudicots, d, Poales, e, Fabids, f, Malvids and h, Asterids. g, Phylogenetic tree of the Asterids clade used in the analysis. Carnivorous plants are marked with orange stars; parasitic plants are marked with yellow triangles and aquatic plants are marked with blue circles. i, Pearson correlation between %LRR-RLK_XII+LRR-RLP and %NB-ARC in the Asterids clade, excluding carnivorous, parasitic, and aquatic plants.

a, List of parasitic species, carnivorous species, aquatic species and trees from this study. b, (left) Scatter plot of % LRR-RLP+LRR-RLK-XII against % NB-ARC in 300 angiosperms. Parasitic, carnivorous, aquatic and trees species are highlighted as yellow inverted triangles, orange stars, blue circles and brown pentagons, respectively. (right) Box-plot of % NB-ARC, LRR-RLP, LRR-RLK-XII and LRR-RLK-II in parasitic (yellow), carnivorous (orange), aquatic (blue) and trees species (brown) compared to other plant species (gray). Box-plot elements: centre line, median; bounds of box, 25th and 75th percentiles; whiskers, 1.5 × IQR from 25th and 75th percentiles. A two-sided Welch’s t-test was used to analyze significant differences between the groups (*P ≤ 0.05; ns, not significant). Exact P-values are provided in Supplementary Table 4. Number of species (n) in each category: non-parasitic species, n = 295; parasitic species, n = 5; non-carnivorous species, n = 293; carnivorous species, n = 7; non-aquatic species, n = 287; aquatic species, n = 13; tree species, n = 225; non-tree species, n = 75.

a, c, e. Table summarizing the statistical analysis of genomic clustering between PRRs (LRR-RLKs and LRR-RLPs) and NB-ARCs in Solanum tuberosum (a), Zea mays (c) and Oryza sativa (e). The 90-percentile distance (bp) between PRR gene family members and the next closest NB-ARC genes were calculated. This is then compared to a distribution (n = 1000) of 90-percentile distances between randomly-sampled genes and the next closest NB-ARC genes. One-sided test was performed to test the differences between tested distance (PRRs) and sampled distance (randomly-sampled). P-values are calculated based on the comparison to 1000 cases of randomly-sampled genes. Significant values are indicated in bold (p-value < 0.05 is considered as significant). b, d, f. Distribution (n = 1000) of 90-percentile distances (bp) between randomly-sampled genes and the next closest NB-ARC genes in Solanum tuberosum (b), Zea mays (d) and Oryza sativa (f). Red lines indicate the 90-percentile distance between the corresponding PRR gene family members and the next closest NB-ARC genes.
Comment in
-
Plant immune receptors evolved hand in hand.Nat Plants. 2022 Oct;8(10):1138-1139. doi: 10.1038/s41477-022-01258-z. Nat Plants. 2022. PMID: 36241734 No abstract available.
References
-
- Ngou BPM, Ahn H-K, Ding P, Jones JDG. Mutual potentiation of plant immunity by cell-surface and intracellular receptors. Nature. 2021;592:110–115. - PubMed
MeSH terms
Grants and funding
LinkOut - more resources
Full Text Sources
