. 2022 Oct 14;12(1):17260.
doi: 10.1038/s41598-022-21715-1.

Design and function of targeted endocannabinoid nanoparticles

Affiliations

Design and function of targeted endocannabinoid nanoparticles

N Barrie et al. Sci Rep. .

Abstract

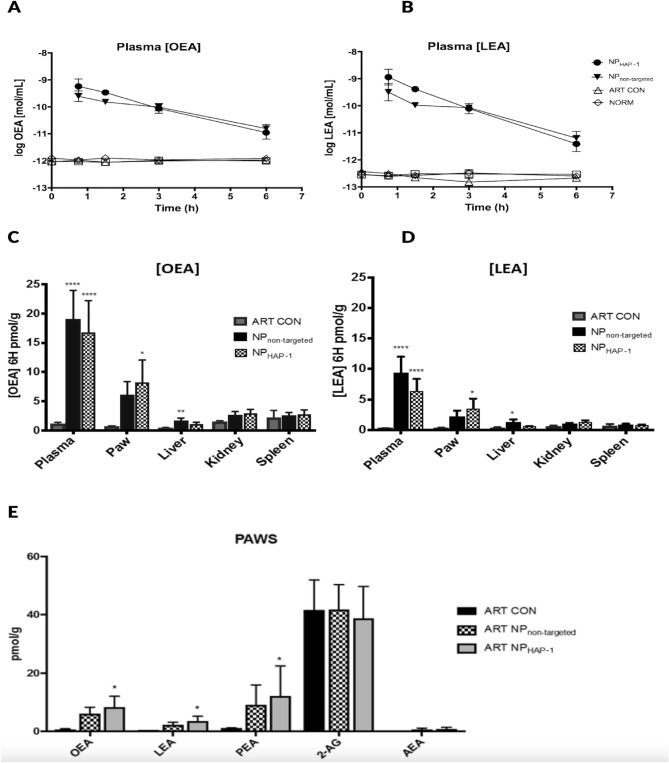
Nanoparticles and nano-delivery systems are constantly being refined and developed for biomedical applications such as imaging, gene therapy, and targeted delivery of drugs. Nanoparticles deliver beneficial effects by both release of their cargo and by liberation of their constitutive structural components. The N-acylethanolamines linoleoyl ethanolamide (LEA) and oleoyl ethanolamide (OEA) both exhibit endocannabinoid-like activity. Here, we report on their ability to form nanoparticles that when conjugated with tissue-specific molecules, are capable of localizing to specific areas of the body and reducing inflammation. The facilitation of pharmacological effects by endocannabinoids at targeted sites provides a novel biocompatible drug delivery system and a therapeutic approach to the treatment, patient management and quality of life, in conditions such as arthritis, epilepsy, and cancer.


Conflict of interest statement

The authors declare no conflict or competing interests. No financial disclosures. Ms. N Barrie was funded by a Rheumatology Dept. Scholarship.

Figures

Figure 1
Figure 1
(A) Chemical structure and space filling molecular model of endocannabinoid lipids OEA and LEA. (B) Differential scanning calorimetry showing the melting behaviour of amphiphile mixtures composed of LEA and OEA, representing one single melting point of each mixture. (C) Optical microscopy of pure monoethanolamide lipids LEA and OEA; amphiphile mixtures at varying LEA to OEA ratios. Images acquired at 25 °C and 37 °C before and after hydration from a fixed position (magnification × 100). Different mesophases are observed from pure water to pure amphiphile. Polymorphic changes in the mesophases from cubic to a more lamellar phases were observed as the OEA to LEA ratio increased. (D) SAXS profiles of; (i) bulk and; (ii–iv) lyotropic mesophases of mixed LEA/OEA in excess water (70 wt%). The lyotropic mesophases were equilibrated for 48 h and analysed at 25 °C (ii) and 37 °C (iii). Lyotropic mesophases of 60% LEA at various temperatures (iv), show a cubic mesophase with Pn3m space group. The scattering vector q = (4π/λ) sin(θ/2), where λ is the X-ray wavelength and θ is the scattering angle.
Figure 2
Figure 2
(A) Confocal microscopy of HAP-1-binding to human (h)-FLS, RA-FLS and OA-FLS cells. Cells at 37 °C were incubated with media, HAP-1-biotin, or sHAP-1-biotin followed by streptavidin-FITC. Actin is labelled with TRITC-phalloidin (red), HAP-1-biotin with streptavidin-FITC (green), and nuclei with DAPI (blue). Scale bars represent 100 μm. Positive binding was present for HAP-1-biotin treated HIG-82 and all h-FLS cell types. The bin ding pattern of HAP-1-biotin appeared to be consistent across the RA and OA h-FLS cell types with positive staining present on both the surface (yellow) and cytoplasmic internalization (green). Cells incubated with either media or sHAP-1-biotin showed no green FITC-stain demonstrating the binding specificity of the HAP-1 sequence. (B) Flow cytometry histograms illustrating uptake of NPnon-targeted and NPHAP-1 following incubation for 1, 3 and 18 h at 37 °C with RA-FLS or HIG-82 cells. Autofluorescence is shown as red, incubation with NPnon-targeted as blue, incubation with NPHAP-1 green, and incubation with free DiD dye (orange, shown as arrow). The experiments were repeated three times and the histogram is the average.
Figure 3
Figure 3
In vivo NP localization in normal and arthritic rats using near infrared imaging (NIR). (A) Localization of NPnon-targeted, NPHAP-1 and NPsHAP-1 24 h post-injection. No specific accumulation was seen in normal rats treated with NPnon-targeted and NPsHAP-1. In arthritic rats, slight accumulation to the inflamed joints was observed for NPnon-targeted and NPsHAP-1. For NPHAP1, localization to the joints was observed in both normal and arthritic rats. (B) Ex vivo imaging of liver, spleen, kidney, and lungs extracted from NPnon-targeted, NPHAP-1 rats.
Figure 4
Figure 4
Plasma concentrations and biodistribution of OEA and LEA in normal rats (NORM), arthritic control rats (ART CON) and arthritic rats treated with NPnon-targeted (ART NPnon-targeted) and NPHAP-1 (ART NPHAP-1). NPs were intravenously administered, and blood collected at 0, 45 min, 1.5, 3 and 6 h. After 6 h, organs and paws were harvested and analyzed on MS. Plasma concentration of; (A) OEA and (B) LEA concentration expressed as mol/mL (mean ± S.D., n = 5). Organ and paw concentrations of (C) OEA and (D) LEA expressed in pmol/g. (mean ± S.D., n = 5). *p < 0.05, ****p < 0.0001 vs ART-CON, Uncorrected Fisher’s least significance difference, two-way ANOVA. Significant accumulation to the paw was observed in NPHAP-1 treated rats. (E) Regulation of endogenous endocannabinoid OEA, LEA, PEA, 2-AG and AEA. Data expressed as pmol/g (mean ± S.D., n = 8). (*p < 0.05 vs ART CON, analysis using one-way ANOVA). Significant concentrations of OEA, LEA in ART NPHAP-1 were correlated to increases in PEA.
Figure 5
Figure 5
NP effect on cytokine production. (A) In vitro effects showing NP suppresses pro-inflammatory upregulation of NF-κβ, IL-6 and IL-8 mRNA in RA-FLS cells. Cultured RA-FLS were stimulated with TNF-α alone (25 ng/mL) or TNF-α plus NP (30 µg/mL) for 24 h. Expression levels of mRNA were assayed by quantitative real-time RT-PCR. The mRNA levels of each gene were standardized against GAPDH levels. Data are expressed as the mean (S.D.) (n = 4). *p < 0.05; **p < 0.01, ***p < 0.001, ****p < 0.0001 vs TNF-α alone. NP significantly inhibited TNF-α stimulated production of IL-6, IL- 8 and NF-κβ. (B) In vivo cytokine effects of NP in an arthritis model of inflammation. Plasma concentrations of cytokines in non-treated (ART CON), NPnon-targeted and NPHAP-1 treated arthritic rats were measured. Arthritic rats were treated with NP intravenously administered once daily, for two days and blood collected 48 h after the initial injection. Low plasma concentrations of pro- inflammatory cytokines IFN-γ, IL-6 and IL-17A were observed in both the NPnon-targeted and NPHAP-1 treated rats. Data expressed as the mean + S.D. (n = 6). *p < 0.05; **p < 0.01 against ART-CON.
Figure 6
Figure 6
Heat map of differential expressed genes prominent in arthritis progression in RA-FLS cells. Groups included untreated RA-FLS cells (RA-UT), TNF-α stimulated cells (RA-TNF), NP and TNF-α stimulated cells (RA-TNF/NP), and NP treated cells (RA-NP). The normalized RNA-seq data is in log2 scale, where red is highly expressed genes and blue is low expression. To be included in the heat map, genes were required to have at least 1000 counts (reads), totalled over all samples, where the standard deviation of log2 expression differences had to exceed two. (A) Heat map of DE candidate genes prominent in arthritis progression in RA-FLS cells. The heatmap highlight anti-inflammatory effects of NP in TNF-α induced pro-inflammatory cytokine expression. Abbreviations: NF-κβ subunits (RELB, RELA); Interferon, (IL-(12A, 12, 12B, 4, 23A, 18, 1B, 1A, 6, 8)); Matrix metalloproteinases (MMP-[1, 3, 13]); chemokine ligand 2 (CCL2); colony-stimulating factor 2 (CSF2). (B) Heat map of DE candidate signalling genes. The heatmap highlight shift in gene expression following NP treatment. Abbreviations: Serine/threonine-protein kinase (AKT1); Suppressor of cytokine signalling 4 (SOCS4); Janus kinase (JAK-[2, 3]); Signal transducers and activators of transcription (STAT-[1, 3]); Toll like receptor (TLR-[2–4]); Liver X receptor (LXR-[α]); Retinoid X receptor (RXR); Peroxisome proliferator- activated receptors (PPAR [A,G,D]-[α, ɣ, δ]).

References

    1. Hohmann AG. Spinal and peripheral mechanisms of cannabinoid antinociception: Behavioral, neurophysiological, and neuroanatomical perspectives. Chem. Phys. Lipids. 2002;121:173–190. doi: 10.1016/S0009-3084(02)00154-8. - DOI - PubMed
    1. Gonsiorek W, et al. Endocannabinoid 2-arachidonyl glycerol is a full agonist through human type 2 cannabinoid receptor: Antagonism by anandamide. Mol. Pharmacol. 2000;57:1045–1050. - PubMed
    1. Al-Hayani A, Wease KN, Ross RA, Pertwee RG, Davies SN. The endogenous cannabinoid anandamide activates vanilloid receptors in the rat hippocampal slice. Neuropharmacology. 2001;41:1000–1005. doi: 10.1016/S0028-3908(01)00145-9. - DOI - PubMed
    1. Ross RA. Anandamide and vanilloid TRPV1 receptors. Br. J. Pharmacol. 2003;140:790–801. doi: 10.1038/sj.bjp.0705467. - DOI - PMC - PubMed
    1. Lowin T, Apitz M, Anders S, Straub RH. Anti-inflammatory effects of N-acylethanolamines in rheumatoid arthritis synovial cells are mediated by TRPV1 and TRPA1 in a COX-2 dependent manner. Arthritis. Res. Ther. 2015;17:321. doi: 10.1186/s13075-015-0845-5. - DOI - PMC - PubMed

Substances