

Clinical correlates of R1 relaxometry and magnetic susceptibility changes in multiple sclerosis: a multi-parameter quantitative MRI study of brain iron and myelin
- PMID: 36241917
- PMCID: PMC9935712
- DOI: 10.1007/s00330-022-09154-y
Clinical correlates of R1 relaxometry and magnetic susceptibility changes in multiple sclerosis: a multi-parameter quantitative MRI study of brain iron and myelin
Erratum in
-
Correction to: Clinical correlates of R1 relaxometry and magnetic susceptibility changes in multiple sclerosis: a multi-parameter quantitative MRI study of brain iron and myelin.Eur Radiol. 2023 Mar;33(3):2277. doi: 10.1007/s00330-022-09279-0. Eur Radiol. 2023. PMID: 36482219 Free PMC article. No abstract available.
Abstract
Objectives: The clinical impact of brain microstructural abnormalities in multiple sclerosis (MS) remains elusive. We aimed to characterize the topography of longitudinal relaxation rate (R1) and quantitative susceptibility (χ) changes, as indices of iron and myelin, together with brain atrophy, and to clarify their contribution to cognitive and motor disability in MS.
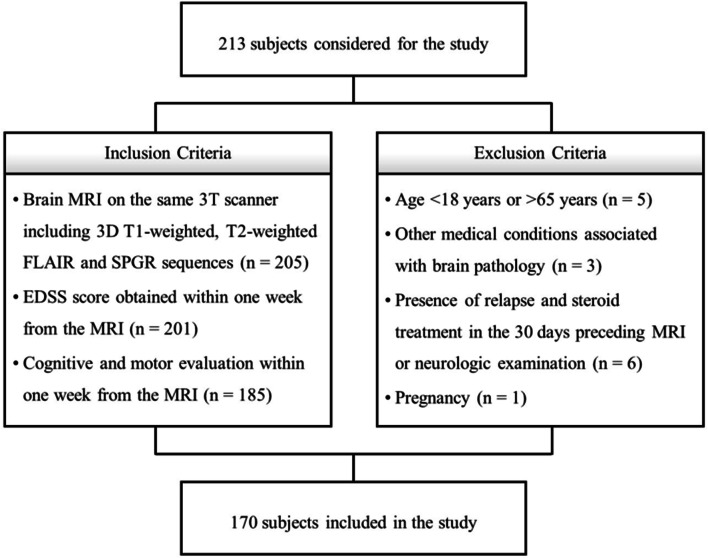
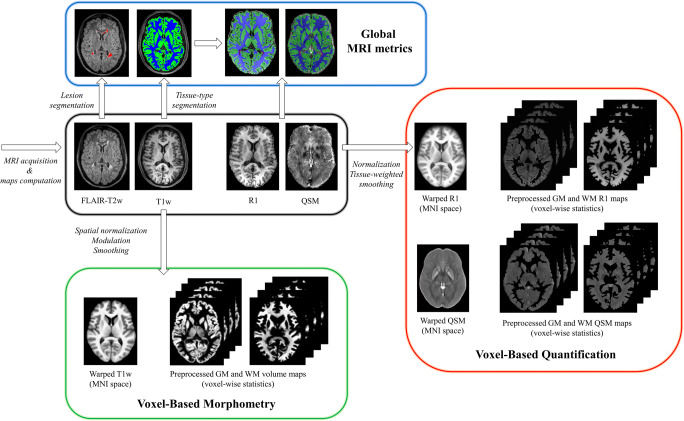
Methods: In this cross-sectional study, voxel-based morphometry, and voxel-based quantification analyses of R1 and χ maps were conducted in gray matter (GM) and white matter (WM) of 117 MS patients and 53 healthy controls. Voxel-wise between-group differences were assessed with nonparametric permutation tests, while correlations between MRI metrics and clinical variables (global disability, cognitive and motor performance) were assessed both globally and voxel-wise within clusters emerging from the between-group comparisons.
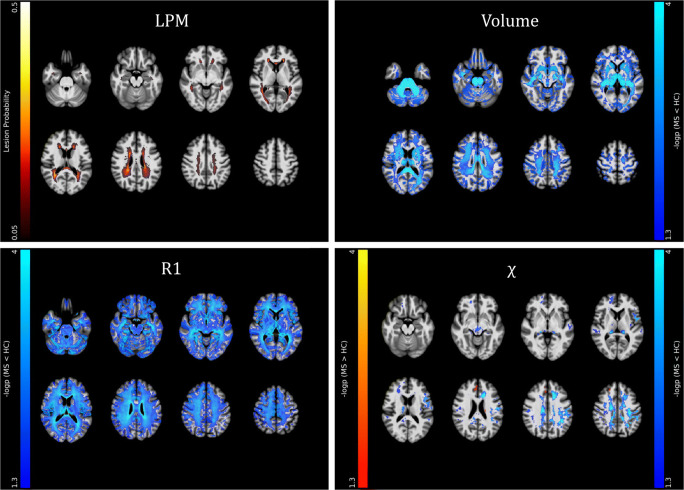
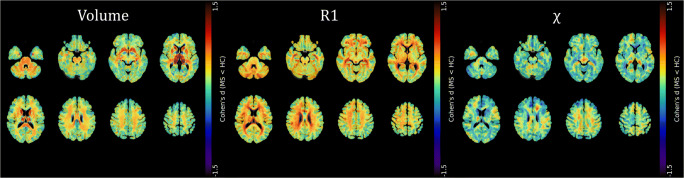
Results: MS patients showed widespread R1 decrease associated with more limited modifications of χ, with atrophy mainly involving deep GM, posterior and infratentorial regions (p < 0.02). While R1 and χ showed a parallel reduction in several WM tracts (p < 0.001), reduced GM R1 values (p < 0.001) were associated with decreased thalamic χ (p < 0.001) and small clusters of increased χ in the caudate nucleus and prefrontal cortex (p < 0.02). In addition to the atrophy, χ values in the cingulum and corona radiata correlated with global disability and motor performance, while focal demyelination correlated with cognitive performance (p < 0.04).
Conclusions: We confirmed the presence of widespread R1 changes, involving both GM and WM, and atrophy in MS, with less extensive modifications of tissue χ. While atrophy and χ changes are related to global and motor disability, R1 changes are meaningful correlates of cognition.
Key points: • Compared to healthy controls, multiple sclerosis patients showed R1 and χ changes suggestive of iron increase within the basal ganglia and reduced iron and myelin content within (subnuclei of) the thalamus. • Thalamic volume and χ changes significantly predicted clinical disability, as well as pulvinar R1 and χ changes, independently from atrophy. • Atrophy-independent R1 and χ changes, suggestive of thalamic iron and myelin depletion, may represent a sensitive marker of subclinical inflammation.
Keywords: Atrophy; Magnetic resonance imaging; Multiple sclerosis; Quantitative susceptibility; Relaxometry.
© 2022. The Author(s).
Conflict of interest statement
The authors of this manuscript declare no relationships with any companies, whose products or services may be related to the subject matter of the article.
Figures

Similar articles
-
Unraveling Deep Gray Matter Atrophy and Iron and Myelin Changes in Multiple Sclerosis.AJNR Am J Neuroradiol. 2021 Jul;42(7):1223-1230. doi: 10.3174/ajnr.A7093. Epub 2021 Apr 22. AJNR Am J Neuroradiol. 2021. PMID: 33888456 Free PMC article.
-
Voxel-Based quantitative MRI reveals spatial patterns of grey matter alteration in multiple sclerosis.Hum Brain Mapp. 2021 Mar;42(4):1003-1012. doi: 10.1002/hbm.25274. Epub 2020 Nov 6. Hum Brain Mapp. 2021. PMID: 33155763 Free PMC article.
-
Relaxometry and brain myelin quantification with synthetic MRI in MS subtypes and their associations with spinal cord atrophy.Neuroimage Clin. 2022;36:103166. doi: 10.1016/j.nicl.2022.103166. Epub 2022 Aug 25. Neuroimage Clin. 2022. PMID: 36081258 Free PMC article.
-
Gray Matter Atrophy in the Cortico-Striatal-Thalamic Network and Sensorimotor Network in Relapsing-Remitting and Primary Progressive Multiple Sclerosis.Neuropsychol Rev. 2021 Dec;31(4):703-720. doi: 10.1007/s11065-021-09479-3. Epub 2021 Feb 13. Neuropsychol Rev. 2021. PMID: 33582965 Review.
-
T1- and T2-based MRI measures of diffuse gray matter and white matter damage in patients with multiple sclerosis.J Neuroimaging. 2007 Apr;17 Suppl 1:16S-21S. doi: 10.1111/j.1552-6569.2007.00131.x. J Neuroimaging. 2007. PMID: 17425729 Review.
Cited by
-
Iron Load Toxicity in Medicine: From Molecular and Cellular Aspects to Clinical Implications.Int J Mol Sci. 2023 Aug 18;24(16):12928. doi: 10.3390/ijms241612928. Int J Mol Sci. 2023. PMID: 37629109 Free PMC article. Review.
-
Characterizing iron rim lesions in multiple sclerosis: a biomarker for disease activity and progression: a systematic review and meta-analysis.Neuroradiology. 2025 Jul 21. doi: 10.1007/s00234-025-03663-5. Online ahead of print. Neuroradiology. 2025. PMID: 40689996 Review.
-
In vivo demonstration of globotriaosylceramide brain accumulation in Fabry Disease using MR Relaxometry.Neuroradiology. 2024 Sep;66(9):1593-1601. doi: 10.1007/s00234-024-03380-5. Epub 2024 May 21. Neuroradiology. 2024. PMID: 38771548 Free PMC article.
-
Synthetic MR: Clinical applications in neuroradiology.Neuroradiology. 2025 Mar;67(3):509-527. doi: 10.1007/s00234-025-03547-8. Epub 2025 Jan 31. Neuroradiology. 2025. PMID: 39888426 Review.
-
Quantitative Susceptibility Mapping Values Quantification in Deep Gray Matter Structures for Relapsing-Remitting Multiple Sclerosis: A Systematic Review and Meta-Analysis.Brain Behav. 2024 Oct;14(10):e70093. doi: 10.1002/brb3.70093. Brain Behav. 2024. PMID: 39415615 Free PMC article.
References
MeSH terms
Substances
LinkOut - more resources
Full Text Sources
Medical
