. 2022 Oct 14;41(1):303.
doi: 10.1186/s13046-022-02477-0.

PCSK9 promotes the progression and metastasis of colon cancer cells through regulation of EMT and PI3K/AKT signaling in tumor cells and phenotypic polarization of macrophages

Affiliations

PCSK9 promotes the progression and metastasis of colon cancer cells through regulation of EMT and PI3K/AKT signaling in tumor cells and phenotypic polarization of macrophages

Lu Wang et al. J Exp Clin Cancer Res. .

Abstract

Background: Proprotein convertase subtilisin/kexin type 9 (PCSK9) is the ninth member of the proprotein convertase family that regulates lipoprotein homeostasis and altered PCSK9 expression was reportedly associated with tumor development and progression. This study assessed PCSK9 expression and functions in human colon cancer and then explored the underlying molecular events.

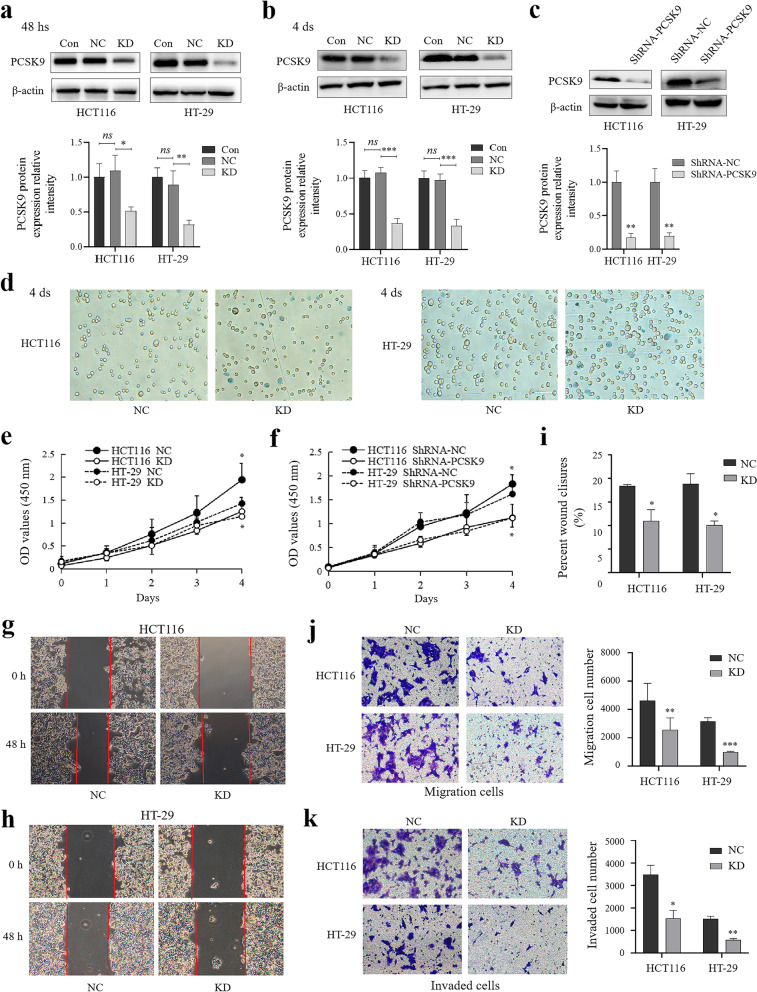
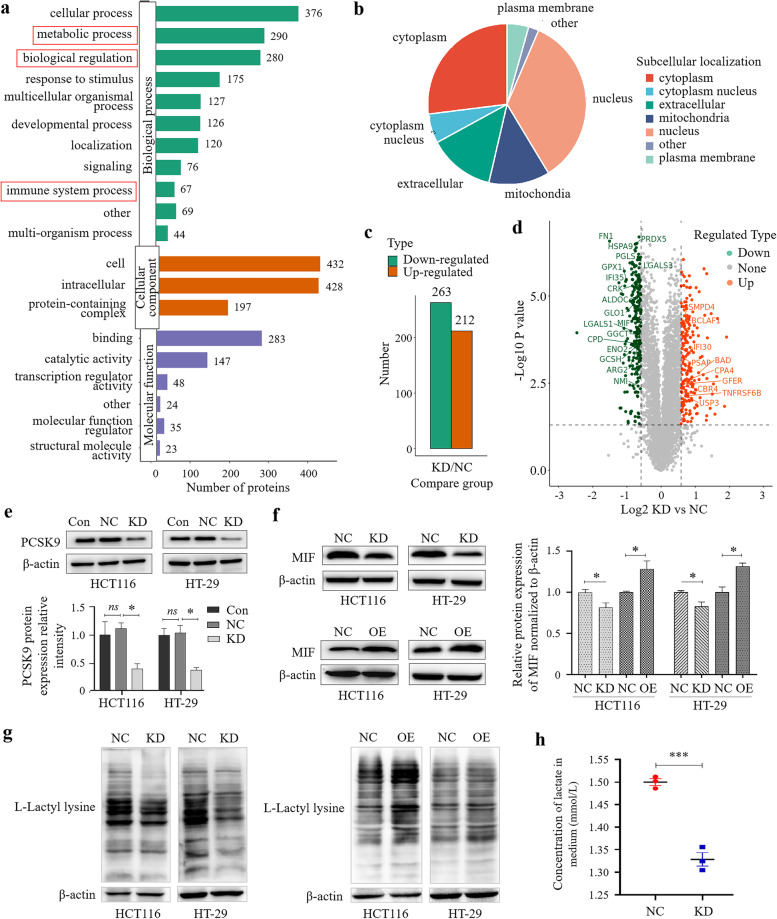
Methods: Colon cancer tissues were utilized for analysis of PCSK9 expression for association with clinicopathological factors from patients by immunohistochemistry assay. Manipulation of PCSK9 expression was assessed in vitro and in vivo for colon cancer cell proliferation, migration, and invasion using cell viability CCK-8, Transwell tumor cell migration and invasion, and wound-healing assays. Next, proteomic analysis, Western blot, qRT-PCR and Flow cytometry were conducted to assess downstream targets and tumor cell-derived PCSK9 action on macrophage polarization.

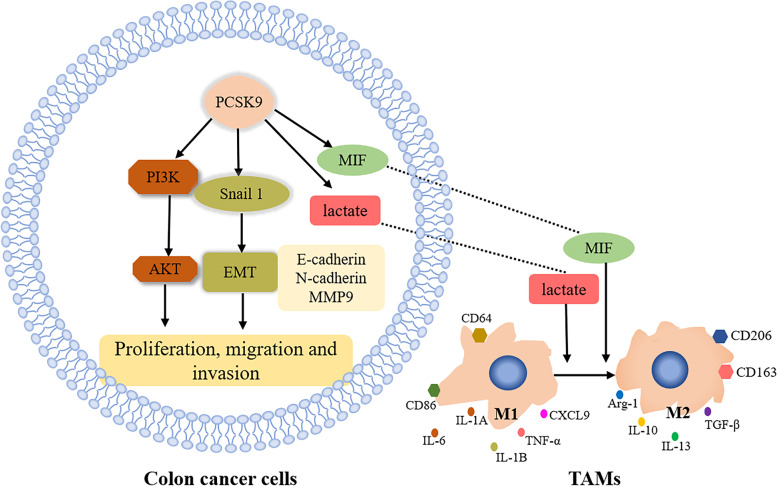
Results: PCSK9 expression was upregulated in colon cancer tissues versus the normal tissues, and associated with advanced tumor pathological grade. Knockdown of PCSK9 expression reduced colon cancer cell proliferation, migration, and invasion and suppressed tumor metastasis in vivo. PCSK9 directly or indirectly upregulated Snail 1 and in turn to downregulate E-cadherin expression, but upregulate N-cadherin and MMP9 levels and thereafter, to induce colon cancer cell epithelial-mesenchymal transition (EMT) process and activated PI3K/AKT signaling. However, PCSK9 overexpression showed the inverse effects on colon cancer cells. Knockdown of PCSK9 expression inhibited M2 macrophage polarization, but also promoted M1 macrophage polarization by reduction of lactate, protein lactylation and macrophage migration inhibitory factor (MIF) levels.

Conclusion: PCSK9 played an important role in the progression and metastasis of colon cancer by regulation of tumor cell EMT and PI3K/AKT signaling and in the phenotypic polarization of macrophages by mediating MIF and lactate levels. Targeting PCSK9 expression or activity could be used to effectively control colon cancer.

Keywords: AKT; Colon cancer; EMT; Macrophage polarization; PCSK9; PI3K.


Conflict of interest statement

The authors declare no competing interests.

Figures

Fig. 1
Fig. 1
Upregulated PCSK9 expression in colon cancer tissues. a, Immunohistochemical analysis of PCSK9 protein in colon cancer tissue microarray. b, Quantified data of immunohistochemistry. c, PCSK9 expression using TCGA dataset of 41 normal tissues and 286 colon adenocarcinoma tissues. *p < 0.05; ns, no significance
Fig. 2
Fig. 2
Reduction of colon cancer cell proliferation, migration, and invasion capacities after the reduction of PCSK9 expression in vitro. a-c, Western blot. HCT116 and HT-29 cells were grown and transfected with PCSK9 siRNA or PCSK9 shRNA and then subjected to Western blot analysis of PCSK9 expression. The graph is quantified data of Western blots (n = 3). d and e, Trypan blue exclusion assay and CCK-8 assay. Knockdown of PCSK9 expression decreased the viability of HCT116 and HT-29 cells at day 4 after transient transfaction. f, CCK-8 assay. Knockdown of PCSK9 expression decreased the proliferation of stable transfected cells at day 4 after seeding. g-i, Wound-healing assay. HCT116 and HT-29 cells were grown and transiently transfected with PCSK9 or control siRNA and then subjected to the assay. The graph is the quantified data of the assay. The data showed that PCSK9 silence reduced tumor cell wound healing rates of HCT116 and HT-29. Magnification, × 40. j, Transwell assay. HCT116 and HT-29 cells were grown and transiently transfected with PCSK9 or control siRNA, and then subjected to the Transwell assay. The data revealed that PCSK9 knockdown inhibited migration of HCT116 and HT-29 cells. Magnification, × 200. k, Transwell invasion assay. HCT116 and HT-29 cells were grown and transiently transfected with PCSK9 or control siRNA, and then subjected to the Transwell assay. The data showed that PCSK9 knockdown inhibited the invasion of HCT116 and HT-29 cells. Magnification, × 200. Con, control cells without transfection; NC, negative control cells transfected with negative control siRNA; KD, knockdown of PCSK9 cells transfected with PCSK9 siRNA. ns, no significance; hs, hours; ds, days. *p < 0.05; **p < 0.01; ***p < 0.001
Fig. 3
Fig. 3
Promotion of colon cancer cell proliferation, migration, and invasion after transfection in vitro. a-b, Western blot. HCT116 and HT-29 cells were grown and transiently transfected with plasmids carrying PCSK9 cDNA or vector only, and then subjected to Western blot analysis of PCSK9 expression at 48 hs or day 4 after transfaction. The graph is quantified data of Western blots (n = 3). c, Cell viability assay. HCT116 and HT-29 cells were grown and transiently transfected with plasmids carrying PCSK9 cDNA or vector only, and then subjected to CCK8 assay. The data showed that PCSK9 overexpression enhanced proliferation of HCT116 and HT-29 cells. d–f, Wound-healing assay. HCT116 and HT-29 cells were grown and transiently transfected with plasmids carrying PCSK9 cDNA or vector only, and then subjected to the assay. The data showed that PCSK9 overexpression induced wound-healing rates of HCT116 and HT-29 cells. Magnification, × 40. The graph is quantified data. g and h, Transwell assay. HCT116 and HT-29 cells were grown and transiently transfected with plasmids carrying PCSK9 cDNA or vector only, and then subjected to Transwell assays. The graphs are quantified data. The data revealed that enforced PCSK9 expression promoted tumor cell migration (g) and invasion capacities (h) of HCT116 and HT-29 cells. Magnification, × 200. Con, control cells without transfection; NC, negative control cells transfected with plasmids carrying vector; OE, overexpression of PCSK9 cells transfected with plasmids carrying PCSK9 cDNA. ns, no significance; hs, hours; ds, days. *p < 0.05; **p < 0.01; ***p < 0.001
Fig. 4
Fig. 4
Expression of colon cancer cell EMT-related proteins after manipulation of PCSK9 expression in vitro. a, c and d, Western blot. HCT116 and HT-29 cells were grown and transiently transfected with PCSK9 or control siRNA, and then subjected to Western blot analysis of protein expression at 48 hs after transfaction. The graph is quantified data of Western blots. The data revealed that PCSK9 knockdown increased level of E-cadherin protein, but reduced N-cadherin, MMP9, and Snail 1 proteins. b, e and f, Western blot. HCT116 and HT-29 cells were grown and transiently transfected with plasmids carrying PCSK9 cDNA or vector only, and then subjected to Western blot analysis of protein expression. The graph is quantified data of Western blots. The data showed that PCSK9 overexpression decreased level of E-cadherin protein, but increased level of N-cadherin, MMP9, and Snail 1 proteins. NC, negative control; KD, knockdown of PCSK9 cells transfected with PCSK9 siRNA; OE, overexpression of PCSK9 cells transfected with plasmids carrying PCSK9 cDNA. *p < 0.05; **p < 0.01; ***p < 0.001
Fig. 5
Fig. 5
PCSK9 activation of the PI3K/AKT signaling in colon cancer cells in vitro. a–f, Western blot. HCT116 and HT-29 cells were grown and transiently transfected with PCSK9 or control siRNA or with plasmids carrying PCSK9 cDNA or vector only, and then subjected to Western blot analysis of p-PI3K, p-AKT, and AKT expression (c and d, PCSK9 knockdown; e and f, PCSK9 overexpression). NC, negative control; KD, knockdown of PCSK9 cells transfected with PCSK9 siRNA; OE, overexpression of PCSK9 cells transfected with plasmids carrying PCSK9 cDNA. *p < 0.05, **p < 0.01; ***p < 0.001; ns, no significance
Fig. 6
Fig. 6
Proteomic analysis of differentially expressed proteins in colon cancer cells. a, The 4D-label-free quantitative proteomics by the gene ontology (GO) enrichment analysis. b, Subcellular localization of these differentially expressed proteins. c, The analysis identified statistics of differentially expressed proteins after PCSK9 knockdown in HCT116 cells. d, The volcano plot showed differential proteins associated with glycometabolism and immune reactions. e and f, Western blot. HCT116 and HT-29 cells were grown and transiently transfected with PCSK9 or control siRNA or with plasmids carrying PCSK9 cDNA or vector only and then subjected to Western blot analysis at 48 hs after transfaction. g, Western blot. HCT116 and HT-29 cells were grown and transiently transfected with PCSK9 or control siRNA or with plasmids carrying PCSK9 cDNA or vector only and then subjected to Western blot analysis of levels of protein lactylation. h, Concentration of lactate in the culture supernatant of HCT116 cells was established by Lactate Assay Kit. NC, negative control; KD, knockdown of PCSK9 cells transfected with PCSK9 siRNA; OE, overexpression of PCSK9 cells transfected with plasmids carrying PCSK9 cDNA. *p < 0.05; ***p < 0.001
Fig. 7
Fig. 7
Inhibition of macrophage activation after co-culture with colon cancer cells. a, Quantitation data based on the mean levels of western blots at 48 hs after transfaction (n = 3). b, Cell morphology of macrophages. THP-1 cells were grown and treated with 100 ng/ml of phorbol 12-myristate 13-acetate (PMA) for 48 h. c, qRT-PCR. The co-cultured THP-1 cells were analyzed for mRNA levels of the M1 or M2 macrophages markers using qRT-PCR. d, Western blot. The co-cultured THP-1 cells were analyzed for CD163 and iNOS proteins using Western blot. e, Flow cytometry. The co-cultured THP-1 cells were analyzed for CD86+ macrophages. NC, negative control cells transfected with negative control siRNA; KD, knockdown of PCSK9 cells transfected with PCSK9 siRNA. *p < 0.05; **p < 0.01; ***p < 0.001
Fig. 8
Fig. 8
Inhibition of colon cancer cell metastasis after knockdown of PCSK9 expression in vivo. a, Fluorescence microscopy. HCT116 and HT-29 cells were grown and infected with lentivirus carrying PCSK9 siRNA or negative control siRNA for 48 h, and then subjected to fluorescence microscopy. b–d, qRT-PCR and Western blot. The assays confirmed the PCSK9 protein knockdown in tumor cells. e, Nude mouse xenograft model. Morphology of lung metastasis in PCSK9 deficiency HCT116 cells. f, The tail vein-lung metastasis model. Cells were injected into the tail vein to produce tumor cell lung metastasis. g, H&E staining. Lung and liver tissues were resected at the end of experiment and processed for tissue section and H&E staining to show histopathological changes of the lung and liver. Scale bar, 500 µm (a low magnification) or 50 µm (a high magnification). NC, negative control; *p < 0.05; **p < 0.01; ***p < 0.001
Fig. 9
Fig. 9
Illustration of PCSK9 oncogenic activity in colon cancer. PCSK9 protein promotes colon cancer cell proliferation and metastasis by activation of the PI3K/AKT pathway and tumor cell EMT. PCSK9 also induces M2 macrophage polarization might through changes in lactate and MIF levels; thus, PCSK9 inhibition could reverse this trend; thereby enhancing human body antitumor immunity

Similar articles

Cited by

References

    1. Sung H, Ferlay J, Siegel RL, Laversanne M, Soerjomataram I, Jemal A, Bray F. Global Cancer Statistics 2020: GLOBOCAN Estimates of Incidence and Mortality Worldwide for 36 Cancers in 185 Countries. CA Cancer J Clin. 2021;71(3):209–249. doi: 10.3322/caac.21660. - DOI - PubMed
    1. Bray F, Ferlay J, Soerjomataram I, Siegel RL, Torre LA, Jemal A. Global cancer statistics 2018: GLOBOCAN estimates of incidence and mortality worldwide for 36 cancers in 185 countries. CA- Cancer J Clin. 2018;68(6):394–424. doi: 10.3322/caac.21492. - DOI - PubMed
    1. Ferlay J, Ervik M, Lam F, Colombet M, Mery L, Pieros M, Znaor A, Soerjomataram I, Bray F. Global Cancer Observatory: Cancer Today. Lyon, France: International Agency for Research on Cancer. 2018. https://gco.iarc.fr/today. Accessed 20 Feb 2019.
    1. Dekker E, Tanis PJ, Vleugels JLA, Kasi PM, Wallace MB. Colorectal cancer. Lancet. 2019;394(10207):1467–1480. doi: 10.1016/S0140-6736(19)32319-0. - DOI - PubMed
    1. Hu XH, Niu WB, Zhang JF, Li BK, Yu B, Zhang ZY, Zhou CX, Zhang XN, Gao Y, Wang GY. Treatment strategies for colorectal cancer patients in tumor hospitals under the background of corona virus disease. Zhonghua Wei Chang Wai Ke Za Zhi. 2020;23(3):201–208. doi: 10.3760/cma.j.cn.441530-20200217-00058. - DOI - PubMed

MeSH terms