. 2022 Dec 6;121(23):4714-4728.
doi: 10.1016/j.bpj.2022.10.016. Epub 2022 Oct 14.

Mechanisms of frustrated phagocytic spreading of human neutrophils on antibody-coated surfaces

Affiliations

Mechanisms of frustrated phagocytic spreading of human neutrophils on antibody-coated surfaces

Emmet A Francis et al. Biophys J. .

Abstract

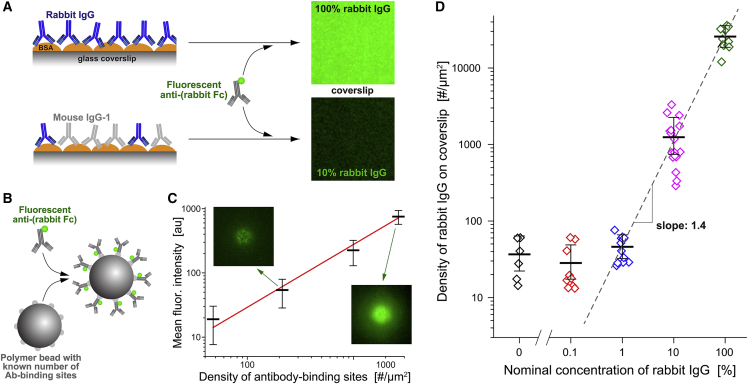
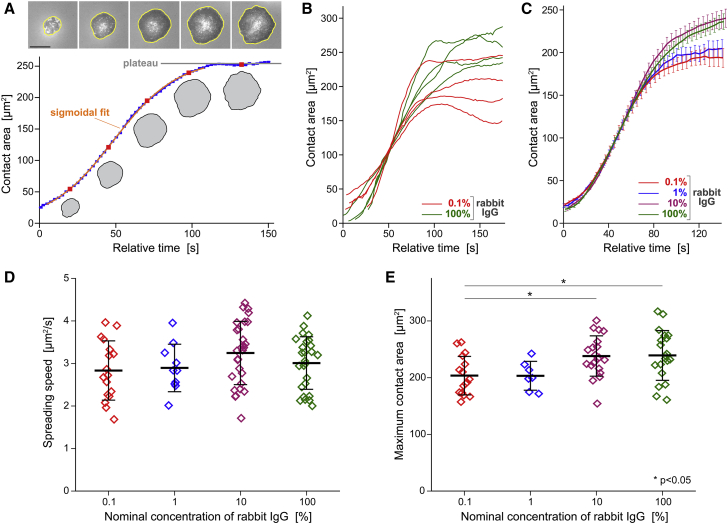
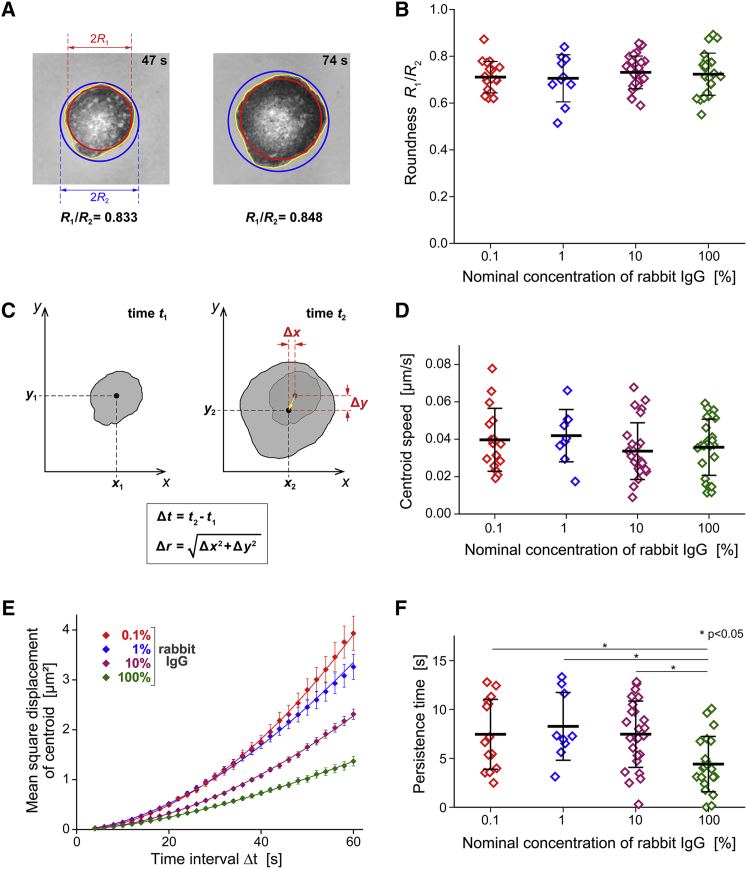
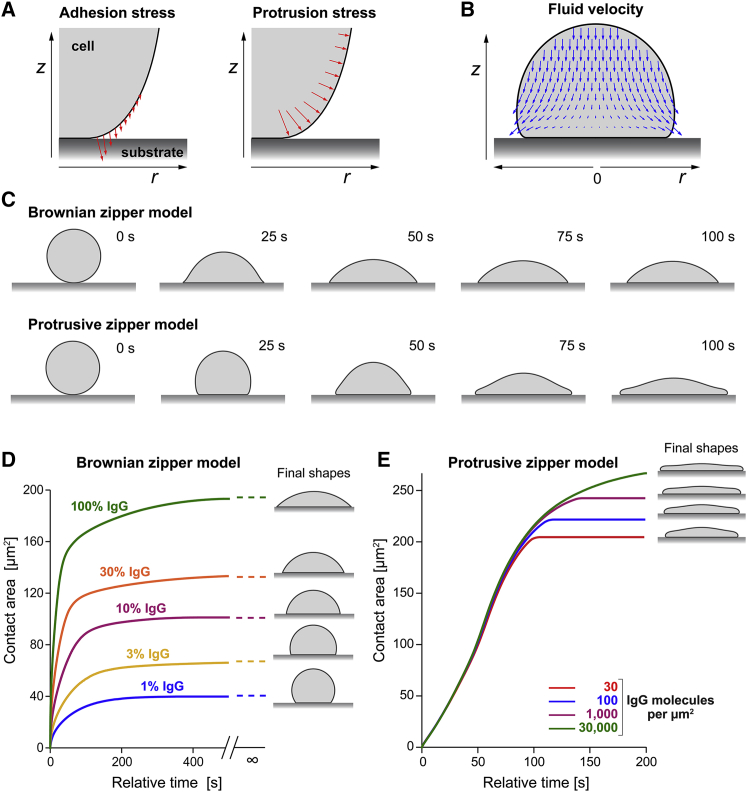
Complex motions of immune cells are an integral part of diapedesis, chemotaxis, phagocytosis, and other vital processes. To better understand how immune cells execute such motions, we present a detailed analysis of phagocytic spreading of human neutrophils on flat surfaces functionalized with different densities of immunoglobulin G (IgG) antibodies. We visualize the cell-substrate contact region at high resolution and without labels using reflection interference contrast microscopy and quantify how the area, shape, and position of the contact region evolves over time. We find that the likelihood of the cell commitment to spreading strongly depends on the surface density of IgG, but the rate at which the substrate-contact area of spreading cells increases does not. Validated by a theoretical companion study, our results resolve controversial notions about the mechanisms controlling cell spreading, establishing that active forces generated by the cytoskeleton rather than cell-substrate adhesion primarily drive cellular protrusion. Adhesion, on the other hand, aids phagocytic spreading by regulating the cell commitment to spreading, the maximum cell-substrate contact area, and the directional movement of the contact region.


Conflict of interest statement

Declaration of interests The authors declare no competing interests.

Figures

Figure 1
Figure 1
Preparation of substrates with controlled rabbit IgG surface density. (A) BSA-coated glass coverslips that had been incubated with various ratios of rabbit and mouse anti-BSA antibodies were labeled with green fluorescent secondary antibodies and then imaged on a confocal microscope. (B) Standard beads with known numbers of antibody-binding sites were saturated with the same fluorescent secondary antibody as used in (A). (C) The fluorescence intensity at the underside of the coated beads was measured with the same confocal-microscope settings as used in (A). (For a more detailed explanation see Fig. S1.) The results, along with a straight line fit (solid line), are presented as a function of the known density of antibody-binding sites in a log-log plot. Error bars denote the geometric standard deviation. Examples of confocal bead images are included. (D) The calibration curve of (C) was used to convert the measured fluorescence intensities of labeled coverslips into the rabbit IgG density. The geometric mean values (with error bars denoting geometric standard deviation) of the IgG density are plotted as a function of the concentration of rabbit IgG used in the incubation buffer. The result of a linear fit (dashed line) to the portion of the data obtained at IgG concentrations of 1% or higher is included. For better visibility, log-transformed fluorescence images are shown in (A and C).
Figure 2
Figure 2
Illustration of a frustrated phagocytic spreading experiment. (A) Parts and assembly of the experiment chamber. (B) After settling onto the functionalized coverslip, initially passive, round cells recognize the deposited antibodies and spread along the surface. (C) Reflection interference contrast microscopy allows us to visualize the cell-substrate contact area label-free at high resolution. The combination of polarizing beamsplitter and quarter-wave plate (QWP) ensures that the light components reflected off the coverslip top surface and the cell are the dominant contributions to the recorded interference pattern. (D) Example snapshots from a series of recorded video images of the dark cell-substrate contact area (see also Video S1). Timestamps are included. Scale bar, 10 μm.
Figure 3
Figure 3
Dependence of the spreading probability on the surface density of IgG. (A) At low surface densities of rabbit IgG, the majority of deposited cells do not spread and appear as bright, out-of-focus spots in our RICM images (top panel). In contrast, almost all cells spread on surfaces coated with the highest density of rabbit IgG (bottom panel). Scale bars, 50 μm. (B) The spreading probability depends strongly on the nominal concentration of rabbit IgG, confirming that the observed cell response is IgG specific. Spearman’s rank correlation coefficient ρ is reported with the associated p value for the null hypothesis ρ = 0. Also included is the spreading probability of neutrophils deposited on BSA-coated surfaces in the absence of IgG. Error bars denote standard deviation.
Figure 4
Figure 4
Overview of the human neutrophil response to IgG-coated surfaces. (A) The first four snapshots of each video sequence illustrate the common morphology of the cell footprint observed during the outward-spreading phase of almost all cells (see also Video S1). In contrast, three qualitatively distinct types of postspreading cell behavior were observed, as illustrated in the last two snapshots of each video sequence. Time stamps are included. Scale bars, 10 μm. (B) Contours of the cell footprint of the first four images of the respective video sequences of (A) demonstrate the roughly symmetric cell morphology during spreading. Scale bars, 10 μm. (C) The table reports the fractions of cells that exhibit one of the three types of postspreading behavior for each of the tested IgG concentrations. On low densities of IgG, the majority of cells attempted to migrate after reaching a maximum cell-substrate contact area. In contrast, on high IgG densities the majority of cells remained in place and exhibited few further shape changes.
Figure 5
Figure 5
Quantitative analysis of the cell-substrate contact area of spreading cells. (A) The contact area is determined from a polygonal trace of the circumference of each cell footprint (bright polygons in the examples included at the top). Scale bar, 10 μm. A suitable fit to the time-dependent contact area yields the (maximum) spreading speed. The plateau value of the contact-area curves provides the maximum contact area. (B) Representative examples of contact-area-versus-time curves measured on the lowest and highest IgG densities illustrate the variability of the dynamical behavior of the cell footprint. (C) Average curves of all suitable area-versus-time measurements obtained for each tested rabbit IgG density expose a largely conserved spreading speed. On the other hand, the maximum contact area appears to reach greater values on high IgG densities. Error bars denote standard errors. (D) The summary of all spreading speeds measured over three orders of magnitude of the IgG concentration confirms that the spreading speed is independent of the surface density of IgG. (E) The summary of maximum contact areas reveals a small but significant increase of the contact area at high densities of IgG. Error bars in (D and E) denote standard deviation.
Figure 6
Figure 6
Roundness and type of motion of the footprints of spreading cells. (A) The roundness of the cell-substrate contact region was assessed in terms of the ratio between the radii of the largest inscribed and the smallest circumscribed circles, as illustrated with two examples. (B) The summary of all roundness measurements reveals no significant differences on surfaces coated with different IgG densities. (C) Illustration of our measurement of the displacement Δr of the centroid of the cell footprint during the time interval Δt. (D) The summary of all centroid-speed measurements reveals no significant differences on surfaces coated with different IgG densities. (E) The mean-square displacements of the centroid as a function of Δt (averaged over all suitable measurements obtained for each tested rabbit IgG density; error bars denote standard errors) allow us to quantify the degree of randomness of the centroid motion. The included solid lines show power-law fits of the form y = axb to the data. (F) The summary of all measured directional persistence times reveals that on the highest density of IgG, the cell footprint tended to move in roughly the same direction for significantly shorter times than on lower IgG densities. For more details see the text.
Figure 7
Figure 7
Summary of pertinent predictions by two different mechanistic models of cell spreading. (A) The models incorporate attractive interactions between the cell surface and the substrate via short-range adhesion stress (left panel). The protrusive zipper model postulates that the cell interior generates protrusion stress local to the leading edge of the spreading cell in a manner that depends on fresh contact between the cell and substrate (right panel). (B) A snapshot of a computer simulation of a spreading model cell illustrates the motion of the viscous cell interior according to the Stokes equations for creeping flow. (C) Time series of cross-sectional shapes of spreading model cells illustrate morphological differences between the predictions of the two considered models. (D) The Brownian zipper model predicts that both the cell-spreading speed as well as the maximum contact area exhibit a strong dependence on the surface density of IgG coating the substrate. The final shapes are predicted to be spherical caps in this case. These predictions fail to reproduce experimental observations such as presented in Fig. 5. (E) In agreement with our experimental results (Fig. 5, C and D), the spreading speeds predicted by the protrusive zipper model are essentially independent of the IgG density, and the IgG dependence of the maximum contact area is much weaker than in (D).

Similar articles

Cited by

References

    1. Francis E.A., Heinrich V. Mechanistic understanding of single-cell behavior is essential for transformative advances in Biomedicine. Yale J. Biol. Med. 2018;91:279–289. - PMC - PubMed
    1. Cougoule C., Wiedemann A., et al. Caron E. Phagocytosis, an alternative model system for the study of cell adhesion. Semin. Cell Dev. Biol. 2004;15:679–689. - PubMed
    1. Flannagan R.S., Jaumouillé V., Grinstein S. The cell biology of phagocytosis. Annu. Rev. Pathol. 2012;7:61–98. - PubMed
    1. Lim J.J., Grinstein S., Roth Z. Diversity and versatility of phagocytosis: roles in innate immunity, tissue remodeling, and homeostasis. Front. Cell. Infect. Microbiol. 2017;7:191. - PMC - PubMed
    1. Bournazos S., Wang T.T., Ravetch J.V. The role and function of fcgamma receptors on myeloid cells. Microbiol. Spectr. 2016;4 - PMC - PubMed

Substances