. 2022 Oct 8:13:1094-1108.
doi: 10.18632/oncotarget.28279.

In vitro chemotherapy-associated muscle toxicity is attenuated with nutritional support, while treatment efficacy is retained

Affiliations

In vitro chemotherapy-associated muscle toxicity is attenuated with nutritional support, while treatment efficacy is retained

Liza A Wijler et al. Oncotarget. .

Abstract

Purpose: Muscle-wasting and treatment-related toxicities negatively impact prognosis of colorectal cancer (CRC) patients. Specific nutritional composition might support skeletal muscle and enhance treatment support. In this in vitro study we assess the effect of nutrients EPA, DHA, L-leucine and vitamin D3, as single nutrients or in combination on chemotherapy-treated C2C12-myotubes, and specific CRC-tumor cells.

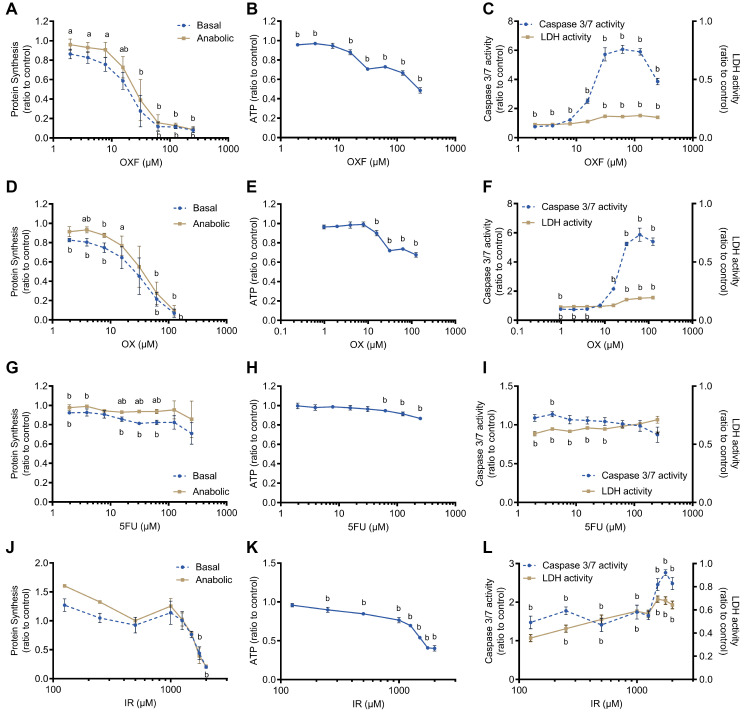
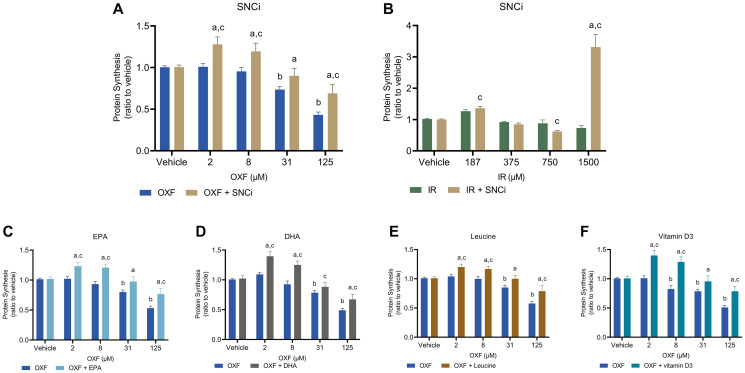
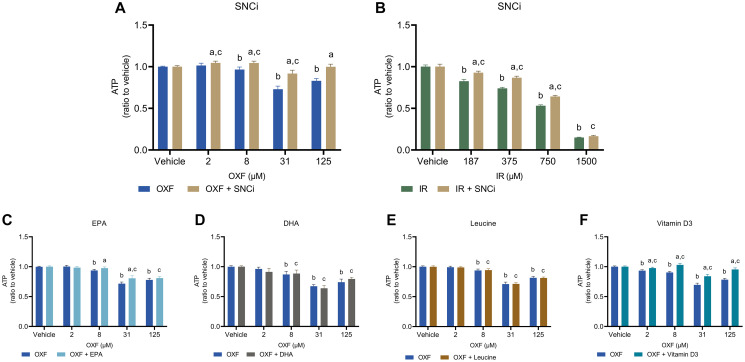
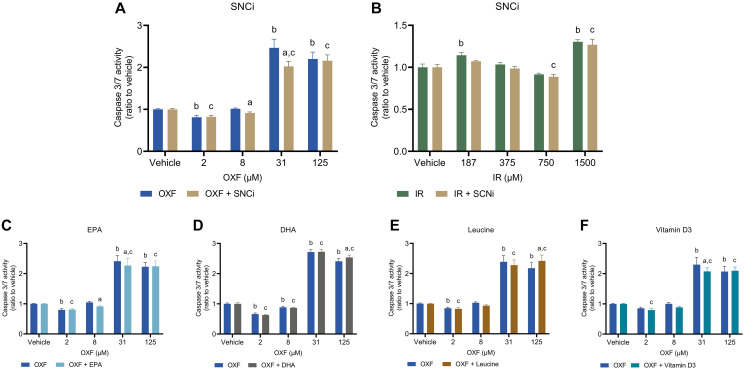
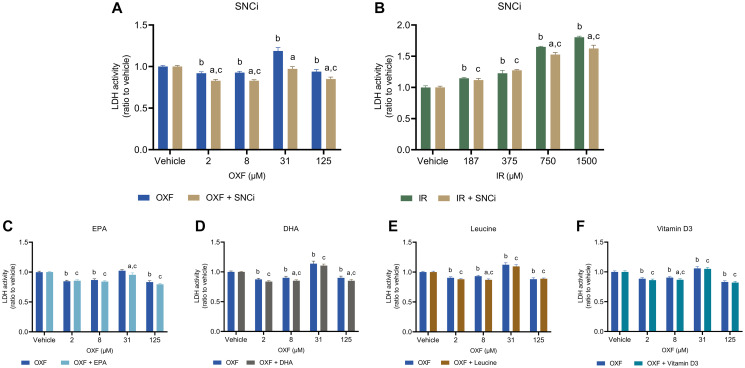
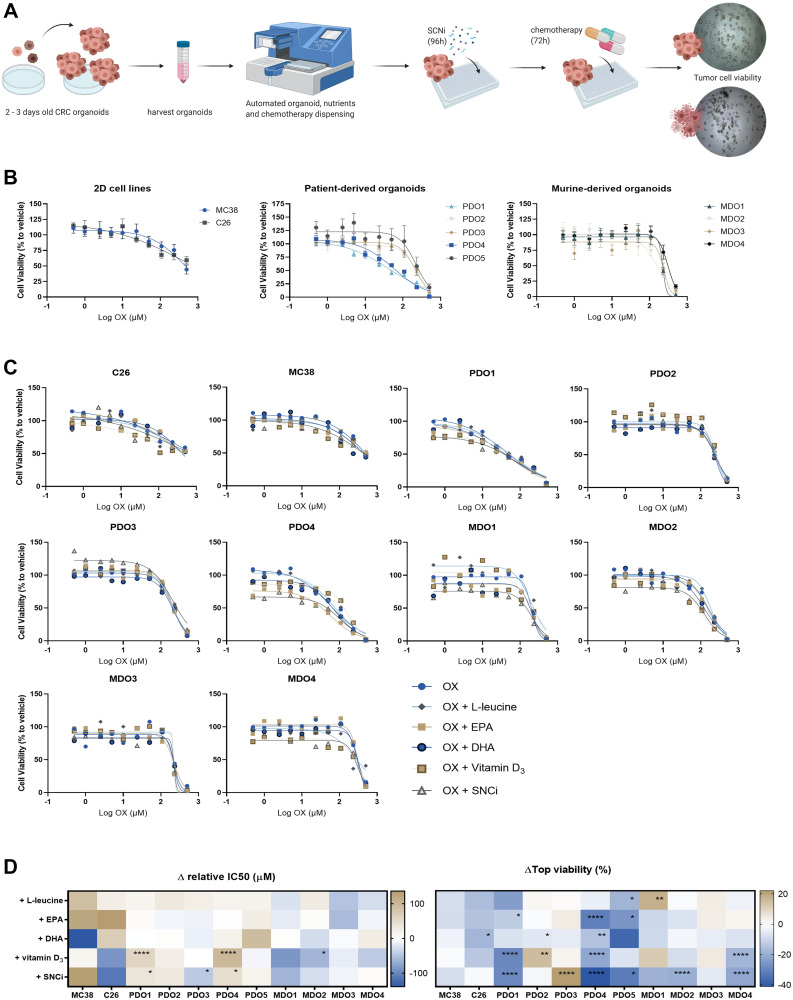
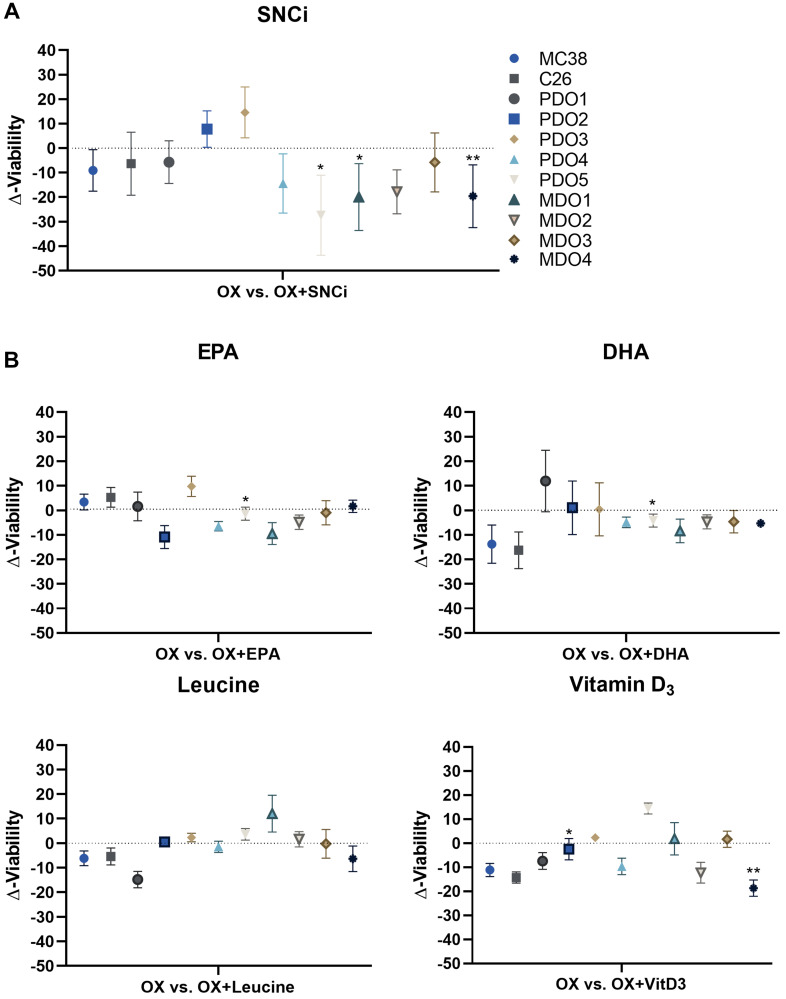
Materials and methods: Using C2C12-myotubes, the effects of chemotherapy (oxaliplatin, 5-fluorouracil, oxaliplatin+5-fluorouracil and irinotecan) on protein synthesis, cell-viability, caspase-3/7-activity and LDH-activity were assessed. Addition of EPA, DHA, L-leucine and vitamin D3 and their combination (SNCi) were studied in presence of above chemotherapies. Tumor cell-viability was assessed in oxaliplatin-treated C26 and MC38 CRC cells, and in murine and patient-derived CRC-organoids.

Results: While chemotherapy treatment of C2C12-myotubes decreased protein synthesis, cell-viability and increased caspase-3/7 and LDH-activity, SNCi showed improved protein synthesis and cell viability and lowered LDH activity. The nutrient combination SNCi showed a better overall performance compared to the single nutrients. Treatment response of tumor models was not significantly affected by addition of nutrients.

Conclusions: This in vitro study shows protective effect with specific nutrition composition of C2C12-myotubes against chemotherapy toxicity, which is superior to the single nutrients, while treatment response of tumor cells remained.

Keywords: C2C12 myotubes; chemotherapy; chemotherapy-associated toxicity; colorectal cancer; nutrients; tumor (organoid) cells.


Conflict of interest statement

CONFLICTS OF INTEREST

All authors have no relevant conflicts of interest to disclose. Francina Dijk, Hanil Quirindongo, Mathew Furber, Bram Dorresteijn and Miriam van Dijk are employees of Danone Nutricia Research, Utrecht, The Netherlands. Liza Wijler, Danielle Raats, Anne May and Onno Kranenburg are employees of University Medical Center Utrecht, Utrecht, The Netherlands.

Figures

Figure 1
Figure 1. Effect of chemotherapy treatments on C2C12 myotubes.
(A, D, G, J) Protein synthesis after 24 h chemotherapy treatment with oxaliplatin + 5-fluorouracil (OXF), oxaliplatin (OX), 5-fluorouracil (5FU) and irinotecan (IR). Protein synthesis was measured after chemotherapy incubation followed by 4 h deprivation of serum and L-leucine and 1 h incubation with 100 nM insulin and 5 mM L-leucine (anabolic) or without insulin and L-leucine (basal). (B, E, H, K) Cell viability after 24 h chemotherapy treatment with OXF, OX, 5FU and IR. (C, F, I, L) Caspase 3/7 activity and LDH activity after 24 h chemotherapy with OXF, OX, 5FU and IR. Values are mean ± SEM expressed as ratio to control, statistical differences were tested using a mixed model ANOVA, post hoc LSD (protein synthesis) or Student t-test (cell viability, caspase 3/7 activity and LDH activity). Significances are shown as ‘a’ = p < 0.05 of anabolic vs. basal condition with same chemotherapy concentration, ‘b’ = p < 0.05 of chemotherapy treatment vs control without chemotherapy.
Figure 2
Figure 2. Basal protein synthesis in C2C12 myotubes after 48 h chemotherapy treatment with individual nutrients or SNCi.
(A, B) C2C12 myotubes were treated with SNCi for 24 h and after this OXF or IR were added for another 24 h. Basal protein synthesis was measured after 4 h deprivation of serum and L-leucine followed by 1 h incubation without anabolic trigger of which the final 30 min in presence of 1 μM puromycin. (CF) Effect of individual nutrients EPA, DHA, L-leucine and vitamin D3 on protein synthesis after OXF treatment. Values are mean ± SEM expressed as ratio to vehicle, statistical differences were tested using a mixed model ANOVA, post hoc LSD. Significances are shown as ‘a’ = p < 0.05 of chemo + nutrient vs. chemo control at same chemo concentration, ‘b’ = p < 0.05 of chemo vs. vehicle control, ‘c’= p < 0.05 of chemo + nutrient vs. vehicle control.
Figure 3
Figure 3. Cell viability of C2C12 myotubes after 24 h chemotherapy treatment with individual nutrients or SNCi.
Cell viability was determined by measuring cellular ATP content with the CellTiter-Glo assay®. (A, B) Effect of SNCi on OXF and IR treated C2C12 myotubes. (CF) Effect of individual nutrients EPA, DHA, L-leucine and vitamin D3 on protein synthesis after OXF treatment. Values are mean ± SEM expressed as ratio to vehicle, statistical differences were tested using a mixed model ANOVA, post hoc LSD. Significances are shown as ‘a’ = p < 0.05 of nutrient vs. control at same OXF concentration, ‘b’ = p < 0.05 of OXF vs. vehicle without nutrient, ‘c’= p < 0.05 of OXF vs. vehicle with nutrient.
Figure 4
Figure 4. Caspase 3/7 activity of C2C12 myotubes after 24 h chemotherapy treatment with individual nutrients or SNCi.
(A, B) Effect of SNCi on OXF and IR treated C2C12 myotubes. (CF) Effect of individual nutrients EPA, DHA, L-leucine and vitamin D3 on protein synthesis after OXF treatment. Values are mean ± SEM expressed as ratio to vehicle, statistical differences were tested using a mixed model ANOVA, post hoc LSD. Significances are shown as ‘a’ = p < 0.05 of nutrient vs. control at same OXF concentration, ‘b’ = p < 0.05 of OXF vs. vehicle without nutrient, ‘c’= p < 0.05 of OXF vs. vehicle with nutrient.
Figure 5
Figure 5. LDH activity of C2C12 myotubes after 24 h chemotherapy treatment with individual nutrients or SNCi.
(A, B) Effect of SNCi on OXF and IR treated C2C12 myotubes. (CF) Effect of individual nutrients EPA, DHA, L-leucine and vitamin D3 on protein synthesis after OXF treatment. Values are mean ± SEM expressed as ratio to vehicle, statistical differences were tested using a mixed model ANOVA, post hoc LSD. Significances are shown as ‘a’ = p < 0.05 of nutrient vs. control at same OXF concentration, ‘b’ = p < 0.05 of OXF vs. vehicle without nutrient, ‘c’= p < 0.05 of OXF vs. vehicle with nutrient.
Figure 6
Figure 6. Cell viability of colorectal cancer (CRC) in vitro tumor models after chemotherapy treatment with individual nutrients and SNCi.
(A) Experimental overview, expansion of organoids after 2–3 days after single-cell making, harvesting and dispensing organoids in 384 wells plates. Recovery overnight, followed by automatic dispensing of SNCi nutrients (96 h incubation) and oxaliplatin chemotherapy (72 h incubation). Cell viability measured by Cell Titer Glo 2.0 assay. (B) Cell viability curves of OX treated cell lines, PDOs and MDOs. Cell viability (%) is expressed as relative to vehicle without chemotherapy treatment or nutritional support. (C) Individual cell viability curves of colorectal cancer (CRC) in vitro tumor models treated with OX and individual nutrients or SNCi. Cell viability (%) is expressed as relative to vehicle without chemotherapy treatment or nutritional supplementation. (D) Delta values of relative IC50 (μM) and top viability (%) of in vitro tumor models after supplementation with L-leucine, EPA, DHA, vitamin D3 or SNCi. IC50 values are expressed as relative IC50 values, as not all curves start at 100% viability. Top viability represents the highest cell viability value in the curve (usually at low concentrations) and values with nutritional supplementation are expressed as delta to OX treatment alone. Abbreviations: PDO: patient-derived CRC tumor organoids; MDO: mouse-derived CRC tumor organoids. * p < 0.05; ** p < 0.01; *** p < 0.001; **** p < 0.0001.
Figure 7
Figure 7. Delta cell viability of colorectal cancer (CRC) in vitro tumor models after chemotherapy treatment with individual nutrients and SNCi.
(A) Averages of delta cell viability (Δ-viability) of individual in vitro tumor models after supplementation with SNCi. (B) Averages of delta cell viability (Δ-viability) of individual in vitro tumor models after supplementation with EPA, DHA, L-leucine and vitamin D3. Significances are represented as * p < 0.05; ** p < 0.01; *** p < 0.001; **** p < 0.0001. Abbreviations: PDO: patient-derived CRC tumor organoid; MDO: murine-derived CRC tumor organoid.

Similar articles

References

    1. Sung H, Ferlay J, Siegel RL, Laversanne M, Soerjomataram I, Jemal A, Bray F. Global Cancer Statistics 2020: GLOBOCAN Estimates of Incidence and Mortality Worldwide for 36 Cancers in 185 Countries. CA Cancer J Clin. 2021; 71:209–49. 10.3322/caac.21660. - DOI - PubMed
    1. Anker MS, Holcomb R, Muscaritoli M, von Haehling S, Haverkamp W, Jatoi A, Morley JE, Strasser F, Landmesser U, Coats AJS, Anker SD. Orphan disease status of cancer cachexia in the USA and in the European Union: a systematic review. J Cachexia Sarcopenia Muscle. 2019; 10:22–34. 10.1002/jcsm.12402. - DOI - PMC - PubMed
    1. Baracos VE, Martin L, Korc M, Guttridge DC, Fearon KCH. Cancer-associated cachexia. Nat Rev Dis Primers. 2018; 4:17105. 10.1038/nrdp.2017.105. - DOI - PubMed
    1. Fearon K, Strasser F, Anker SD, Bosaeus I, Bruera E, Fainsinger RL, Jatoi A, Loprinzi C, MacDonald N, Mantovani G, Davis M, Muscaritoli M, Ottery F, et al.. Definition and classification of cancer cachexia: an international consensus. Lancet Oncol. 2011; 12:489–95. 10.1016/S1470-2045(10)70218-7. - DOI - PubMed
    1. Argilés JM, Stemmler B, López-Soriano FJ, Busquets S. Inter-tissue communication in cancer cachexia. Nat Rev Endocrinol. 2018; 15:9–20. 10.1038/s41574-018-0123-0. - DOI - PubMed

Publication types