. 2022 Oct 27;185(22):4190-4205.e25.
doi: 10.1016/j.cell.2022.09.024. Epub 2022 Oct 14.

Nociceptor neurons direct goblet cells via a CGRP-RAMP1 axis to drive mucus production and gut barrier protection

Affiliations

Nociceptor neurons direct goblet cells via a CGRP-RAMP1 axis to drive mucus production and gut barrier protection

Daping Yang et al. Cell. .

Abstract

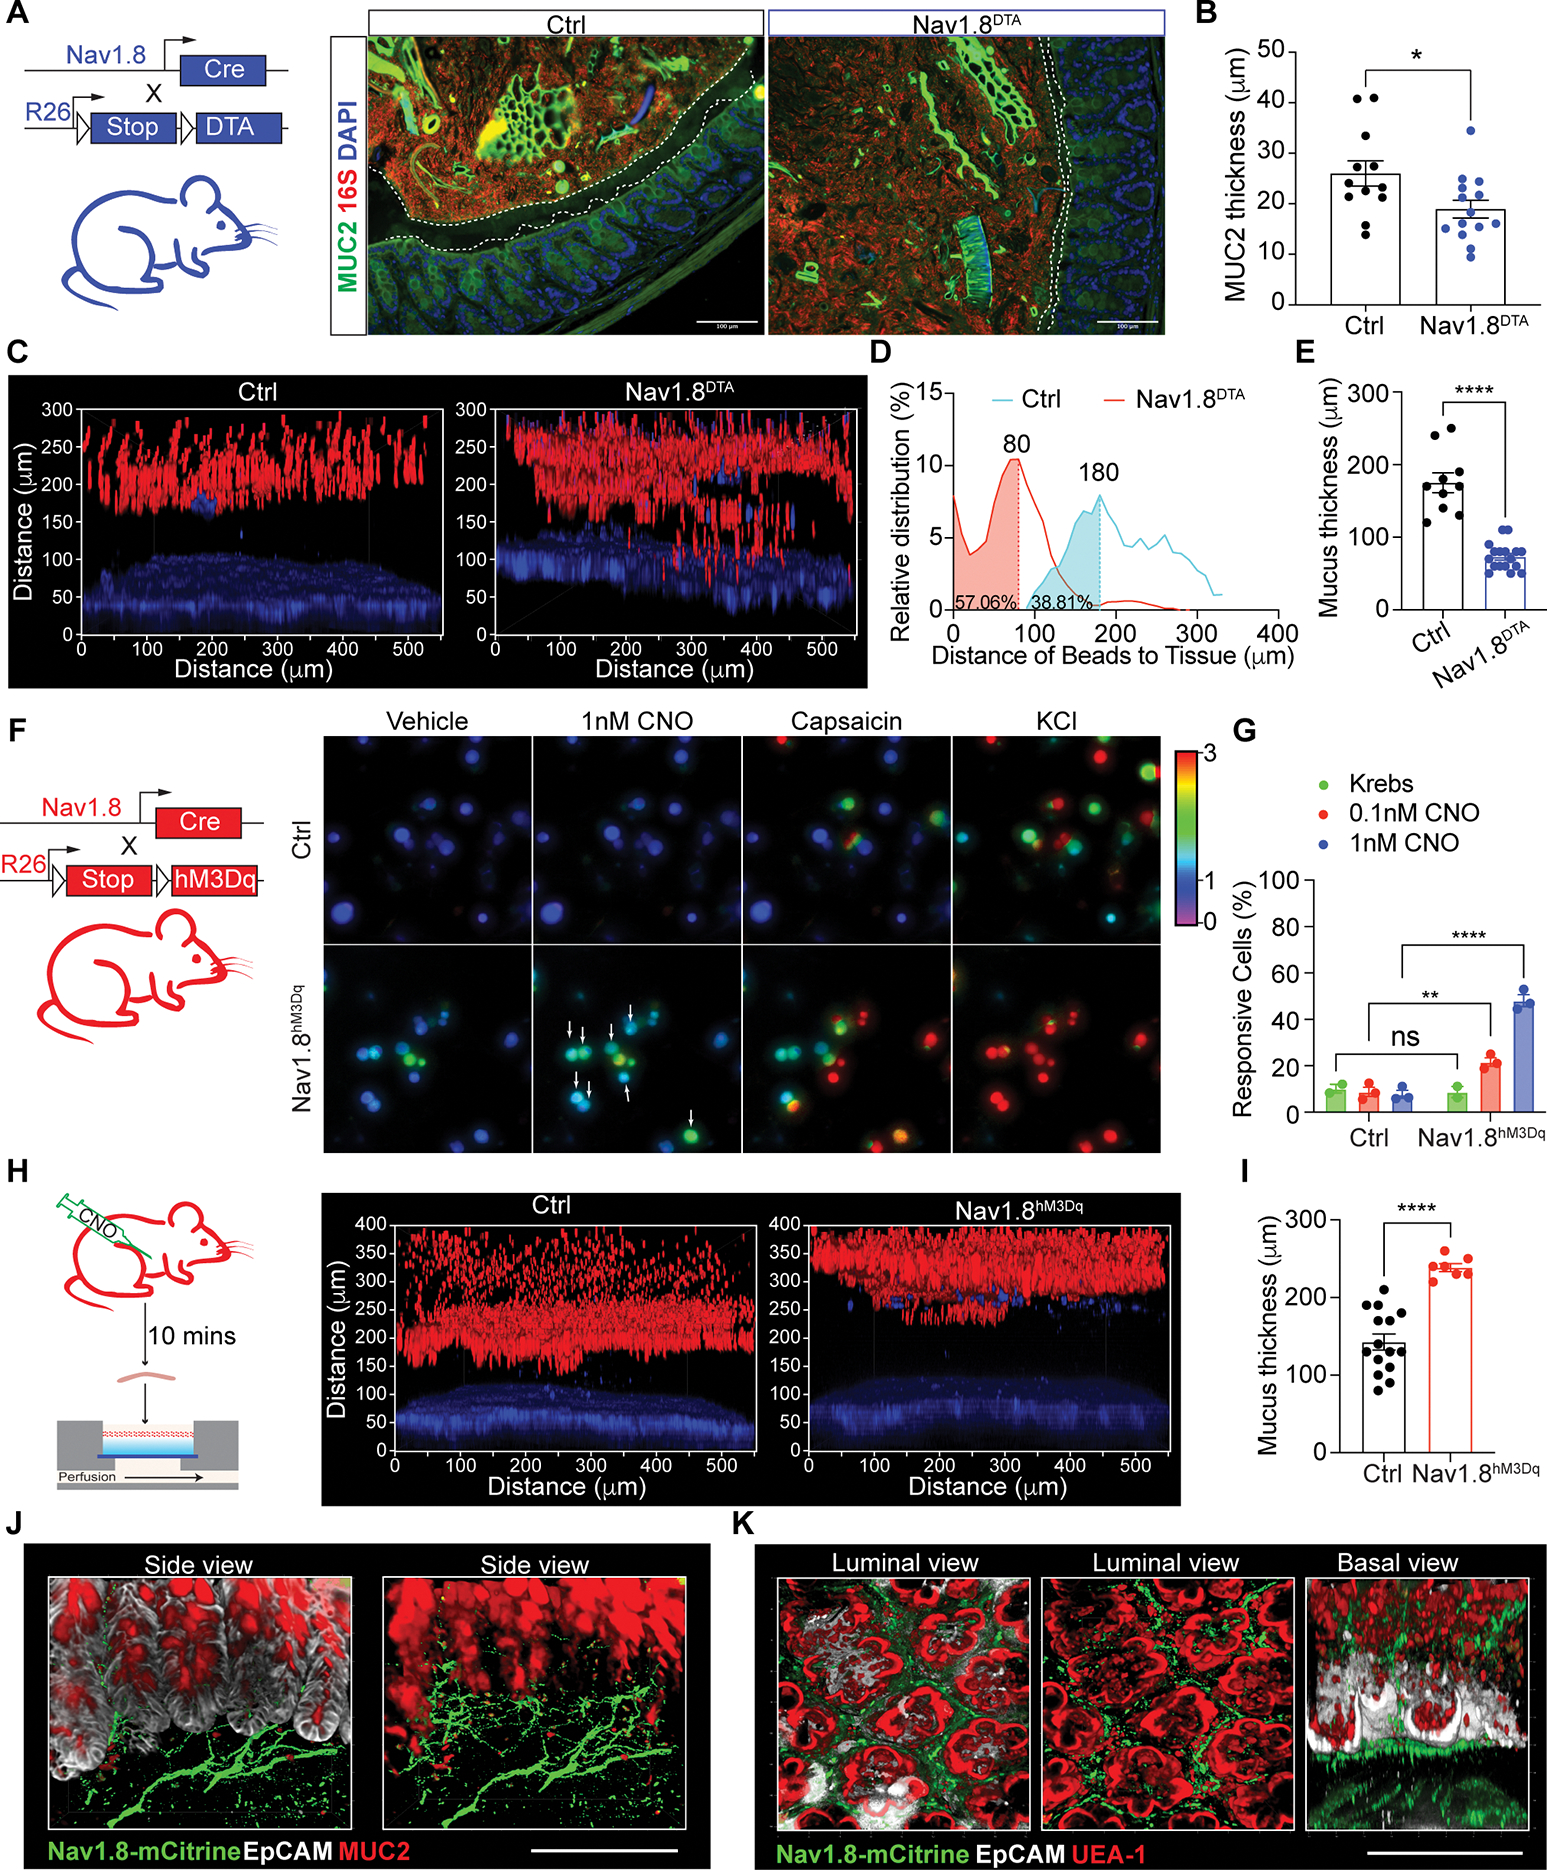
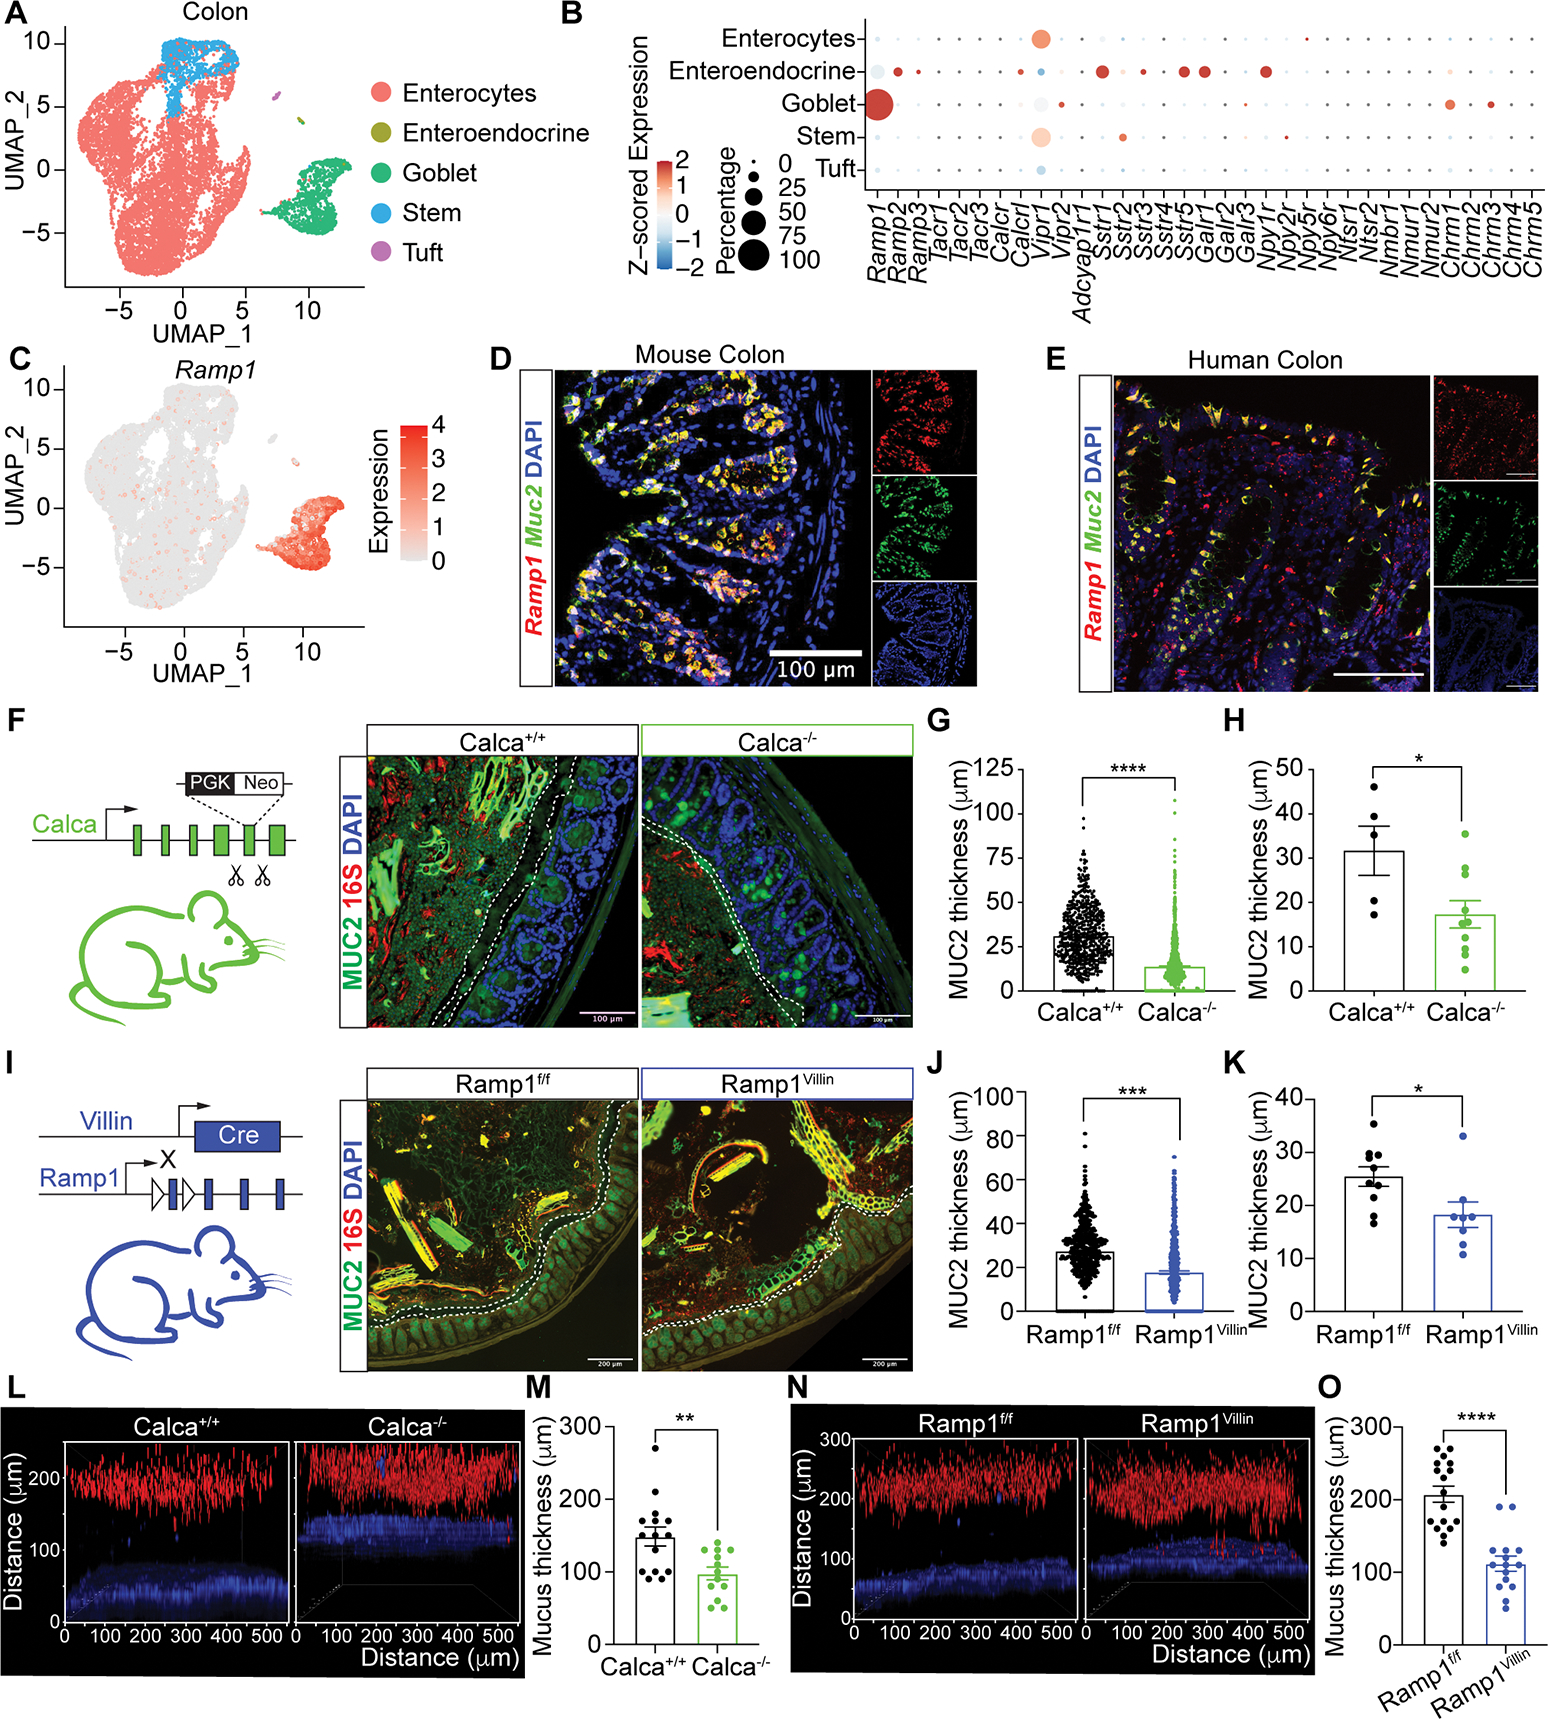
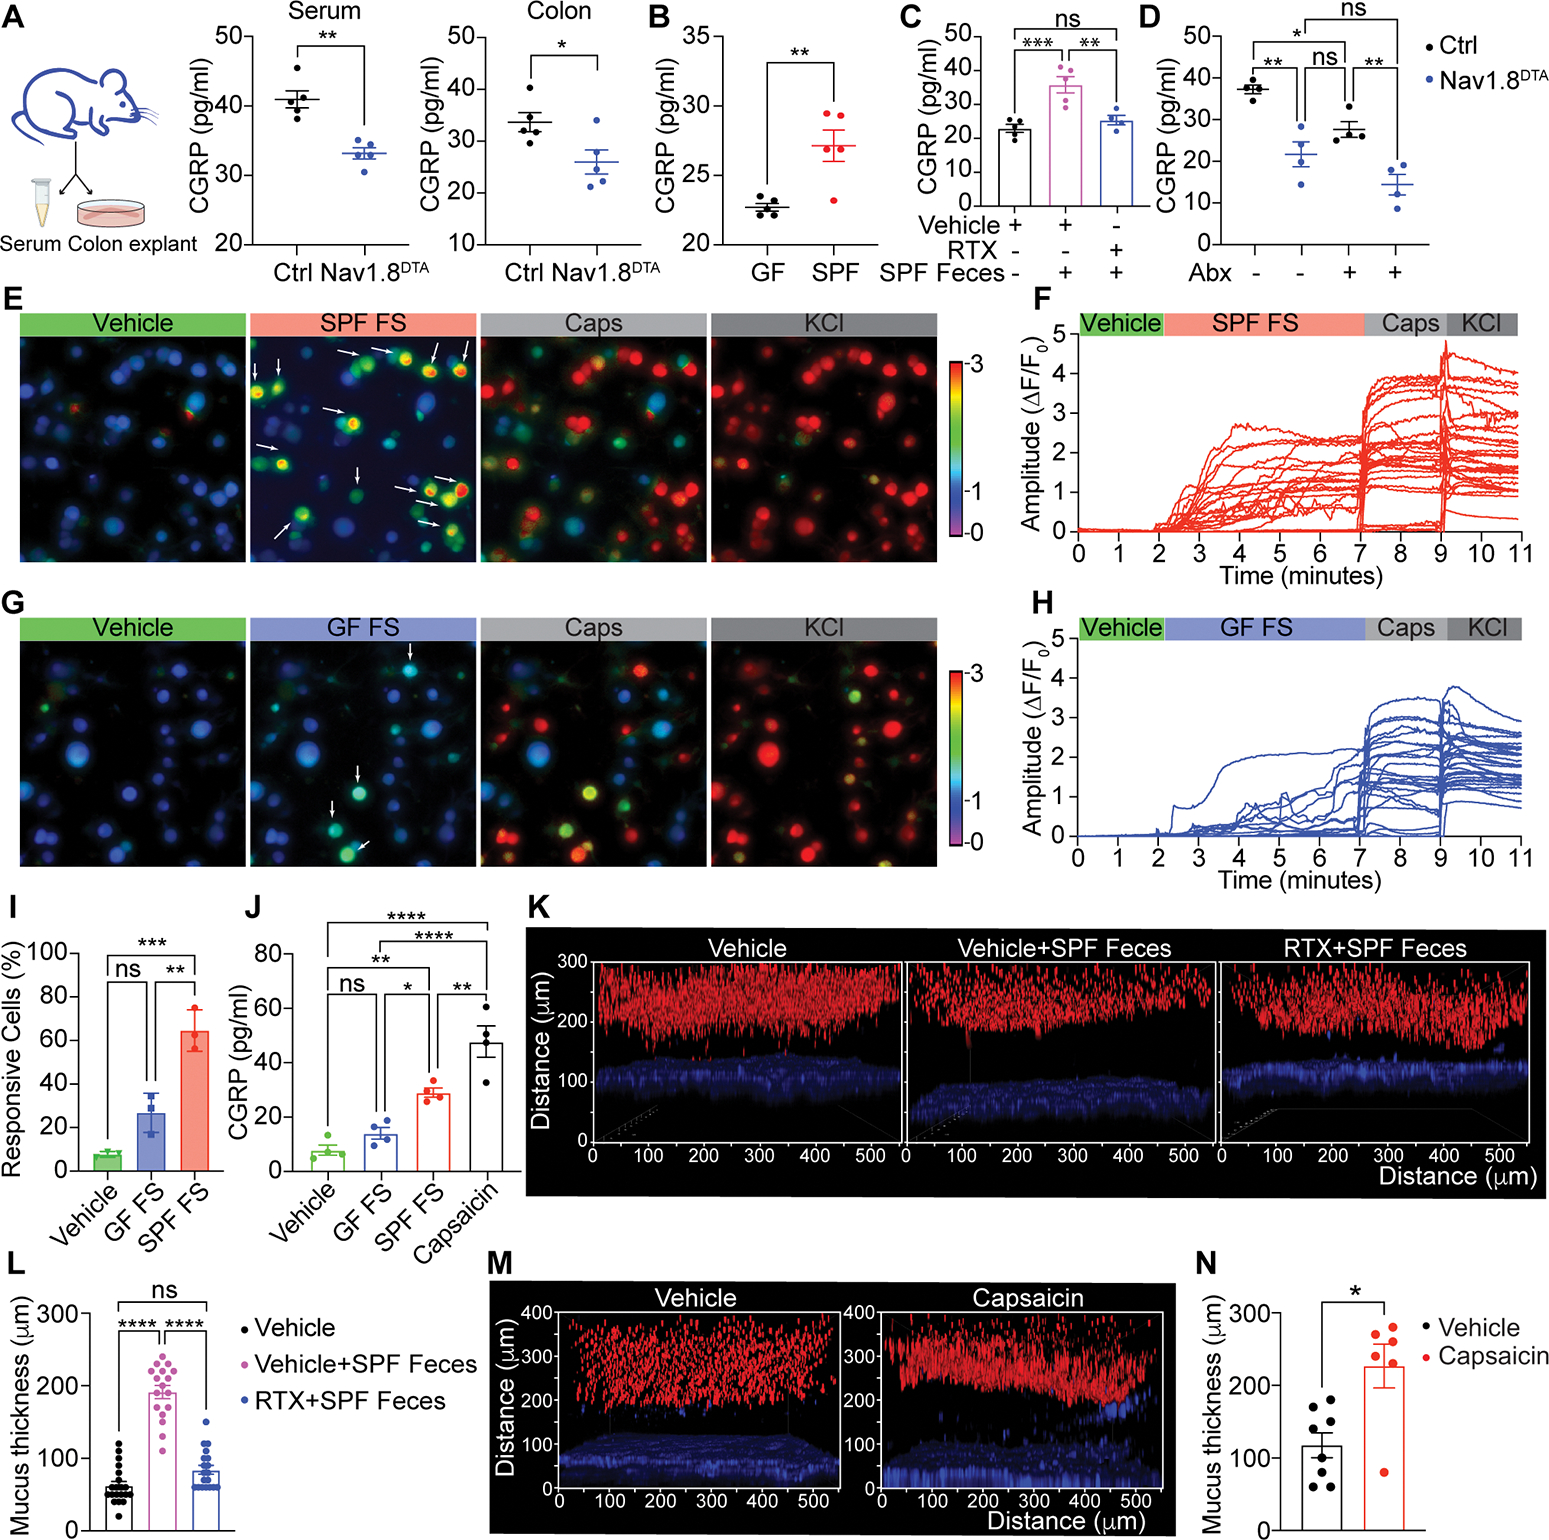
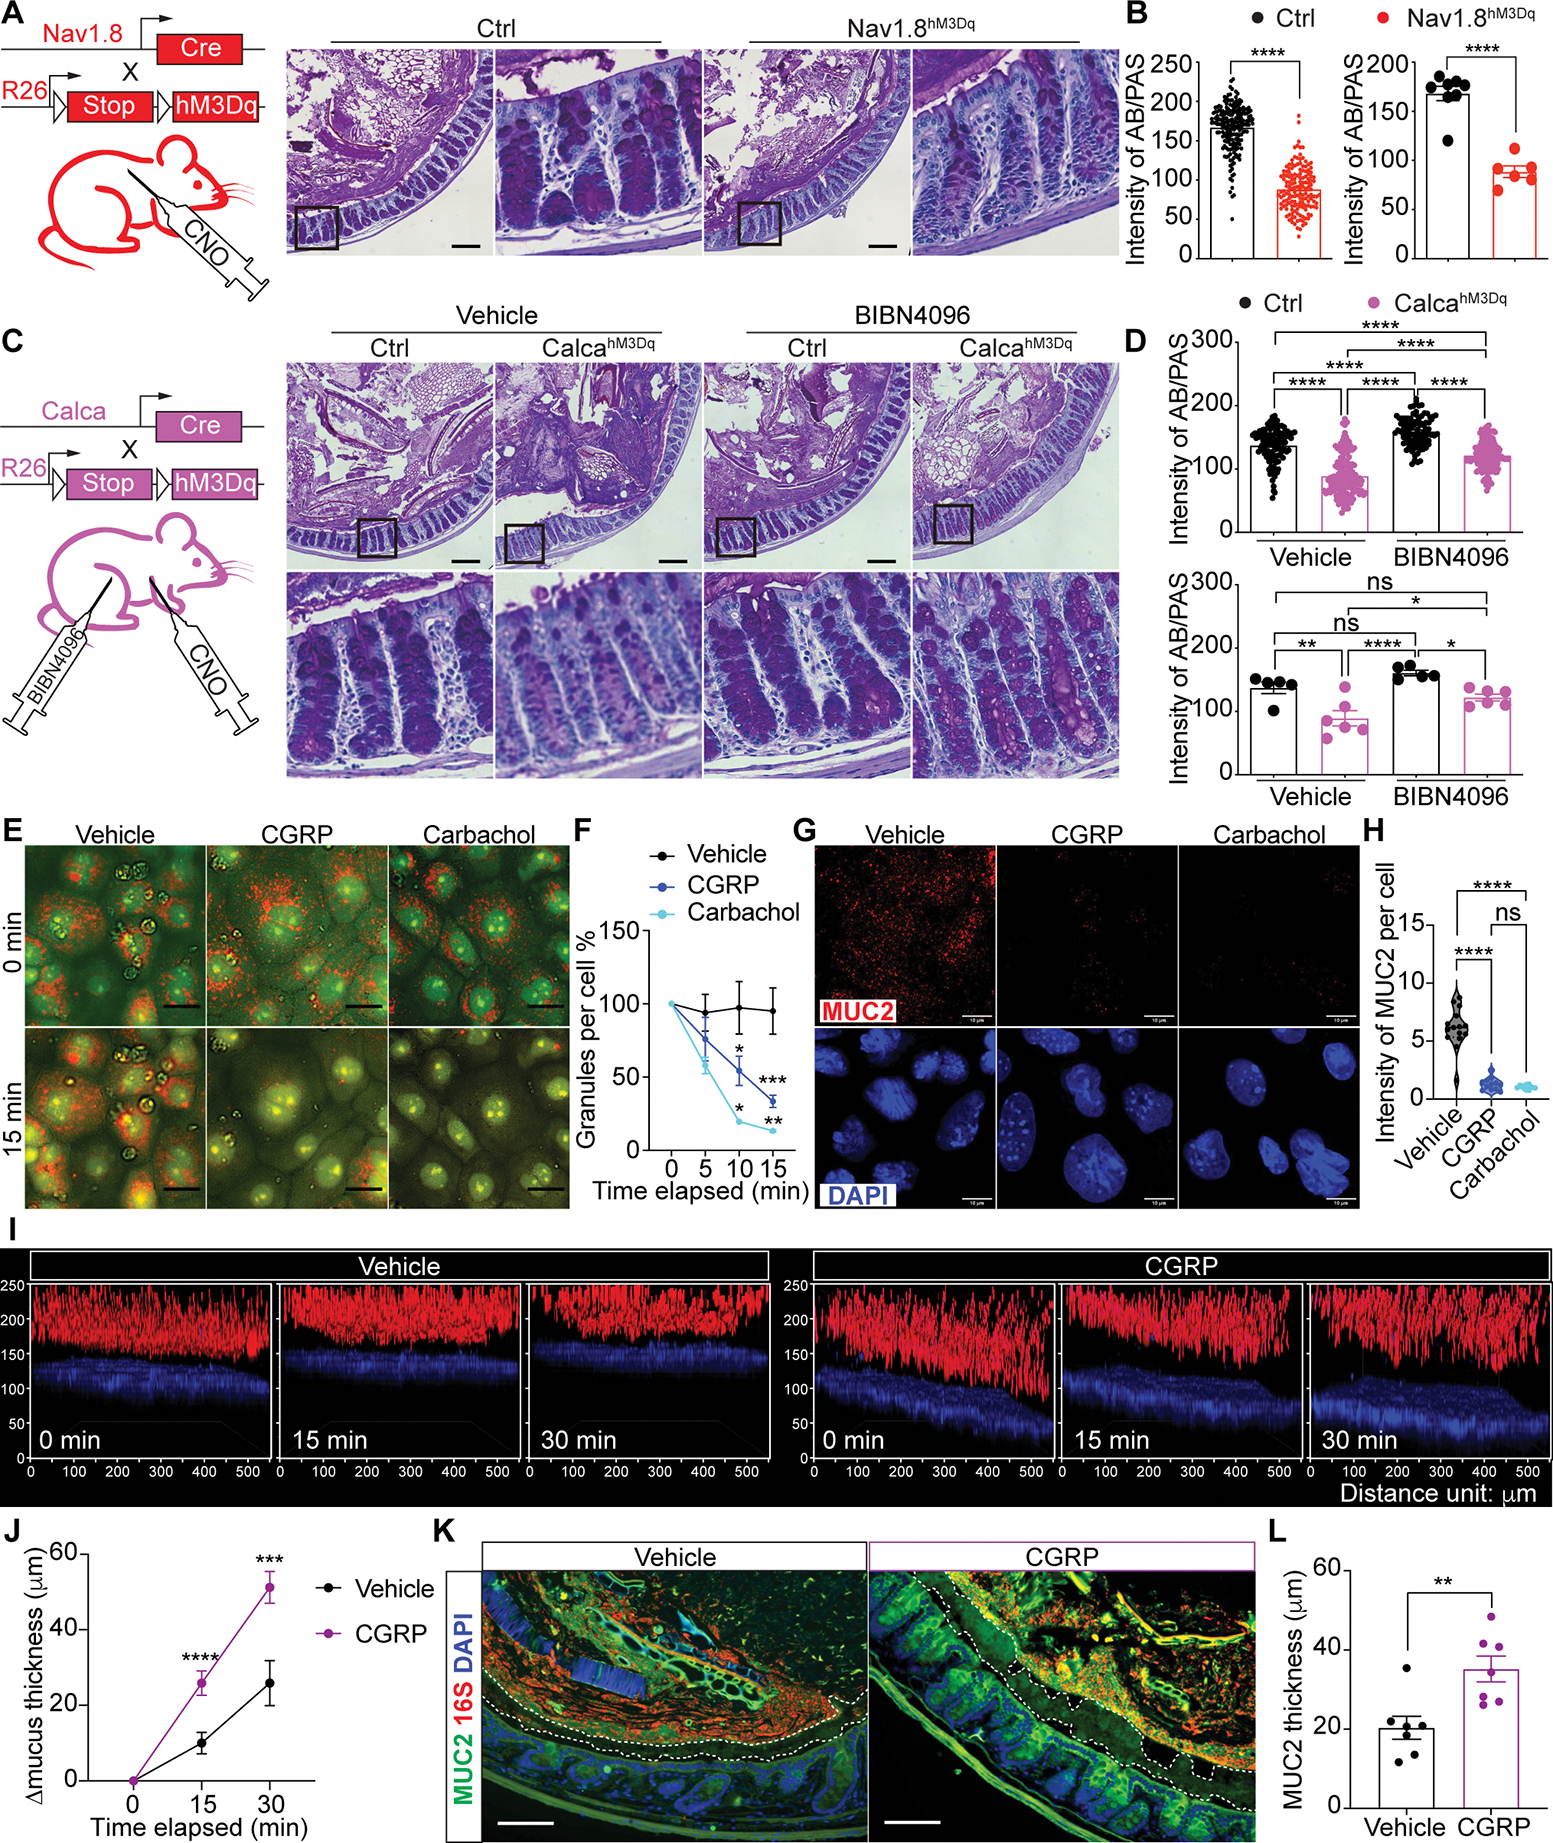
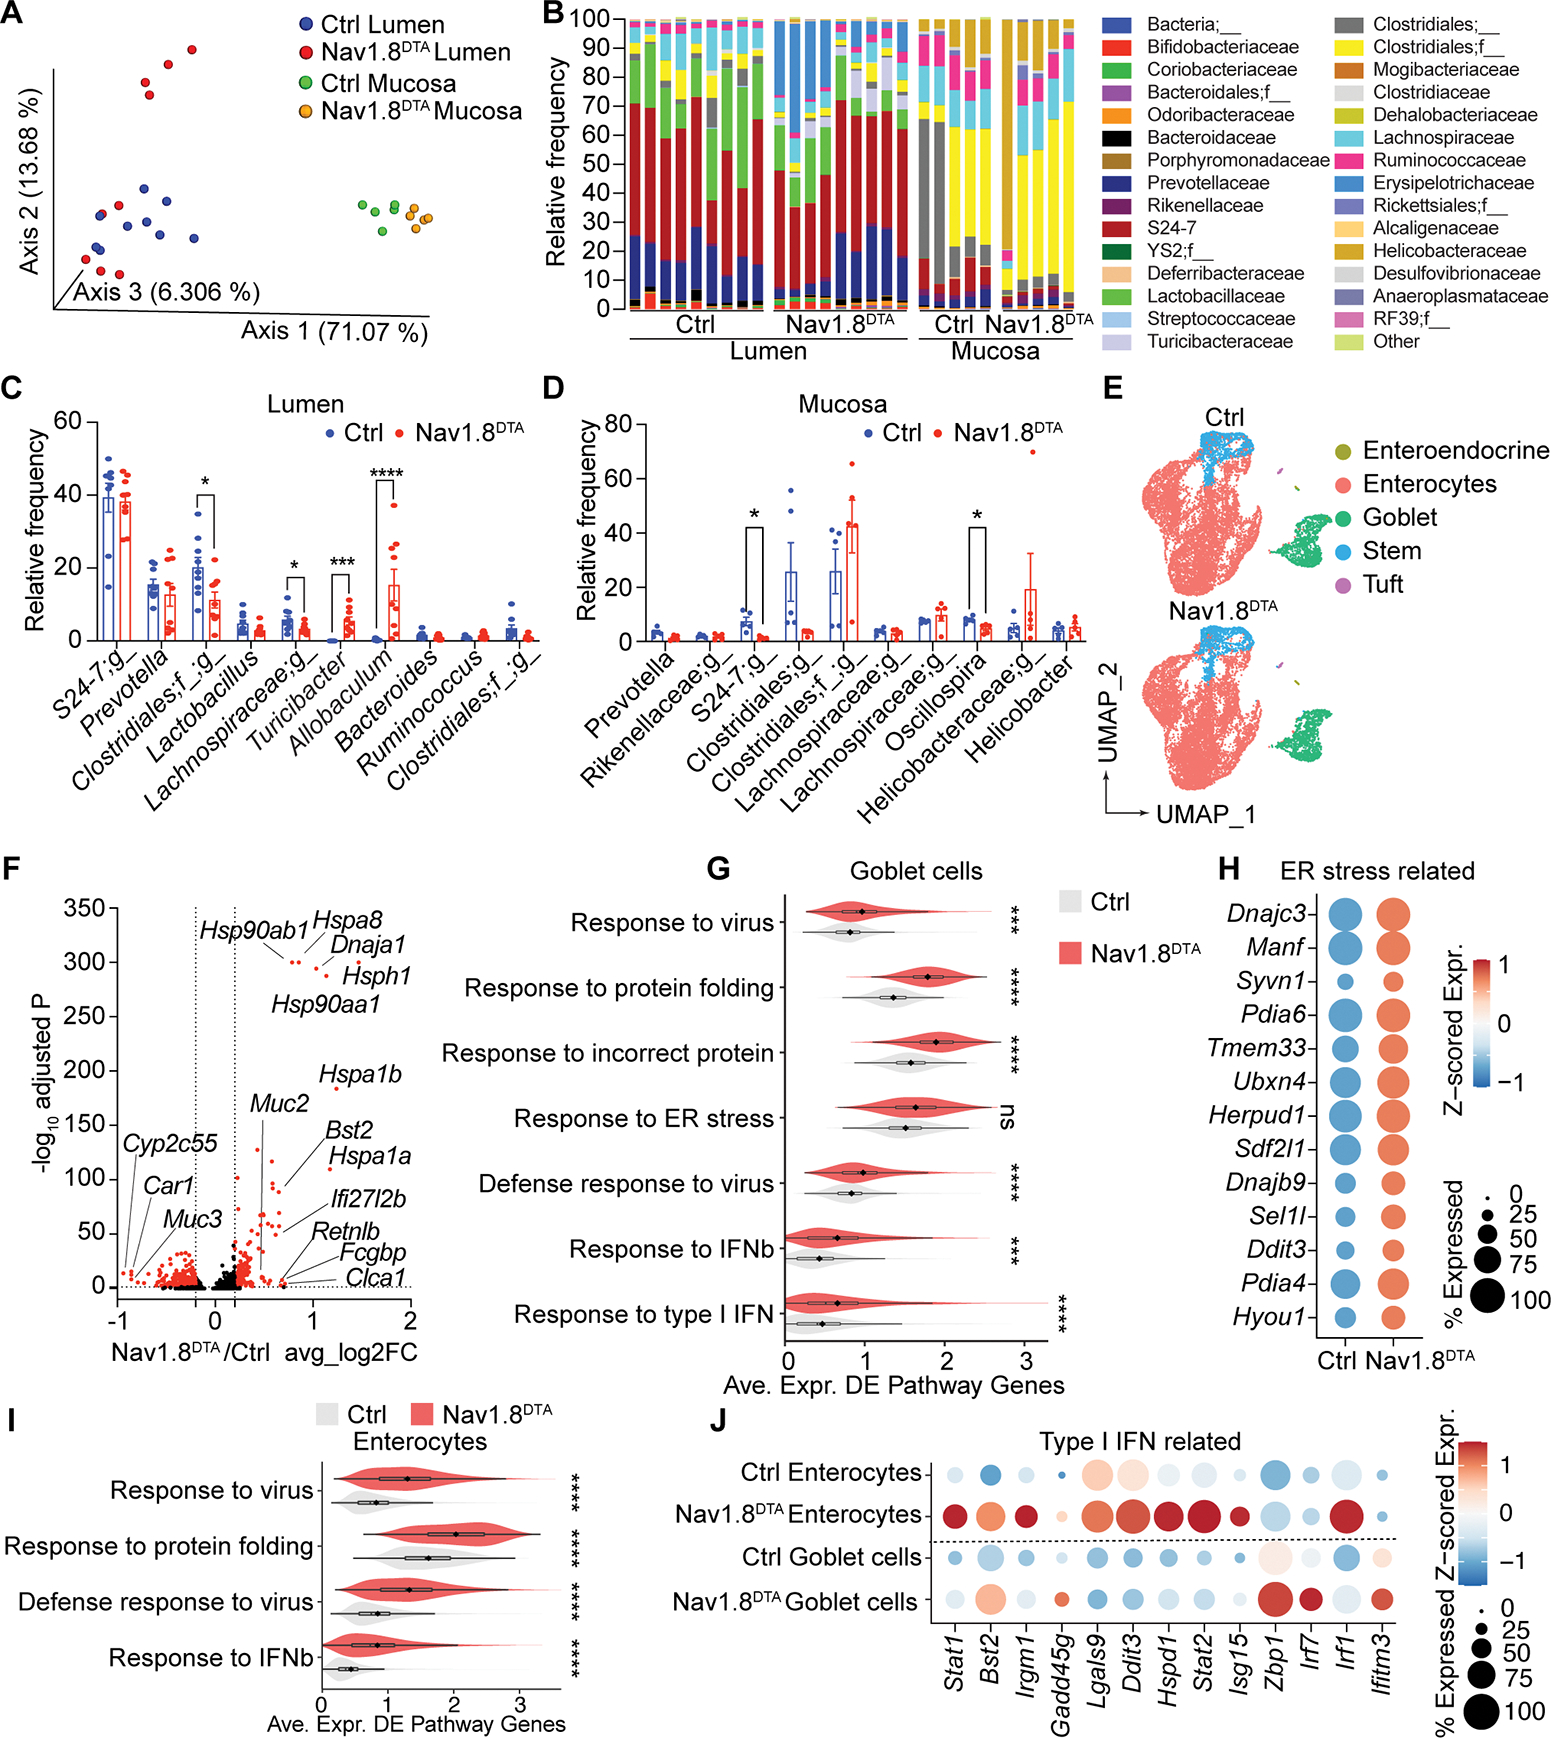
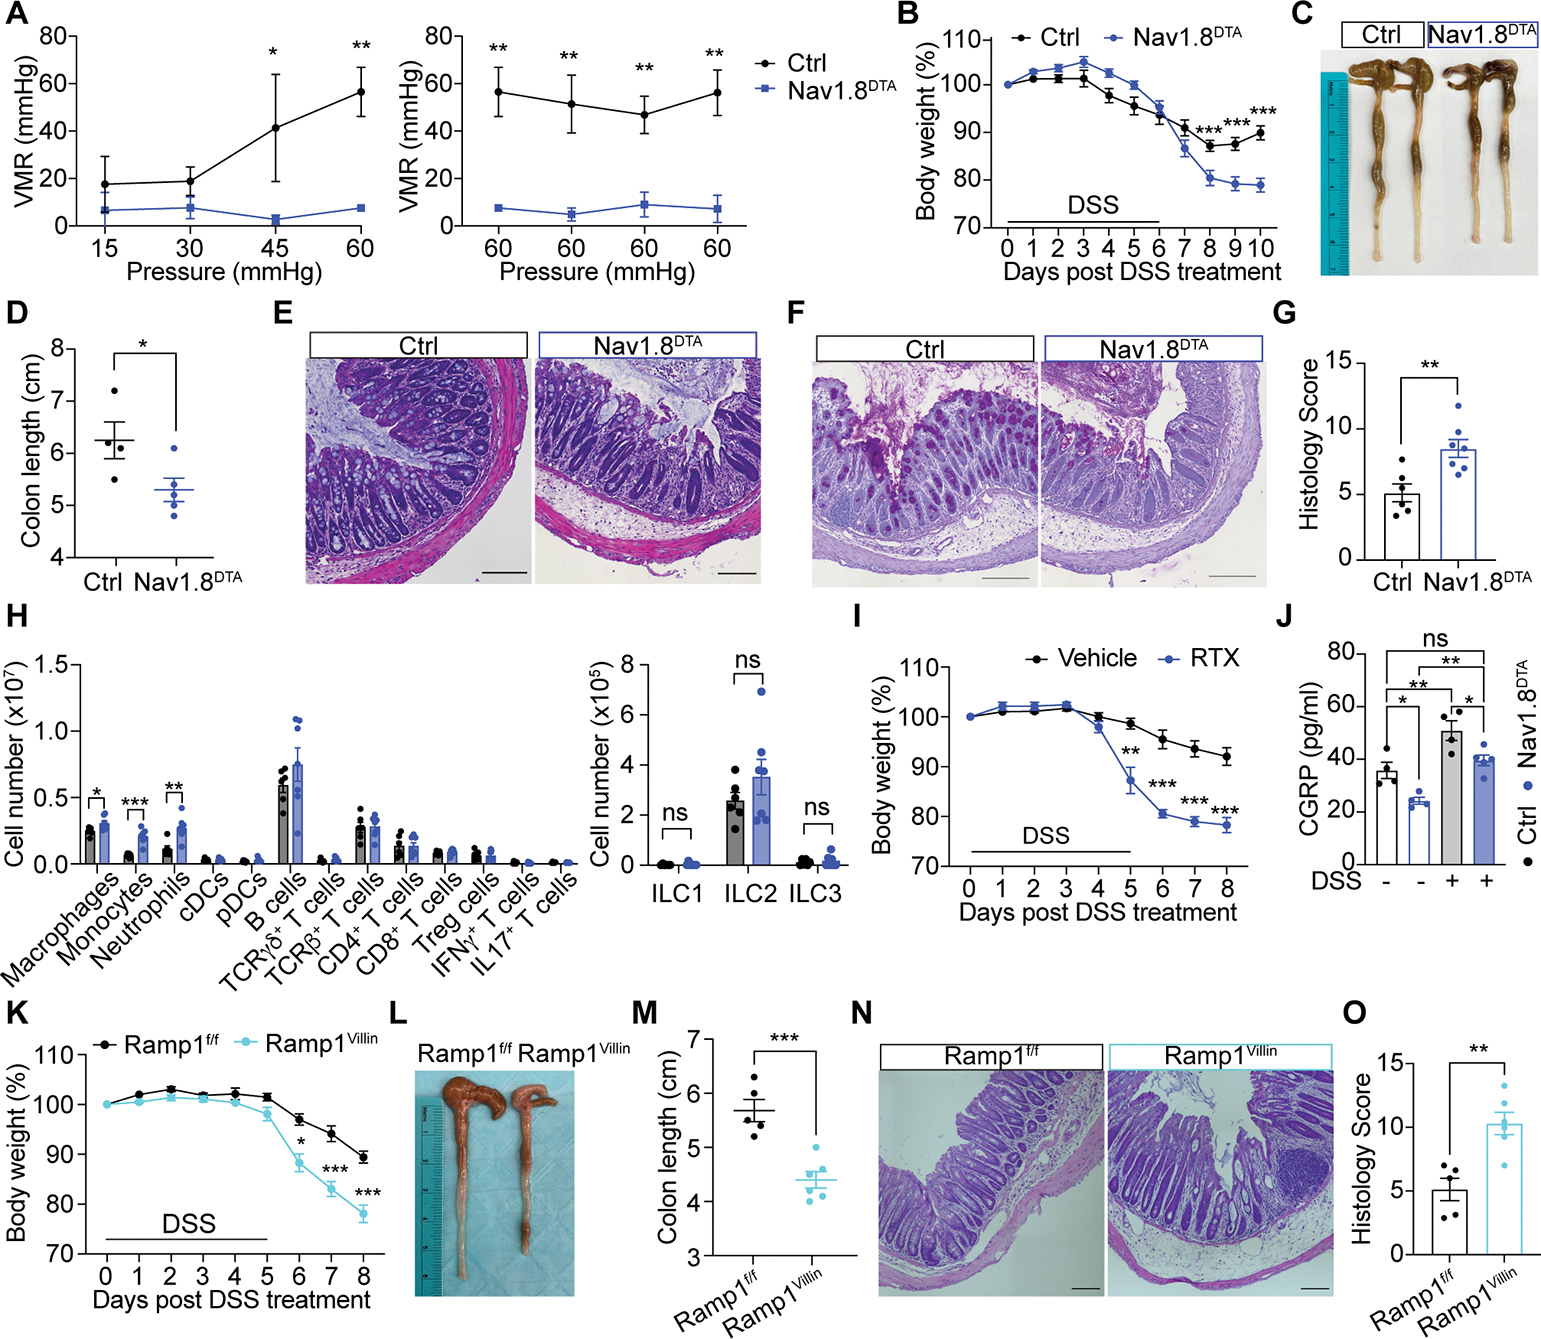
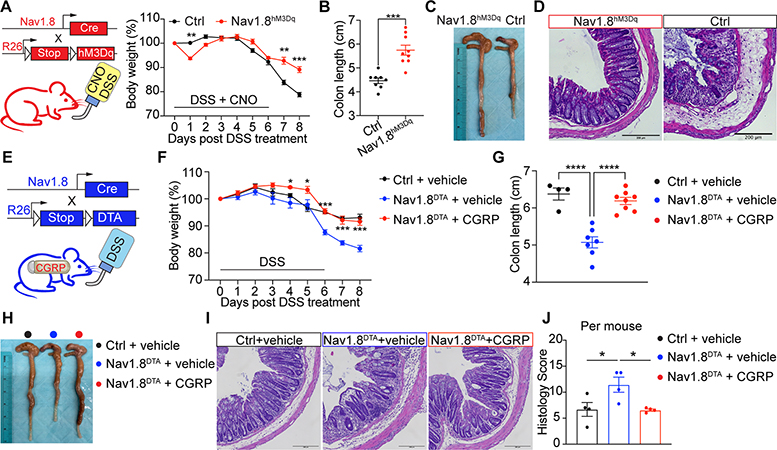
Neuroepithelial crosstalk is critical for gut physiology. However, the mechanisms by which sensory neurons communicate with epithelial cells to mediate gut barrier protection at homeostasis and during inflammation are not well understood. Here, we find that Nav1.8+CGRP+ nociceptor neurons are juxtaposed with and signal to intestinal goblet cells to drive mucus secretion and gut protection. Nociceptor ablation led to decreased mucus thickness and dysbiosis, while chemogenetic nociceptor activation or capsaicin treatment induced mucus growth. Mouse and human goblet cells expressed Ramp1, receptor for the neuropeptide CGRP. Nociceptors signal via the CGRP-Ramp1 pathway to induce rapid goblet cell emptying and mucus secretion. Notably, commensal microbes activated nociceptors to control homeostatic CGRP release. In the absence of nociceptors or epithelial Ramp1, mice showed increased epithelial stress and susceptibility to colitis. Conversely, CGRP administration protected nociceptor-ablated mice against colitis. Our findings demonstrate a neuron-goblet cell axis that orchestrates gut mucosal barrier protection.

Keywords: CGRP; Ramp1; colitis; goblet cell; gut barrier; gut-brain axis; mucus; neuroepithelial crosstalk; nociceptor; sensory neuron.


Conflict of interest statement

Declaration of interests A.J. is an employee of Genentech, Inc. I.M.C. serves on scientific advisory boards of GSK Pharmaceuticals and Limm Therapeutics. His lab receives research support from Moderna Inc. and AbbVie/Allergan Pharmaceuticals.

Figures

Figure 1.
Figure 1.. Nociceptors neighbor goblet cells and regulate colonic mucus production
(A) MUC2, 16S rDNA, DAPI staining in Nav1.8DTA and control mouse colons. (B) MUC2 thickness in Nav1.8DTA and control colons (n=12–14 mice/group). (C) Colon explants showing epithelium (blue) overlayed with 1-μm beads (red) in Nav1.8DTA and control mice. (D-E) Bead distribution (D), mucus thickness (E) in Nav1.8DTA and control colon explants (3–5 areas/mouse, 3–4 mice/group); Peak (mode) bead distance shown. (F-G) Calcium influx in KCl-responsive DRG neurons from Nav1.8hM3Dq and control mice induced by CNO (n=3 per group). (H-I) Colon explants (H), mucus thickness (I) from Nav1.8hM3Dq and control mice injected i.p. with CNO for 10 min. (n=2–3 areas/mouse; 3–5 mice/group). (J-K) Whole-mount colon tissue from Nav1.8hM3Dq mice stained for mCitrine, EpCAM, MUC2, UEA-1. EpCAM removed in right (J) and middle (K). Scale bars, 100 μm. Student’s t-test in B, E, I. Two-way ANOVA in G. Mean±SEM. *p<.05, **p<.01, ***p<.001, ****p<.0001. See also Figure S1.
Figure 2.
Figure 2.. The CGRP co-receptor Ramp1 is expressed in goblet cells and maintains mucus barrier
(A) UMAP of scRNA-seq data from colonic epithelial cells, colored by inferred cell type, from control Nav1.8-CreDTAfl/− mice. (B) Dot plot of average z-scored expression of neuropeptide and neurotransmitter receptors in colonic epithelial cell subsets from (A). (C) UMAP as in (A) showing Ramp1 expression. (D-E) In situ hybridization of Ramp1, Muc2 in mouse colon (D) and RAMP1, MUC2 in human colon (splenic flexure) (E). (F-H) MUC2,16S rDNA, DAPI staining (F), MUC2 thickness per measurement (G) and per mouse (H) of colon tissue from Calca+/+ and Calca−/− mice. (n=5–10 mice/group). (I-K) MUC2, 16S rDNA, DAPI staining (I), MUC2 thickness per measurement (J) and per mouse (K) of colon tissue from Ramp1Villin and Ramp1f/f mice. (n=8–10 mice/group). (L-M) Colonic explants (L) and mucus thickness (M) from Calca+/+ and Calca−/− mice. (n=3–5 area/mouse, 3–4 mice/group). (N-O) Colonic explants (N) and mucus thickness (O) from Ramp1Villin and Ramp1f/f mice. (n=3–5 area/mouse, 3–4 mice/group). Scale bar, 100 μm in D-F, I. Mann-Whitney test in G, J, M, O. Student’s test in H, K. Mean±SEM. *p < .05, **p < .01, ***p < .001, ****p < .0001. See also Figure S2.
Figure 3.
Figure 3.. Nociceptors are activated by commensal cues and capsaicin to secrete CGRP
(A) Serum and colon CGRP levels in Nav1.8DTA and control mice. (n=5 mice/group). (B) Colon CGRP levels in wild-type germ free (GF) and specific pathogen-free (SPF) mice. (n= 5 mice/group). (C) Colon CGRP levels in vehicle-pretreated GF mice, vehicle- and resiniferatoxin (RTX)-pretreated GF mice transplanted with SPF feces. (n= 4–5 mice/group). (D) Colon CGRP levels in Nav1.8DTA and control mice treated with or without antibiotics (n=4 mice/group). (E-I) Calcium influx in KCl-responsive wildtype DRG neurons triggered by SPF fecal supernatant (SPF FS), GF fecal supernatant (GF FS), or capsaicin. (J) CGRP levels produced by wild type mouse DRG neurons stimulated with vehicle, GF FS, SPF FS or capsaicin. (K-L) Colonic explants (K) and mucus thickness (L) from mice in (C). (n=3–5 area/mouse, 3–4 mice/group). (M-N) Colonic explants (M) and mucus thickness (N) from wildtype B6 mice orally treated with vehicle or capsaicin (10mg/kg) for 30 minutes. (n=2 area/mouse, 3–4 mice/group). Student’s test in A-B. One-way ANOVA in C-D, I-J. Mann-Whitney test in L and N. Mean±SEM. ns=not significant. *p < .05, **p < .01, ***p < .001, ****p < .0001.
Figure 4.
Figure 4.. Nociceptor activation promotes goblet cell emptying and mucus secretion through CGRP-Ramp1 axis
(A-B) AB/PAS (Alcian blue/Periodic acid-Schiff) staining (A), intensity measurement (B) per crypt (left) and per mouse (right) of colon tissue from CNO-treated Nav1.8hM3Dq and control mice. (20–30 crypts/mouse, n=6–8 mice/group). (C-D) AB/PAS staining (C), intensity measurement (D) per crypt (upper) and per mouse (lower) of colon tissue from vehicle- or BIBN4096-pretreated CalcahM3Dq and control mice after CNO injection (20–30 crypts/mouse, n=5–6 mice/group). (E-F) Acridine Orange (AO) staining (E) and normalized intensity measurement (F) of 2D organoid-derived wild type primary goblet cell cultures treated with vehicle, CGRP, carbachol for the indicated time points. (n=4–10 areas,100–200 cells/area). (G-H) MUC2 and DAPI staining (G) and intensity measurement (H) of primary wild type goblet cell cultures treated with vehicle, CGRP, or carbachol for 15 min. (n=8–15 areas, 100–200 cells/area). (I-J) Wildtype mouse colonic explants (I) and mucus thickness growth (J) with vehicle or CGRP treatment for the indicated time points. (n=3–5 areas/mouse; 4 mice/group). (K-L) MUC2, 16S rDNA and DAPI staining (K) and MUC2 thickness (L) of colon tissue from wildtype B6 mice 10 minutes after CGRP i.p. injection. (n=7 mice/group). Scale bar, 100 μm in A, C, K. Scale bar, 10 μm in E, G. Mann-Whitney test in left B, top D. Student’s t-test in right B, L. Two-way ANOVA in bottom D. One-way ANOVA in H. Multiple t-test in F, J. Mean±SEM. ns=not significant. *p < .05, **p < .01, ***p < .001, ****p < .0001. See also Figure S3.
Figure 5.
Figure 5.. Nociceptor deficiency results in intestinal dysbiosis and epithelial stress
(A-D) Microbiome analysis: Principal coordinates analysis (PCoA) of weighted UniFrac distance measurements (A), and family-level (B) and genus-level (C-D) analysis of the microbiome in colonic lumen contents (Lumen) and mucosal scrapings (Mucosa) of Nav1.8DTA and control mice (n=5–9 mice/group). (E) UMAP of scRNA-seq profiles of colonic epithelial cells from control (top) and Nav1.8DTA (bottom) mice. (F) Volcano plot highlights 782 differentially expressed genes (DEGs; in red; |log2 fold change| >0.2, adj. P <0.05) in Nav1.8DTA versus control colonic goblet cells. (G) Violin plots show distributions across colonic goblet cells in Nav1.8DTA and control mice. of the average expression of the DEGs, as in (F), that intersect with each of the indicated enriched pathways. (H) Dot plot of average z-scored expression of ER stress-related genes in colonic goblet cells from Nav1.8DTA and control mice. (I) Violin plot, analogous to G, for DEGs in enterocytes from Nav1.8DTA and control mice. (J) Dot plot of average z-scored expression of Type I IFN-related genes in enterocytes and goblet cells from Nav1.8DTA and control mice. Multiple t-tests in C. Mann-Whitney test in G and I. ns=not significant. *p < .05, **p < .01, ***p < .001, ****p <.0001. See also Figure S4–5.
Figure 6.
Figure 6.. Nociceptors and epithelial Ramp1 are necessary for host protection against intestinal colitis
(A) Visceromotor responses (VMR) of Nav1.8DTA and control mice 8 days post DSS treatment (n=3 mice/group). (B) Body weight of Nav1.8DTA and control mice after DSS treatment (n=9–10 mice/group). (C-G) Representative colon image (C), colon length (D), H&E staining (E), AB/PAS staining (F), histology scoring per mouse (G) of mice in (B) on day 10 post DSS treatment. (4 areas/mouse, n=4–7 mice/group). (H) Immune profiling of colonic lamina propria from mice in (B) on day 10 post DSS treatment (n=6–7 mice/group). (I) Body weight of RTX- and vehicle-pretreated mice post DSS treatment (n=4 mice/group). (J) Colon CGRP levels from Nav1.8DTA and control mice treated with or without DSS for 5 days (n=4 mice/group). (K-O) Body weight (K), colon image (L), colon length (M), H&E staining (N), histology scores per mouse (O) of Ramp1Villin and Ramp1f/f mice 8 days post DSS treatment. (4 areas/mouse, n=5–6 mice/group). Scale bar, 100 μm in E-F, N. Multiple t-test in A-B, H, I, K. Student’s test in D, G, M, O. One-way ANOVA in J. Mean±SEM. ns=not significant. *p < .05, **p < .01, ***p < .001. See also Figure S7.
Figure 7.
Figure 7.. CGRP administration ameliorates intestinal colitis pathology
(A-D) Body weight (A), colon length (B), colon image (C), H&E staining (D) of Nav1.8hM3Dq and control mice 8 days post DSS plus CNO (0.5μg/ml) treatment. (n=8–9 mice/group). (E) Nav1.8DTA mice were s.c. implanted with osmotic pumps carrying either vehicle or CGRP. Control mice were s.c. implanted with osmotic pumps carrying vehicle. All mice were subjected to DSS treatment and sacrificed on day 8. (F-J) Body weight (F), colon length (G), colon image (H), H&E staining (I), histology scores per mouse (J) of mice in (E) (4 areas/mouse, n=4 mice/group). Scale bar, 200 μm in D, I. Multiple t-test in A, F. Student’s t-test in B. One-way ANOVA in G and J. Mean±SEM. ns=not significant. *p < .05, **p < .01, ***p < .001, ****p < .0001. See also Figure S7.

Comment in

References

    1. Abrahamsen B, Zhao J, Asante CO, Cendan CM, Marsh S, Martinez-Barbera JP, Nassar MA, Dickenson AH, and Wood JN (2008). The cell and molecular basis of mechanical, cold, and inflammatory pain. Science 321, 702–705. - PubMed
    1. Baral P, Udit S, and Chiu IM (2019). Pain and immunity: implications for host defence. Nat Rev Immunol 19, 433–447. - PMC - PubMed
    1. Baral P, Umans BD, Li L, Wallrapp A, Bist M, Kirschbaum T, Wei Y, Zhou Y, Kuchroo VK, Burkett PR, et al. (2018). Nociceptor sensory neurons suppress neutrophil and gammadelta T cell responses in bacterial lung infections and lethal pneumonia. Nat Med 24, 417–426. - PMC - PubMed
    1. Bellono NW, Bayrer JR, Leitch DB, Castro J, Zhang C, O’Donnell TA, Brierley SM, Ingraham HA, and Julius D (2017). Enterochromaffin Cells Are Gut Chemosensors that Couple to Sensory Neural Pathways. Cell 170, 185–198 e116. - PMC - PubMed
    1. Bergstrom KS, Kissoon-Singh V, Gibson DL, Ma C, Montero M, Sham HP, Ryz N, Huang T, Velcich A, Finlay BB, et al. (2010). Muc2 protects against lethal infectious colitis by disassociating pathogenic and commensal bacteria from the colonic mucosa. PLoS Pathog 6, e1000902. - PMC - PubMed

Publication types

Substances