. 2022 Dec 6;34(12):1932-1946.e7.
doi: 10.1016/j.cmet.2022.09.019. Epub 2022 Oct 14.

The rheumatoid arthritis drug auranofin lowers leptin levels and exerts antidiabetic effects in obese mice

Affiliations

The rheumatoid arthritis drug auranofin lowers leptin levels and exerts antidiabetic effects in obese mice

Aaron R Cox et al. Cell Metab. .

Abstract

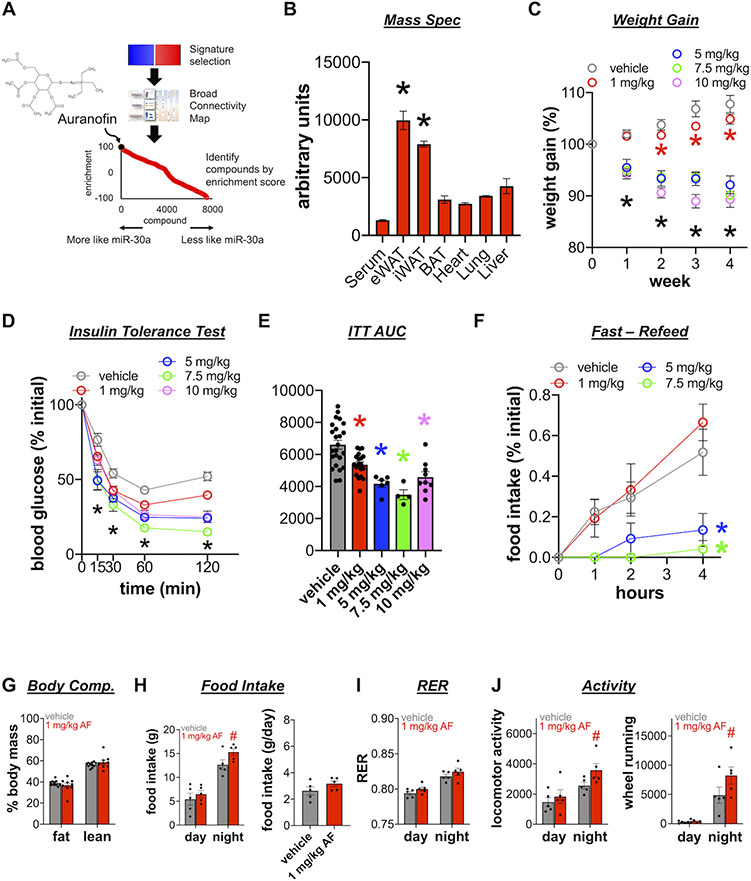
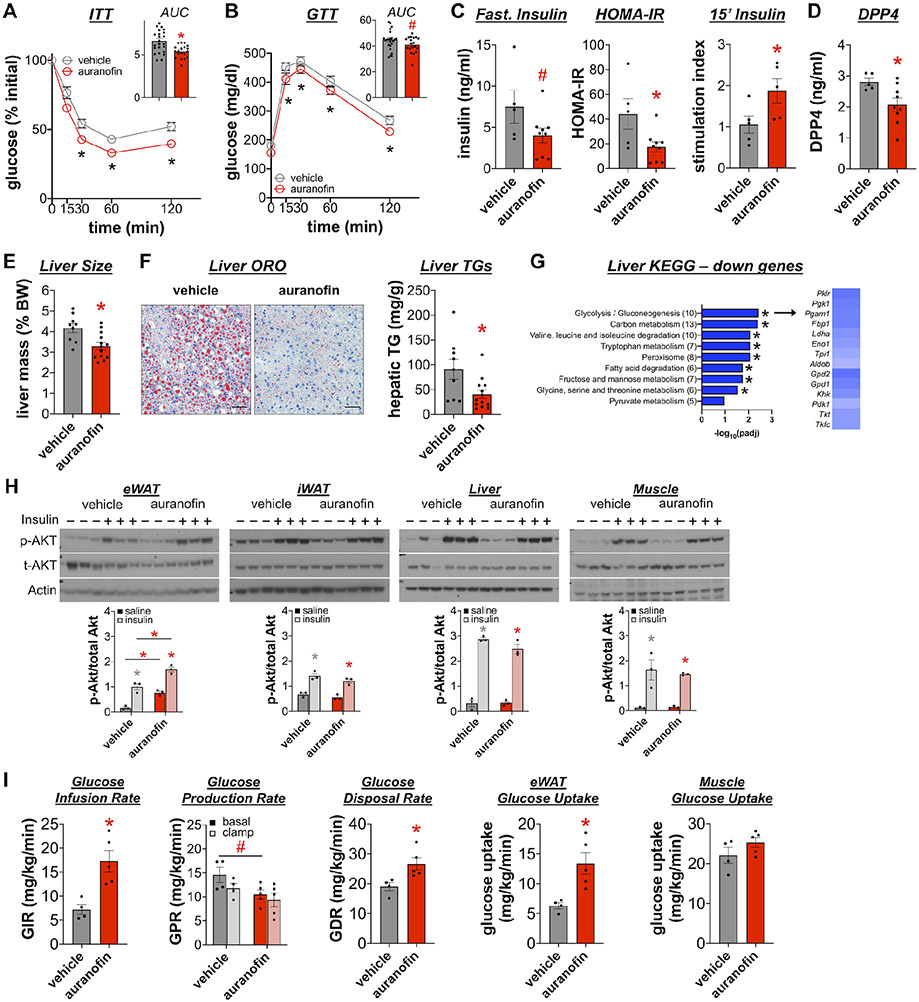
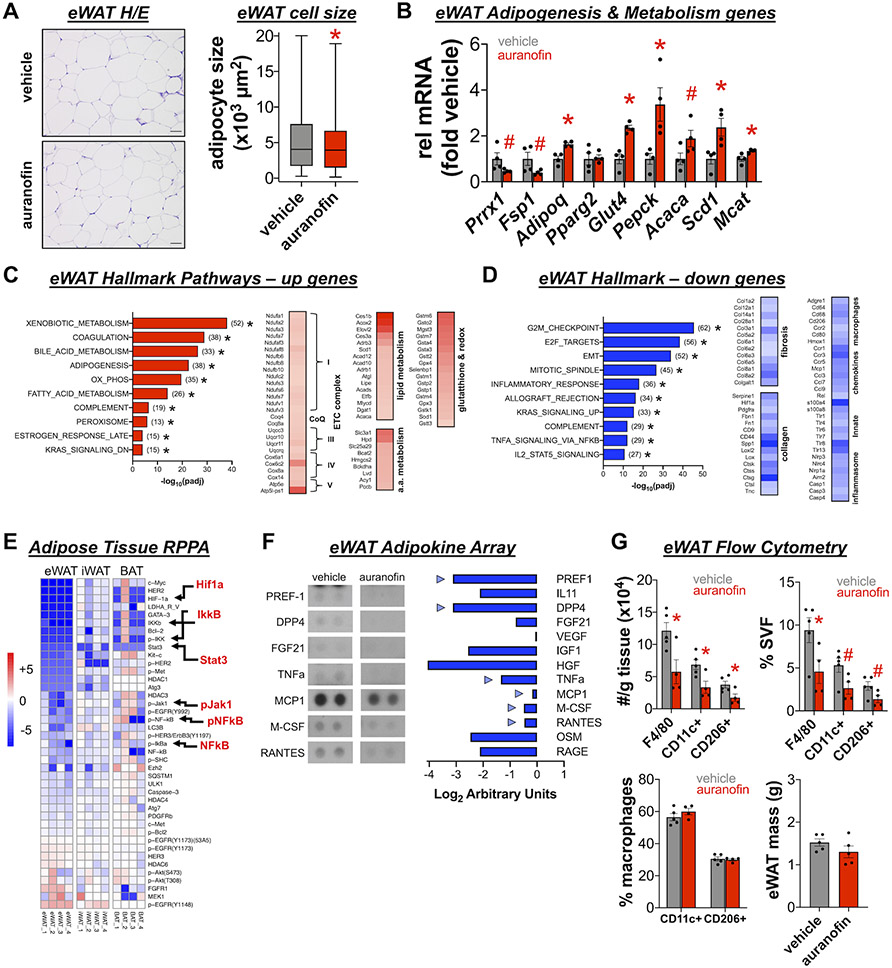
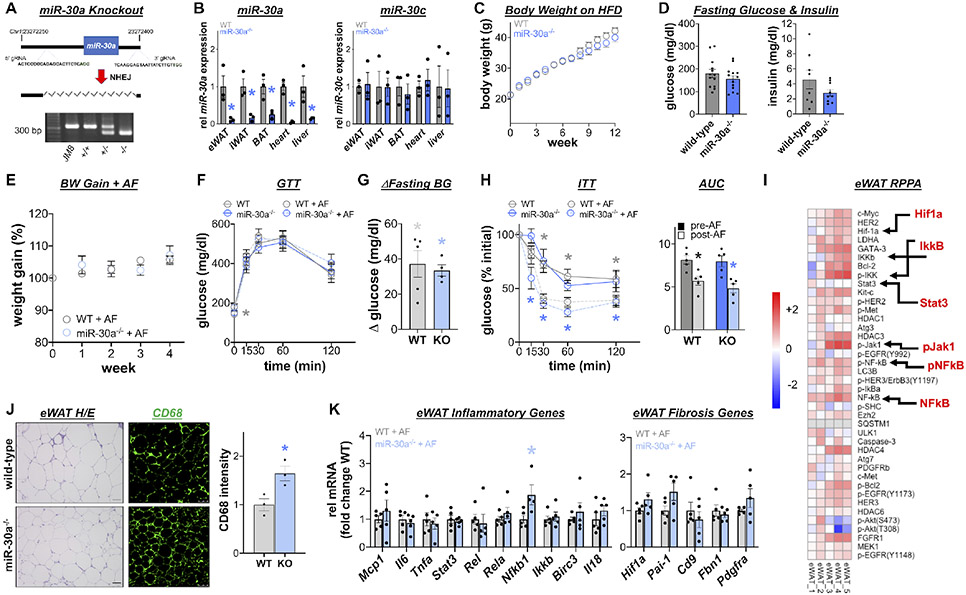
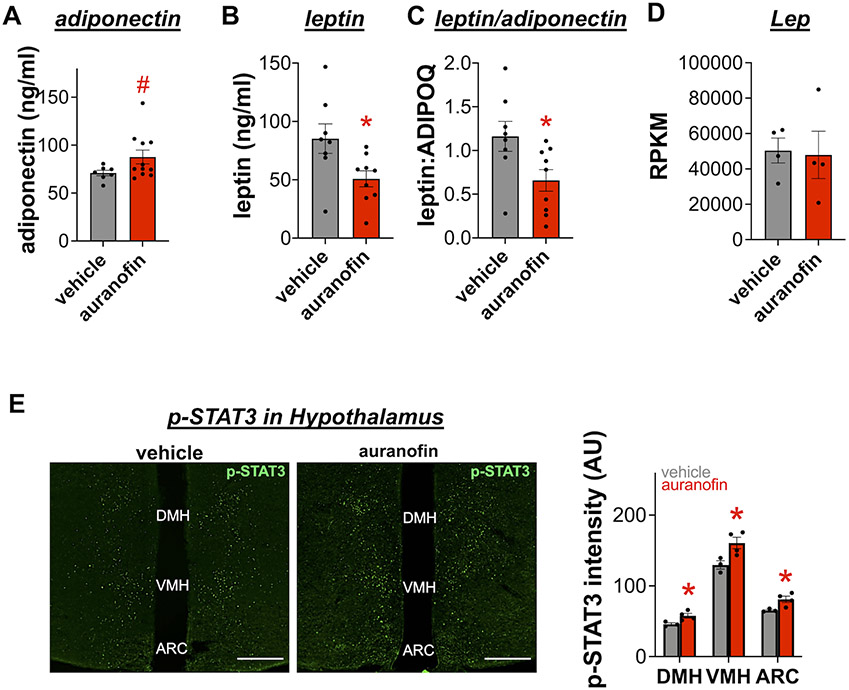
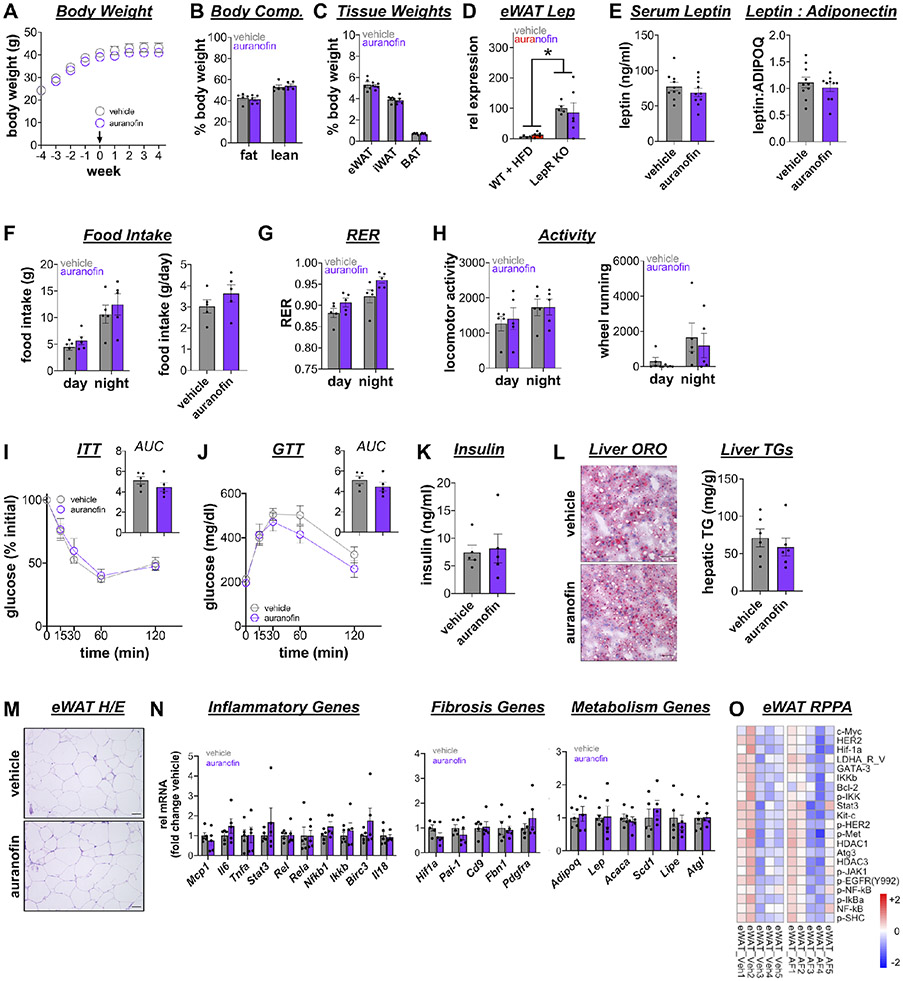
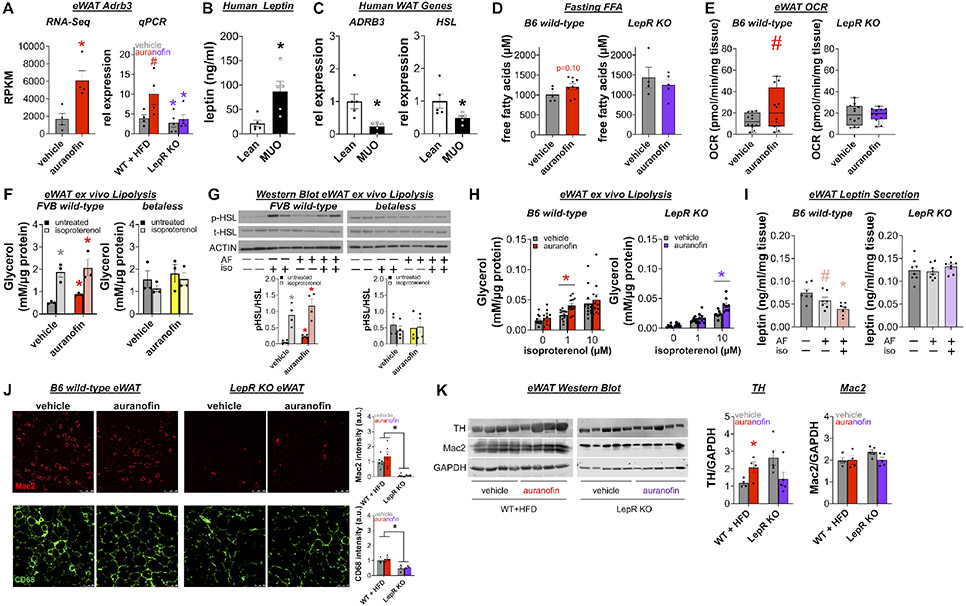
Low-grade, sustained inflammation in white adipose tissue (WAT) characterizes obesity and coincides with type 2 diabetes mellitus (T2DM). However, pharmacological targeting of inflammation lacks durable therapeutic effects in insulin-resistant conditions. Through a computational screen, we discovered that the FDA-approved rheumatoid arthritis drug auranofin improved insulin sensitivity and normalized obesity-associated abnormalities, including hepatic steatosis and hyperinsulinemia in mouse models of T2DM. We also discovered that auranofin accumulation in WAT depleted inflammatory responses to a high-fat diet without altering body composition in obese wild-type mice. Surprisingly, elevated leptin levels and blunted beta-adrenergic receptor activity achieved by leptin receptor deletion abolished the antidiabetic effects of auranofin. These experiments also revealed that the metabolic benefits of leptin reduction were superior to immune impacts of auranofin in WAT. Our studies uncover important metabolic properties of anti-inflammatory treatments and contribute to the notion that leptin reduction in the periphery can be accomplished to treat obesity and T2DM.

Keywords: auranofin; inflammation; insulin sensitivity; leptin reduction; obesity.


Conflict of interest statement

Declaration of interests The authors declare no competing interests.

Figures

Figure 1.
Figure 1.. The RA drug auranofin and miR-30a exhibit similar activities.
(A) The Broad Connectivity Map identified auranofin regulates gene expression in a similar way as miR-30a expression in iWAT. (B) Diet-induced obese mice injected with auranofin i.p. (10 mg/kg) and sacrificed 24 h later for mass spectrometry analysis of tissue distribution. Wild-type mice fed high-fat diet (HFD) for 12 weeks i.p. injected with auranofin (1, 5, 7.5, 10 mg/kg) or vehicle for 4 weeks. (C) Weight gain for vehicle n=24, 1 mg/kg n=29, 5 mg/kg n=6, 7.5 mg/kg n=4, 10 mg/kg n=10. (D) ITT with corresponding (E) area under the curve measurements. (F) Food intake measured in mice fasted 16 h and re-fed after auranofin injection (n=4-5/group). (G) Body composition (n=9-14/group). Mice were individually housed and monitored in CLAMS cages for 7 days (1 mg/kg, n=5/group). Averaged data during dark/light periods for (H) food intake, (I) RER, and (J) activity. All data are mean ± SEM. *p<0.05, #p<0.10 by one-way ANOVA with Tukey’s multiple comparison test (B; E), mixed-effects analysis with Tukey’s multiple comparisons test (C, black asterisks are week 1 vehicle vs 5, 7.5, 10 mg/kg and red asterisks are weeks 2-4 vehicle vs 1 mg/kg; D, ITT% vs vehicle; F, hours 2-4 vehicle or 1 mg/kg vs 5 and 10 mg/kg), two-way ANOVA with Tukey’s multiple comparisons test (G; day/night food intake, H), and ANCOVA with lean mass as a covariate (I; J)
Figure 2.
Figure 2.. Auranofin improves insulin sensitivity in obese mice.
Mice fed high fat diet (HFD) for 12 weeks were i.p. injected with auranofin (1 mg/kg) or vehicle for 4 weeks. (A) ITT and (B) GTT with corresponding area under the curve measurements (n=19-24/group). (C) Fasting serum insulin, HOMA-IR, and glucose-stimulated insulin secretion (n=5-9/group). (D) Fed serum DPP4 (n=5-9/group). (E) Liver size (n=9-13/group), (F) Oil Red O (ORO) staining of liver sections and liver triglycerides (n=9-13/group), scale=100 μm. (G) KEGG pathway analysis of down-regulated genes by RNA-seq in the liver with auranofin shown as −log10(adj. p-value). Heatmap (right) shows log2 fold change for genes enriched in glycolysis/gluconeogenesis and fatty acid metabolism. (H) Immunoblots of tissue lysates from mice injected with insulin five minutes, probed for p-Akt (Ser473) and total Akt followed by densitometry. Hyperinsulinemic-euglycemic clamp (n=4-5/group): (I) Glucose infusion rate (GIR), glucose production rate (GPR) during basal (dark bars) and clamp (light bars), glucose disposal rate (GDR), and glucose uptake in eWAT and gastrocnemius muscle (muscle). All data are mean ± SEM. *p<0.05, #p<0.10 by two-way ANOVA with Tukey’s multiple comparison test (A; B; H; I, GPR) and unpaired t-test (A and B, AUC; C-F; I, GDR and glucose uptake).
Figure 3.
Figure 3.. Auranofin expands eWAT in obese wild-type mice.
Mice fed high fat diet (HFD) for 12 weeks were i.p. injected with auranofin (1 mg/kg) or vehicle for 4 weeks. (A) eWAT H&E and mean adipocyte size (μm2) across four fields of view (n=3/group), scale=50 μm. (B) Expression of adipogenesis and metabolism genes in eWAT. Hallmark pathway analysis of (C) upregulated and (D) down-regulated genes by RNA-seq in the eWAT shown as −log10(adj. p-value). Heatmaps show log2 fold change for (C) up genes enriched in mitochondrial complexes, lipid and amino acid metabolism, glutathione catabolism and (D) down genes enriched in collagen, fibrosis, and inflammation. (E) Reverse phase protein array (RPPA) analysis on WAT and BAT shown as log2 fold change auranofin/vehicle. (F) eWAT protein lysates (pooled n=4/group) incubated with adipokine arrays and quantified for relative abundance as log2 fold change auranofin/vehicle. (G) eWAT total (F4/80+), M1-like (CD11c+), and M2-like (CD206+) macrophages quantified by flow cytometry (n=4-5 mice/group) with eWAT mass. All data are mean ± SEM. *p<0.05, #p<0.10 by Mann-Whitney test (A), unpaired t-test (B; E, eWAT probes; G, eWAT mass), and two-way ANOVA with Tukey’s multiple comparisons test (G)
Figure 4.
Figure 4.. The metabolic effects of auranofin occur independently of miR-30a.
(A) Guide RNAs (gRNA) flanked a 1 kb genomic region containing miR-30a. Non-homologous end-joining (NHEJ) generated miR-30a−/− (KO). PCR genotyping of the targeted loci in genomic DNA from wild-type (+/+), miR-30a+/−, miR-30a−/− mice or ES cells (JM8). (B) qPCR of miR-30a and miR-30c (six month old miR-30a−/− and littermate controls, n=3/group). (C) Body weight during high fat diet (HFD) for 12 weeks (n=21-22 mice/group). (D) Fasting glucose (n=13/group) and insulin levels (n=8-9/group). HFD-fed wild-type and miR-30a−/− were i.p. injected with auranofin (AF, 1 mg/kg) for 4 weeks. (E) Body weight gain of HFD wild-type and miR-30a−/− mice during auranofin treatment. (F) GTT and (G) changes (Δ) in fasting glucose after auranofin (n=4-5/group). (H) ITT and corresponding area under the curve measurements (n=5/group). Asterisks (gray-WT, blue-KO) indicate pre- and post- auranofin changes for each genotype. (I) Reverse phase protein array (RPPA) on eWAT of untreated obese wild-type and miR-30a−/− mice shown as log2 fold change KO/wild-type. (J) H&E stained eWAT (scale=50 μm) and immunofluorescent labeling of CD68 with quantification (five images/mouse; n=3/group; scale=100 μm). (K) Expression of inflammatory and fibrosis genes in eWAT after auranofin treatment. All data are mean ± SEM. *p<0.05 by upaired t-test (B; D; G, vs ΔBG=0 ; I-K) and two-way ANOVA with Tukey’s multiple comparisons test (C; E; F; pre- and post-AF, H)
Figure 5.
Figure 5.. Auranofin lowers serum leptin levels in obese wild-type mice.
(A) Fed serum adiponectin, (B) leptin and (C) corresponding leptin to adiponectin ratio for WT+HFD (n=8-12/group). (D) eWAT Lep in wild-type mice treated with vehicle or auranofin on HFD (n=4/group). RNA-Seq data shown as reads per kb million (RPKM). (E) The hypothalamus was stained and quantified for p-STAT3 (n=4/group) within the dorsal medial hypothalamus (DMH), ventral medial hypothalamus (VMH) and arcuate (ARC) nuclei of HFD mice treated with auranofin (1 mg/kg), scale=200 μm. All data are mean ± SEM. *p<0.05 by unpaired t-test (A-D) and two-way ANOVA with Tukey’s multiple comparisons test (E)
Figure 6.
Figure 6.. Genetic hyperleptinemia causes auranofin resistance.
Tamoxifen treatment induced LepR deletion and obesity in Ubc-Cre;LepRlp/lp (LepR KO) mice. After four weeks, LepR KO mice were i.p. injected with auranofin (1 mg/kg) or vehicle for 4 weeks (n=5/group). (A) Body mass during treatments. (B) Body composition and (C) tissue weights at necropsy (n=5/group). (D) eWAT Lep in wild-type mice treated with auranofin on high fat diet (WT+HFD; n=4/group) and LepR KO (n=5/group). (E) Fed serum leptin and corresponding leptin to adiponectin ratio (n=10/group). Mice were individually housed in CLAMS cages for 6 days (n=5/group). Averaged data during dark/light periods for (F) food intake, (G) RER, (H) locomotor activity and wheel running. (I) ITT and (J) GTT with corresponding area under the curve measurements. (K) Fasting serum insulin (n=5/group). (L) Oil Red O (ORO) staining of liver sections (scale=100 μm) and liver triglycerides (TGs) (n=6/group). (M) eWAT H&E; scale=50 μm. (N) Expression of inflammatory, fibrosis and metabolism genes in eWAT (n=5/group). (O) Reverse phase protein array on eWAT of LepR KO mice shown as log2 fold change auranofin/vehicle. All data are mean ± SEM. *p<0.05, #p<0.1 by two-way ANOVA with Tukey’s multiple comparison test (A; B; D; G, day/night food intake; I; J), ANCOVA with lean mass as a co-variate (G; H), and unpaired t-test (C; E; F, cumulative food intake; I and J, AUC; L; N; O)
Figure 7.
Figure 7.. Auranofin restores eWAT lipolytic competence.
(A) eWAT Adrb3 in wild-type mice fed high fat diet (WT+HFD, n=4/group) and LepR KO mice (n=5/group) treated with auranofin (1 mg/kg) or vehicle. RNA-Seq data shown as reads per kb million (RPKM). (B) Serum leptin and (C) ADRB3 and HSL expression in subcutaneous WAT of lean and obese persons (n=5/group). (D) Fasting free fatty acids (WT+HFD vehicle n=5, auranofin n=9; LepR KO vehicle n=4, auranofin n=5). (E) eWAT ex vivo Oxygen consumption rate (OCR, n=12/group) after 100 nM auranofin or vehicle (DMSO). (F) Glycerol release from wild-type and beta-less (Adrb1/Adrb2/Adrb3 KO) eWAT cultured ex vivo with 100 nM auranofin or vehicle (DMSO) +/− isoproterenol (10 μM) for 2 hours (n=3/group). (G) Immunoblots of eWAT lysates from (F) probed and quantified (n=4/group) for phospho-HSL and total HSL. (H) Glycerol release from eWAT 2 hours after 100 nM auranofin or vehicle (DMSO) and isoproterenol (WT+HFD n=12/group; LepR KO n=8/group). (I) eWAT leptin secretion into the media two hours after vehicle, isoproterenol (1 μM), or isoproterenol (1 μM) plus 100 nM auranofin (n=7/group). (J) Immunofluorescent staining and quantification of macrophages using Mac2 (n=6/group, scale=250 μm) and CD68 (n=3/group, scale=100 μm). (K) Immunoblots of eWAT lysates probed for tyrosine hydroxylase (TH) with corresponding densitometry. All data are mean ± SEM. *p<0.05, #p<0.10 by unpaired t-test (A, RNA-Seq; B-E), one-way ANOVA with Tukey’s multiple comparisons test (I), and two-way ANOVA with Tukey’s multiple comparisons test: (A, qPCR; F; G, pHSL/HSL; H; J; K)

References

    1. Afshin A, Forouzanfar MH, Reitsma MB, Sur P, Estep K, Lee A, Marczak L, Mokdad AH, Moradi-Lakeh M, Naghavi M, et al. (2017). Health effects of overweight and obesity in 195 countries over 25 years. N Engl J Med 377, 13–27. - PMC - PubMed
    1. Alvarsson A, Jimenez-Gonzalez M, Li R, Rosselot C, Tzavaras N, Wu Z, Stewart AF, Garcia-Ocaña A, and Stanley SA (2020). A 3D atlas of the dynamic and regional variation of pancreatic innervation in diabetes. Sci Adv 6. - PMC - PubMed
    1. Bachman ES, Dhillon H, Zhang CY, Cinti S, Bianco AC, Kobilka BK, and Lowell BB (2002). betaAR signaling required for diet-induced thermogenesis and obesity resistance. Science 297, 843–845. - PubMed
    1. Bak DW, Gao J, Wang C, and Weerapana E (2018). A quantitative chemoproteomic platform to monitor selenocysteine reactivity within a complex proteome. Cell Chem Biol 25, 1157–1167.e1154. - PMC - PubMed
    1. Baker JF, England BR, George MD, Wysham K, Johnson T, Kunkel G, Sauer B, Hamilton BC, Hunter CD, Duryee MJ, et al. (2022). Elevations in adipocytokines and mortality in rheumatoid arthritis. Rheumatology (Oxford). in press, Mar 23. - PMC - PubMed

Publication types