. 2022 Nov 3;109(11):2029-2048.
doi: 10.1016/j.ajhg.2022.09.013. Epub 2022 Oct 14.

Multi-omics approach dissects cis-regulatory mechanisms underlying North Carolina macular dystrophy, a retinal enhanceropathy

Affiliations

Multi-omics approach dissects cis-regulatory mechanisms underlying North Carolina macular dystrophy, a retinal enhanceropathy

Stijn Van de Sompele et al. Am J Hum Genet. .

Abstract

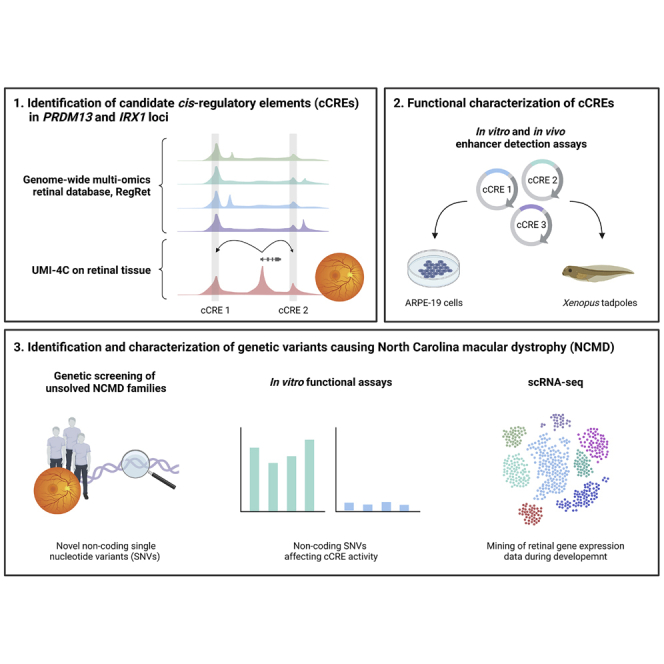
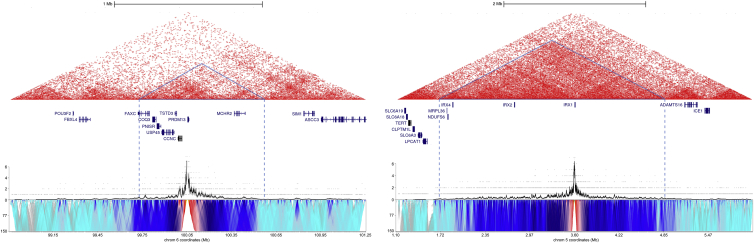
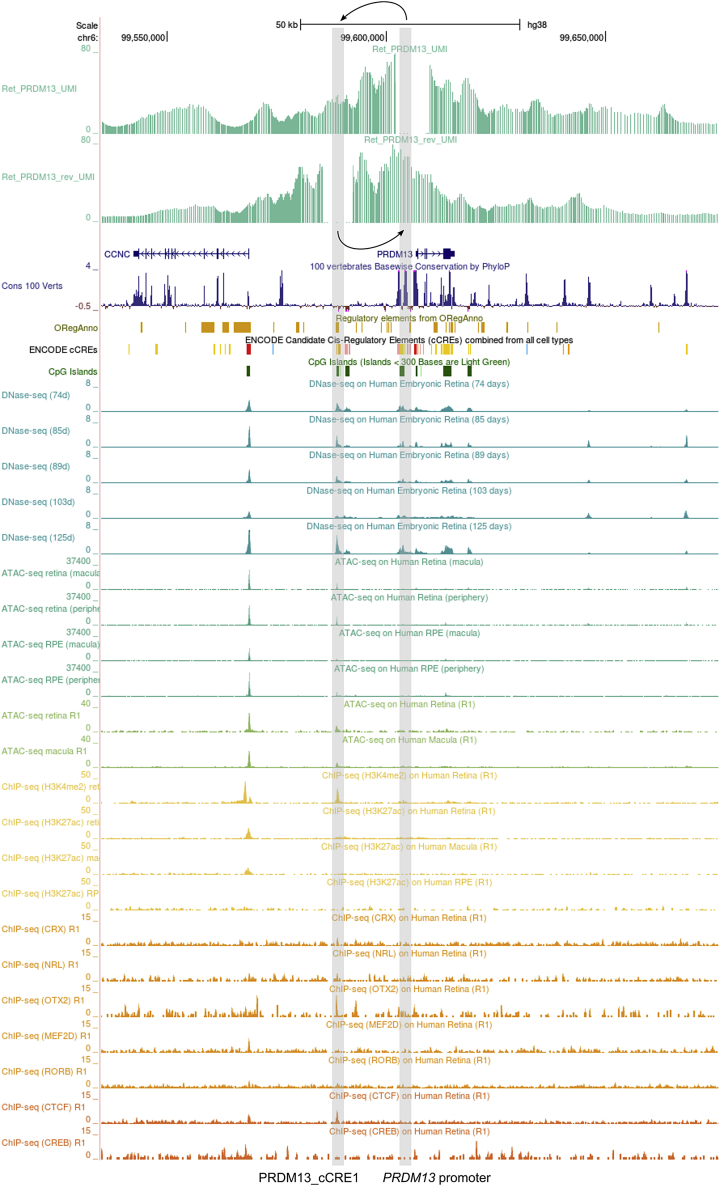
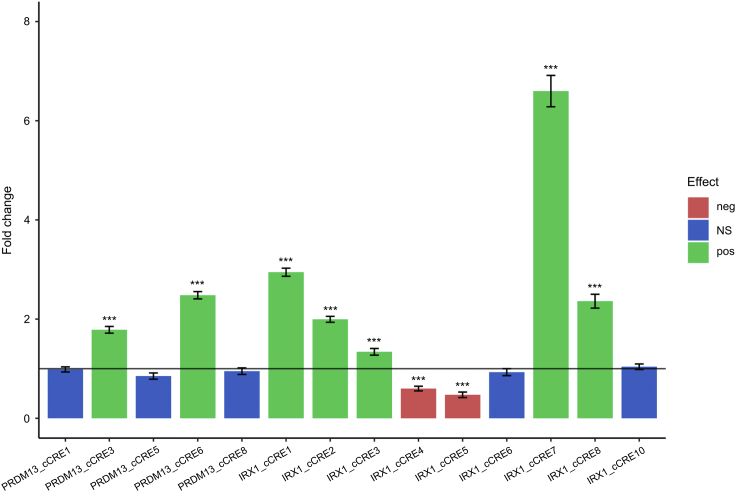
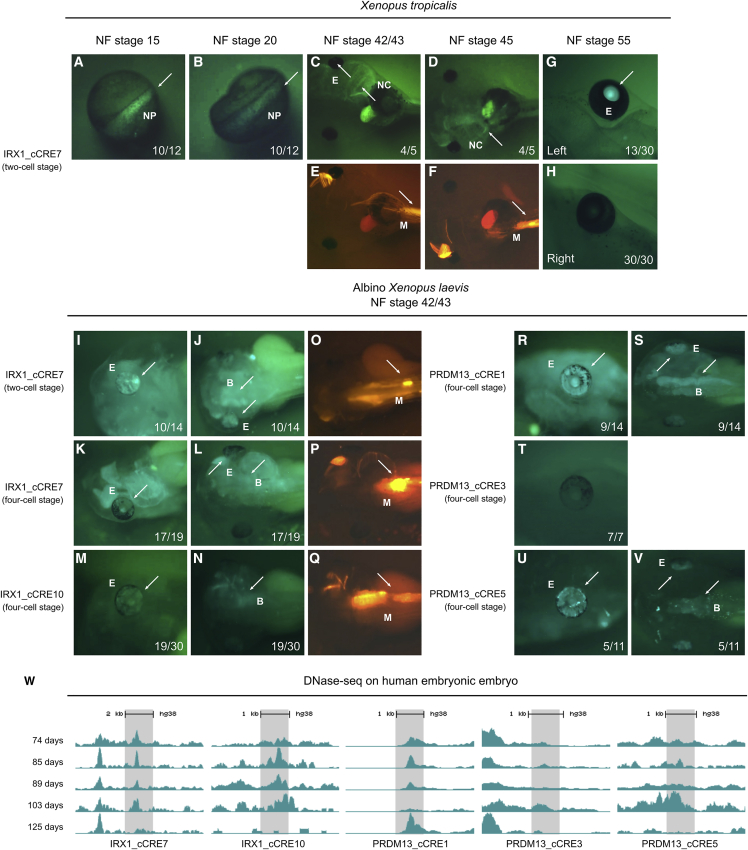
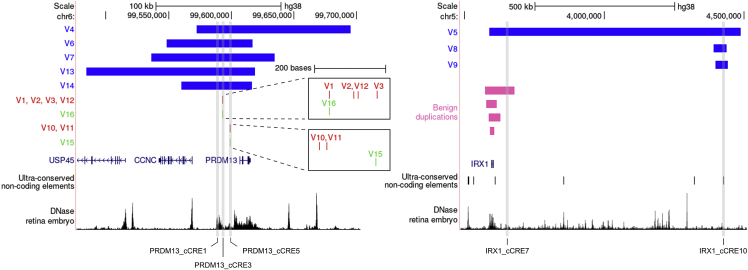
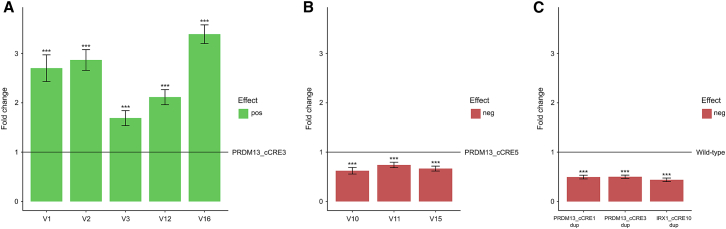
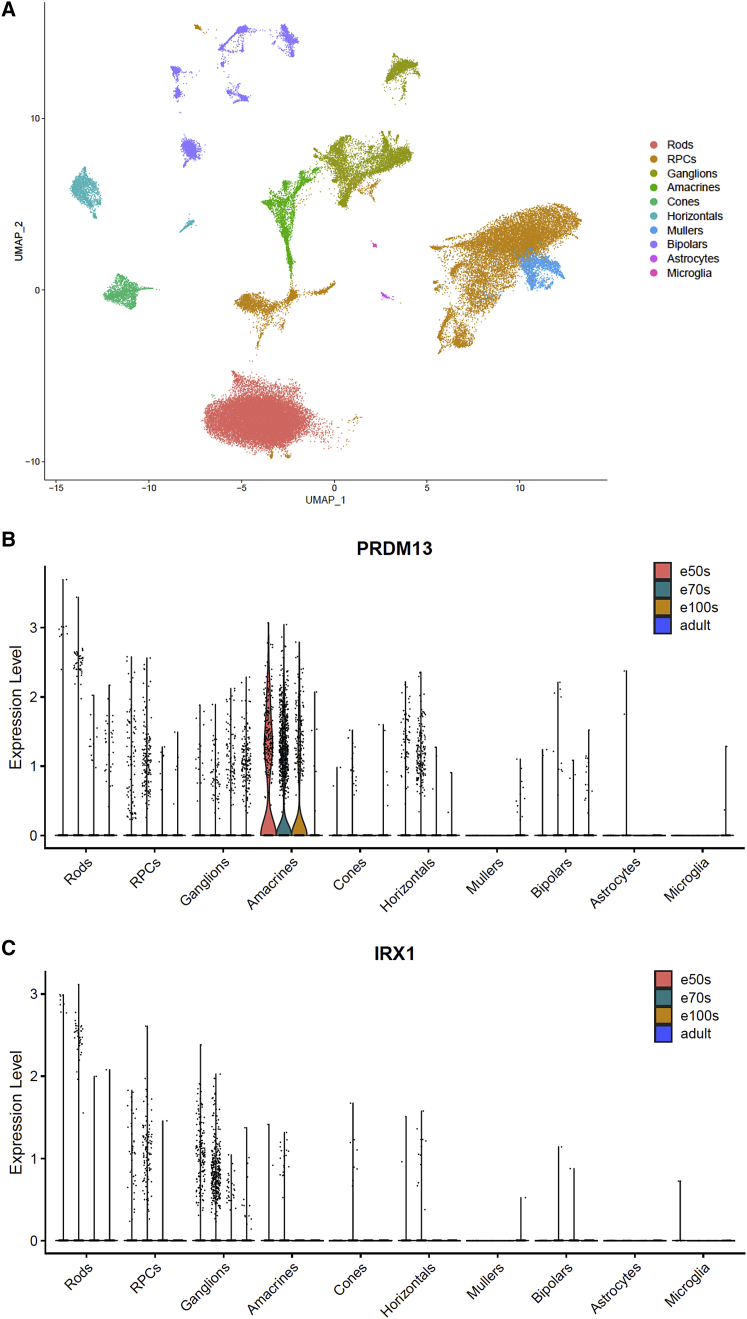
North Carolina macular dystrophy (NCMD) is a rare autosomal-dominant disease affecting macular development. The disease is caused by non-coding single-nucleotide variants (SNVs) in two hotspot regions near PRDM13 and by duplications in two distinct chromosomal loci, overlapping DNase I hypersensitive sites near either PRDM13 or IRX1. To unravel the mechanisms by which these variants cause disease, we first established a genome-wide multi-omics retinal database, RegRet. Integration of UMI-4C profiles we generated on adult human retina then allowed fine-mapping of the interactions of the PRDM13 and IRX1 promoters and the identification of eighteen candidate cis-regulatory elements (cCREs), the activity of which was investigated by luciferase and Xenopus enhancer assays. Next, luciferase assays showed that the non-coding SNVs located in the two hotspot regions of PRDM13 affect cCRE activity, including two NCMD-associated non-coding SNVs that we identified herein. Interestingly, the cCRE containing one of these SNVs was shown to interact with the PRDM13 promoter, demonstrated in vivo activity in Xenopus, and is active at the developmental stage when progenitor cells of the central retina exit mitosis, suggesting that this region is a PRDM13 enhancer. Finally, mining of single-cell transcriptional data of embryonic and adult retina revealed the highest expression of PRDM13 and IRX1 when amacrine cells start to synapse with retinal ganglion cells, supporting the hypothesis that altered PRDM13 or IRX1 expression impairs interactions between these cells during retinogenesis. Overall, this study provides insight into the cis-regulatory mechanisms of NCMD and supports that this condition is a retinal enhanceropathy.

Keywords: IRX1; North Carolina macular dystrophy, NCMD; PRDM13; UMI-4C; cis-regulatory elements, CREs; enhanceropathy; human retina; multi-omics; non-coding single-nucleotide variants, SNVs; whole-genome sequencing.


Conflict of interest statement

Declaration of interests The authors declare no competing interests.

Figures

None
Graphical abstract
Figure 1
Figure 1
Integration of the generated UMI-4C data with publicly available Hi-C data The UMI-4C interaction frequency profiles and domainograms (bottom) for the PRDM13 promoter (left) and IRX1 promoter (right) viewpoints were integrated with Hi-C data from control human retinal organoids (top), demonstrating promoter interactions within the respective TADs. Topologically associated domains (TADs) are indicated by blue triangles. Chromosome coordinates are in hg38 annotation.
Figure 2
Figure 2
Output from the UMI-4C experiment in the PRDM13 locus The UMI-4C data (green) from the PRDM13 promoter viewpoint (right gray bar) illustrate an interaction with PRDM13_cCRE1 (left gray bar), a non-coding region upstream of the promoter (left arrow). Since underlying epigenomic tracks show an overlap of this region with DNase-seq (turquoise) and ATAC-seq (green) peaks, as well as with ChIP-seq profiles of specific histone marks indicative of enhancer activity (H3K4me2, H3K27ac) (yellow) and ChIP-seq profiles of retinal transcription factors (CRX, NRL, OTX2) (orange), this region is a strong cCRE. The reverse UMI-4C experiment using this cCRE as a viewpoint results in a peak around the PRDM13 promoter region (right arrow), confirming this interaction. cCRE, candidate CRE.
Figure 3
Figure 3
Results from the luciferase assays for the set of fourteen cCREs The bar plot shows, for each cCRE, the fold change of the luciferase reporter level relative to the level of the negative control luciferase vector (fold change = 1). neg, negative; NS, not significant; pos, positive; ∗∗∗p < 0.001.
Figure 4
Figure 4
Overview of the results from the in vivo transgenic enhancer assays in Xenopus Representative images of EGFP reporter expression in living, transgenic Xenopus tadpoles, driven by SED vector reporter constructs containing non-coding regions of interest. The respective Xenopus species injected and the Nieuwkoop and Faber (NF) stage shown in the pictures are indicated on top of the images, while the injected construct and the stage of injection are indicated left of the images. For each stage, the number of tadpoles displaying the depicted EGFP reporter expression pattern over the total number of analyzed transgenic tadpoles is given. (A and B) Dorsal view of transgenic Xenopus tropicalis embryos upon unilateral injection of the reporter construct containing IRX1_cCRE7. EGFP reporter expression was visible at the neural plate and tube (NP) on the injected side, indicated by the arrow, while no expression was observed on the non-injected side. (C and D) Ventral view of transgenic tadpoles, displaying EGFP reporter expression in the craniofacial cartilage, a derivative of the neural crest (NC), and the eye (E) on the injected side. (E and F) At the same stages, DsRed (positive control) expression was apparent in the myotomes (M) of the tadpoles. (G and H) Detailed view of the eye at NF stage 55 indicates that EGFP reporter expression was maintained on the injected (left) side, while no expression was observed in the non-injected (right) side. (I and J) Lateral and dorsal view of transgenic albino Xenopus laevis tadpoles upon unilateral injection of the reporter construct containing IRX1_cCRE7 in the two-cell stage demonstrated EGFP reporter expression in the eye and brain (B). (K and L) Lateral and dorsal view of transgenic tadpoles injected with the same construct, but in two of the dorsal blastomeres at the four-cell stage, also displayed EGFP reporter expression in the eye and brain. (M and N) Lateral and dorsal view of transgenic tadpoles introduced with the IRX1_cCRE10 reporter construct demonstrated low EGFP reporter expression in the eye and brain. (O–Q) DsRed (positive control) was expressed in the myotomes of the corresponding tadpoles. (R and S) Lateral and dorsal view of transgenic albino Xenopus laevis tadpoles upon injection of the reporter construct containing the PRDM13_cCRE1 region demonstrated EGFP reporter expression in the eye and brain. (T) Lateral view of transgenic tadpoles injected with mutational hotspot-1 (PRDM13_cCRE3) showed no EGFP reporter expression in the eye or brain. (U and V) Lateral and dorsal view of transgenic tadpoles injected with mutational hotspot-2 (PRDM13_cCRE5) demonstrated EGFP reporter expression in the eye and brain. (W) For the five cCREs analyzed using in vivo enhancer detection assays, DNase-seq profiles generated in human embryonic retinal tissue at five different developmental stages are given. In case of IRX1_cCRE7, IRX1_cCRE10, PRDM13_cCRE1, and PRDM13_cCRE7, open chromatin is observed at/until day 103 of development, while PRDM13_cCRE1 is closed exclusively at this period.
Figure 5
Figure 5
Overview of (likely) pathogenic variants in the PRDM13 locus and IRX1 locus Known and novel SNVs are indicated by red and green bars, respectively. The pathogenic tandem duplications are shown as blue bars, while benign duplications spanning the IRX1 coding region, derived from DGV, are shown as pink bars. The five cCREs analyzed via in vivo enhancer assays in Xenopus are highlighted by grey vertical bars. The DNase-seq track was generated in human embryonic retinal tissue at day 103 of development. Chromosome coordinates are in hg38 annotation. PRDM13 locus, left; IRX1 locus, right; V, variant; DGV, Database of Genomic Variants.
Figure 6
Figure 6
Overview of the in vitro mutant versus wild-type luciferase assays in ARPE-19 cells (A) In mutational hotspot-1 (PRDM13_cCRE3) upstream of PRDM13, the four known (V1–V3, V12) variants and the V16 variant demonstrate a significant increase of luciferase reporter activity (p < 0.001), relative to the wild-type vector. (B) In contrast, the two known (V10, V11) variants and the V15 variant located in mutational hotspot-2 (PRDM13_cCRE5) upstream of PRDM13 cause a significant decrease of luciferase reporter activity (p < 0.001), relative to the wild-type vector. (C) For three non-coding regions of interest, located in the shared duplicated region of either the PRDM13 or IRX1 locus, the level of luciferase reporter was reduced by half (p < 0.001) when the region was present as tandem duplication, relative to their respective wild-type counterpart, containing the same region of interest as a single insert. neg, negative; pos, positive; ∗∗∗p < 0.001.
Figure 7
Figure 7
Single-cell transcriptomic analysis of developing human neural retina In particular, data from six embryonic (e) (53, 59, 74, 78, 113, and 132 days) and three adult (25, 50, and 54 years old) human retinal samples are included. (A) UMAP plot of 60,014 human neural retinal cells from all samples, colored based on the ten transcriptionally distinct clusters represented in the key. (B and C) The different retinal samples were grouped into four time points: e50 = d53 and d59, e70 = d74 and d78, e100 = d113 and d132, adult = 3 samples. Violin plots illustrate respective PRDM13 and IRX1 expression in the different retinal cell types for each of these time points. RPCs, retinal precursor cells.

References

    1. Farwell K.D., Shahmirzadi L., El-Khechen D., Powis Z., Chao E.C., Tippin Davis B., Baxter R.M., Zeng W., Mroske C., Parra M.C., et al. Enhanced utility of family-centered diagnostic exome sequencing with inheritance model-based analysis: Results from 500 unselected families with undiagnosed genetic conditions. Genet. Med. 2015;17:578–586. - PubMed
    1. Haer-Wigman L., van Zelst-Stams W.A., Pfundt R., van den Born L.I., Klaver C.C., Verheij J.B., Hoyng C.B., Breuning M.H., Boon C.J., Kievit A.J., et al. Diagnostic exome sequencing in 266 Dutch patients with visual impairment. Eur. J. Hum. Genet. 2017;25:591–599. - PMC - PubMed
    1. Arts P., Simons A., Alzahrani M.S., Yilmaz E., Alidrissi E., van Aerde K.J., Alenezi N., Alghamdi H.A., Aljubab H.A., Al-Hussaini A.A., et al. Exome sequencing in routine diagnostics: A generic test for 254 patients with primary immunodeficiencies. Genome Med. 2019;11:38. - PMC - PubMed
    1. Majewski J., Schwartzentruber J., Lalonde E., Montpetit A., Jabado N. What can exome sequencing do for you? J. Med. Genet. 2011;48:580–589. - PubMed
    1. ENCODE Project Consortium. Kundaje A., Aldred S.F., Collins P.J., Davis C.A., Doyle F., Epstein C.B., Frietze S., Harrow J., Kaul R., et al. An integrated encyclopedia of DNA elements in the human genome. Nature. 2012;489:57–74. - PMC - PubMed

Publication types

Supplementary concepts