. 2022 Nov 21;32(22):4842-4853.e6.
doi: 10.1016/j.cub.2022.09.045. Epub 2022 Oct 14.

Manipulation-specific cortical activity as mice handle food

Affiliations

Manipulation-specific cortical activity as mice handle food

John M Barrett et al. Curr Biol. .

Abstract

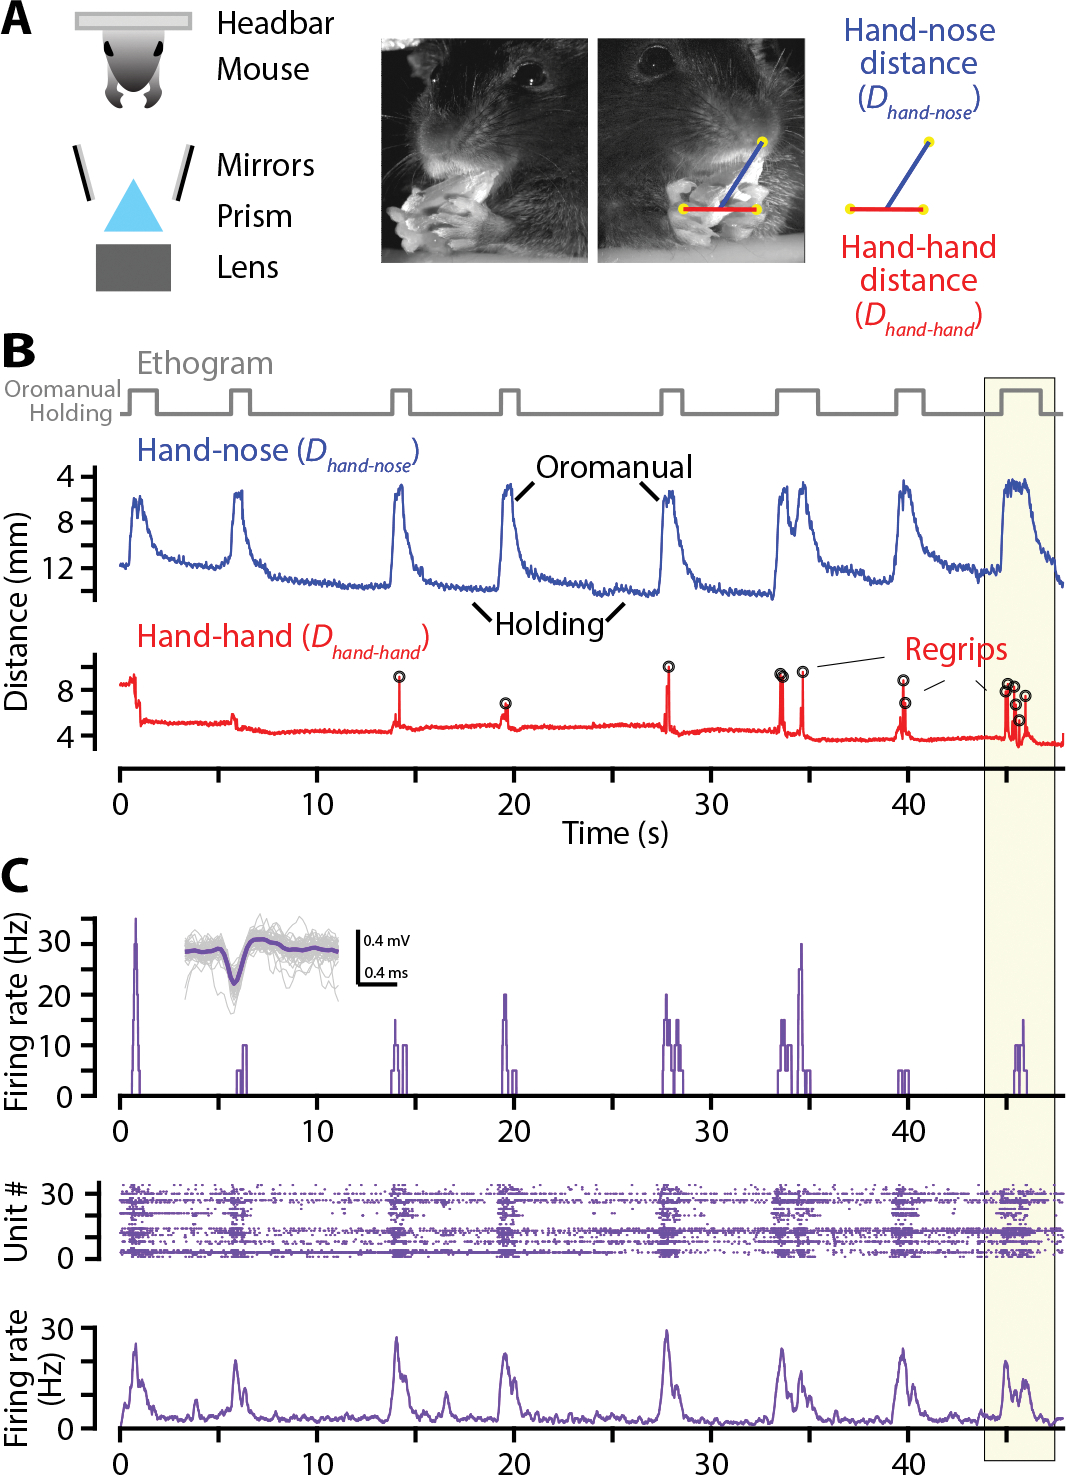
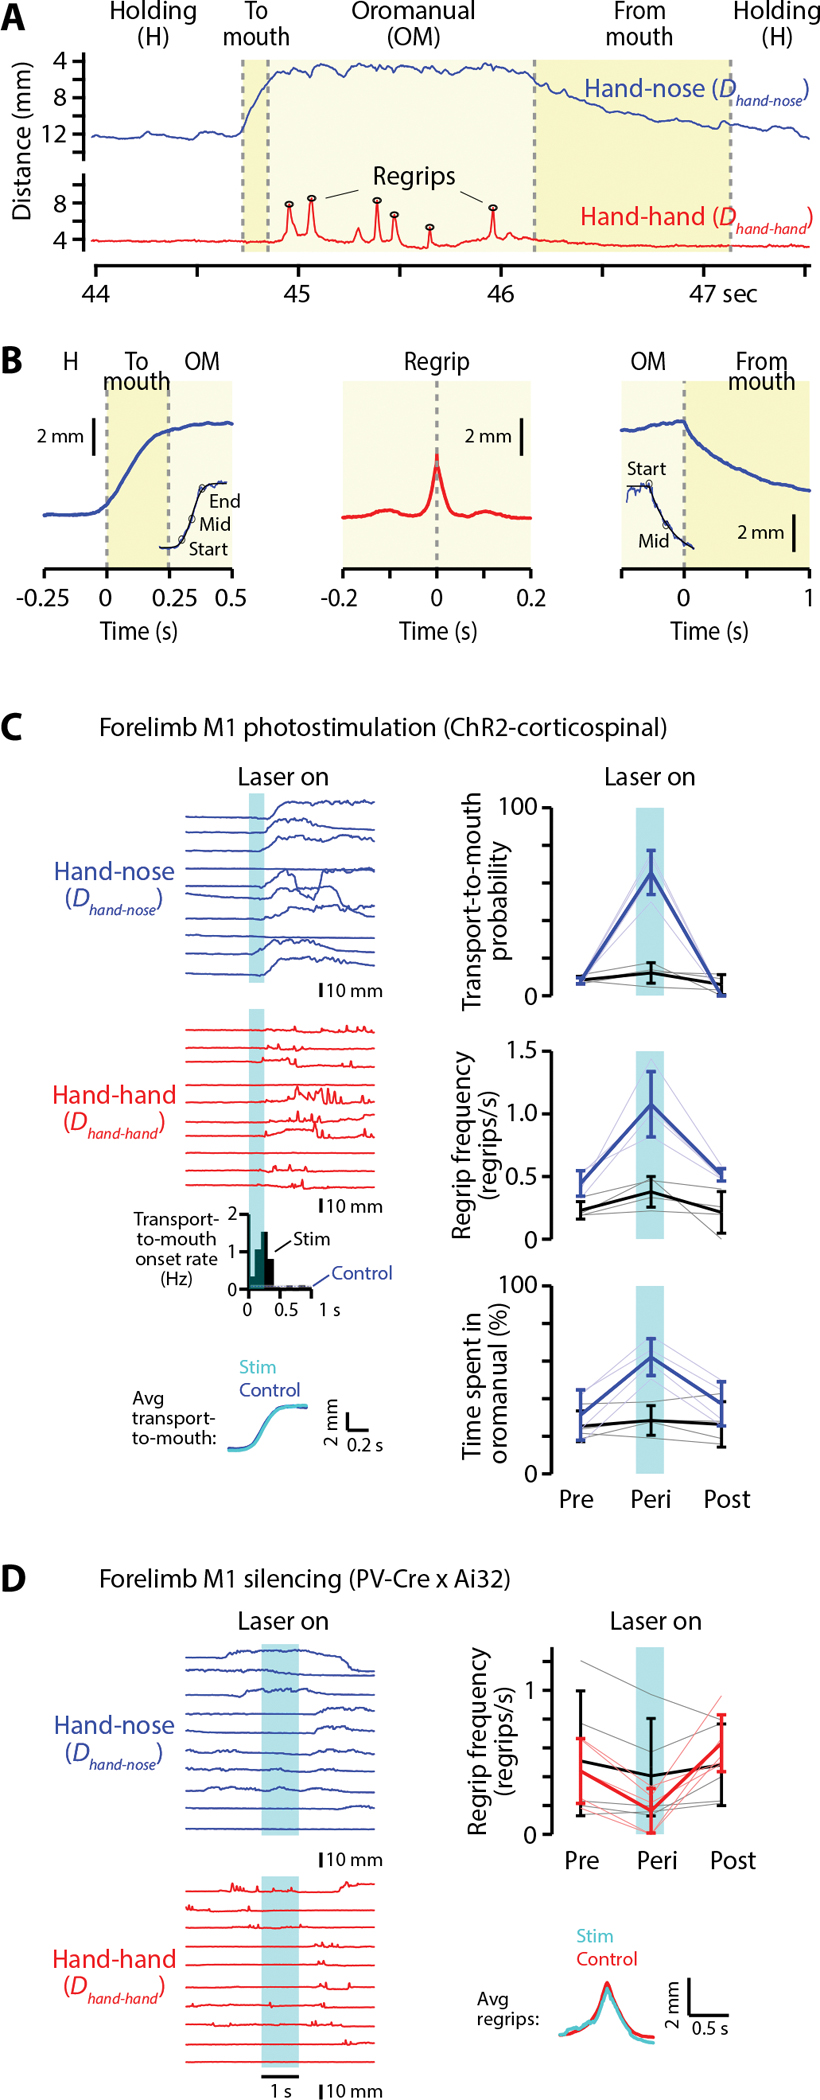
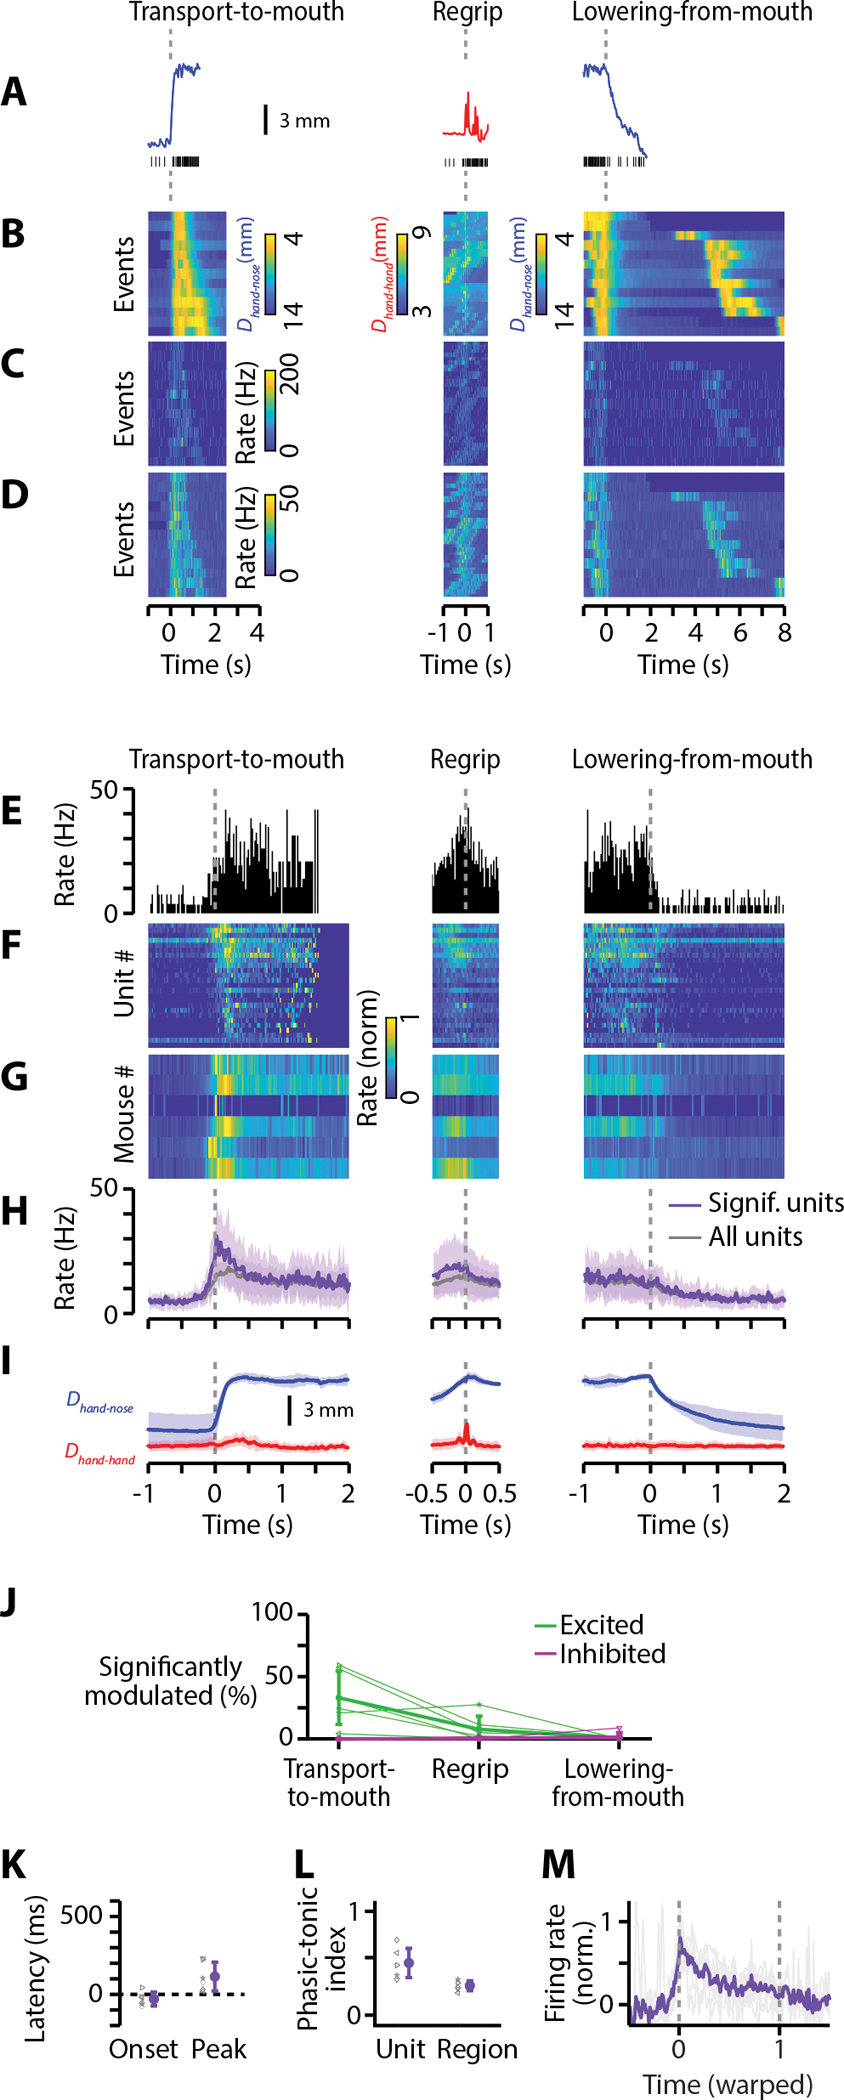
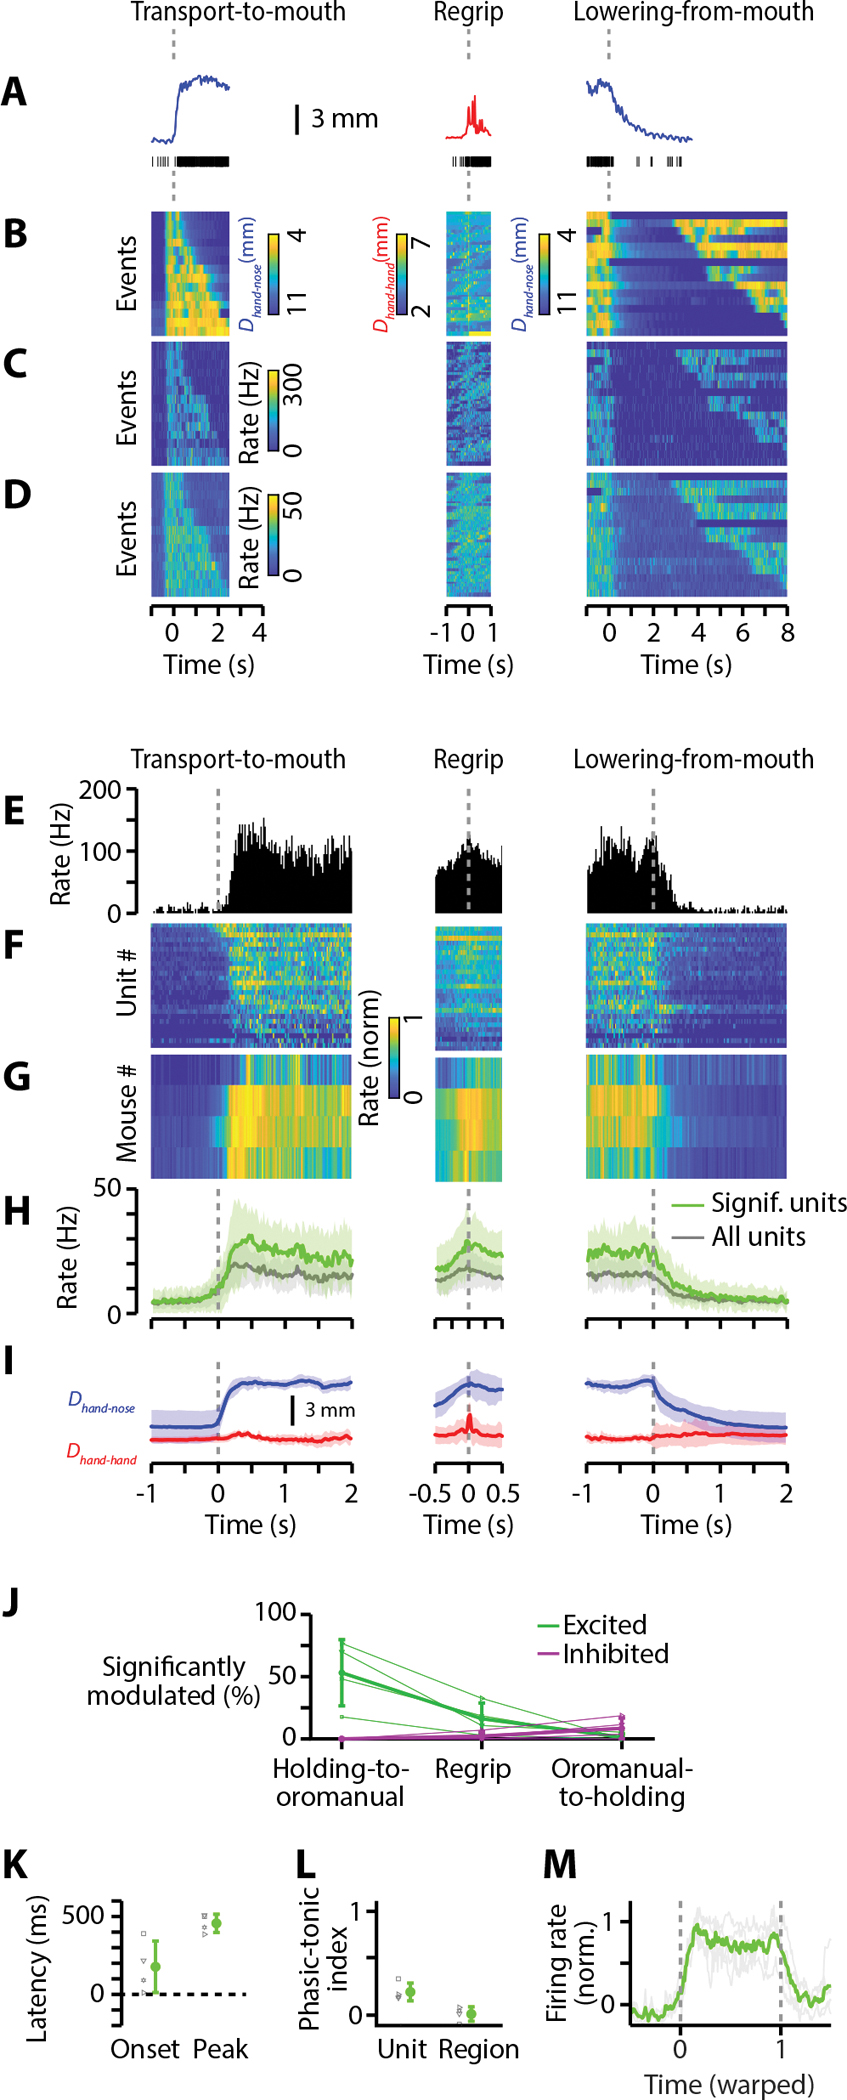
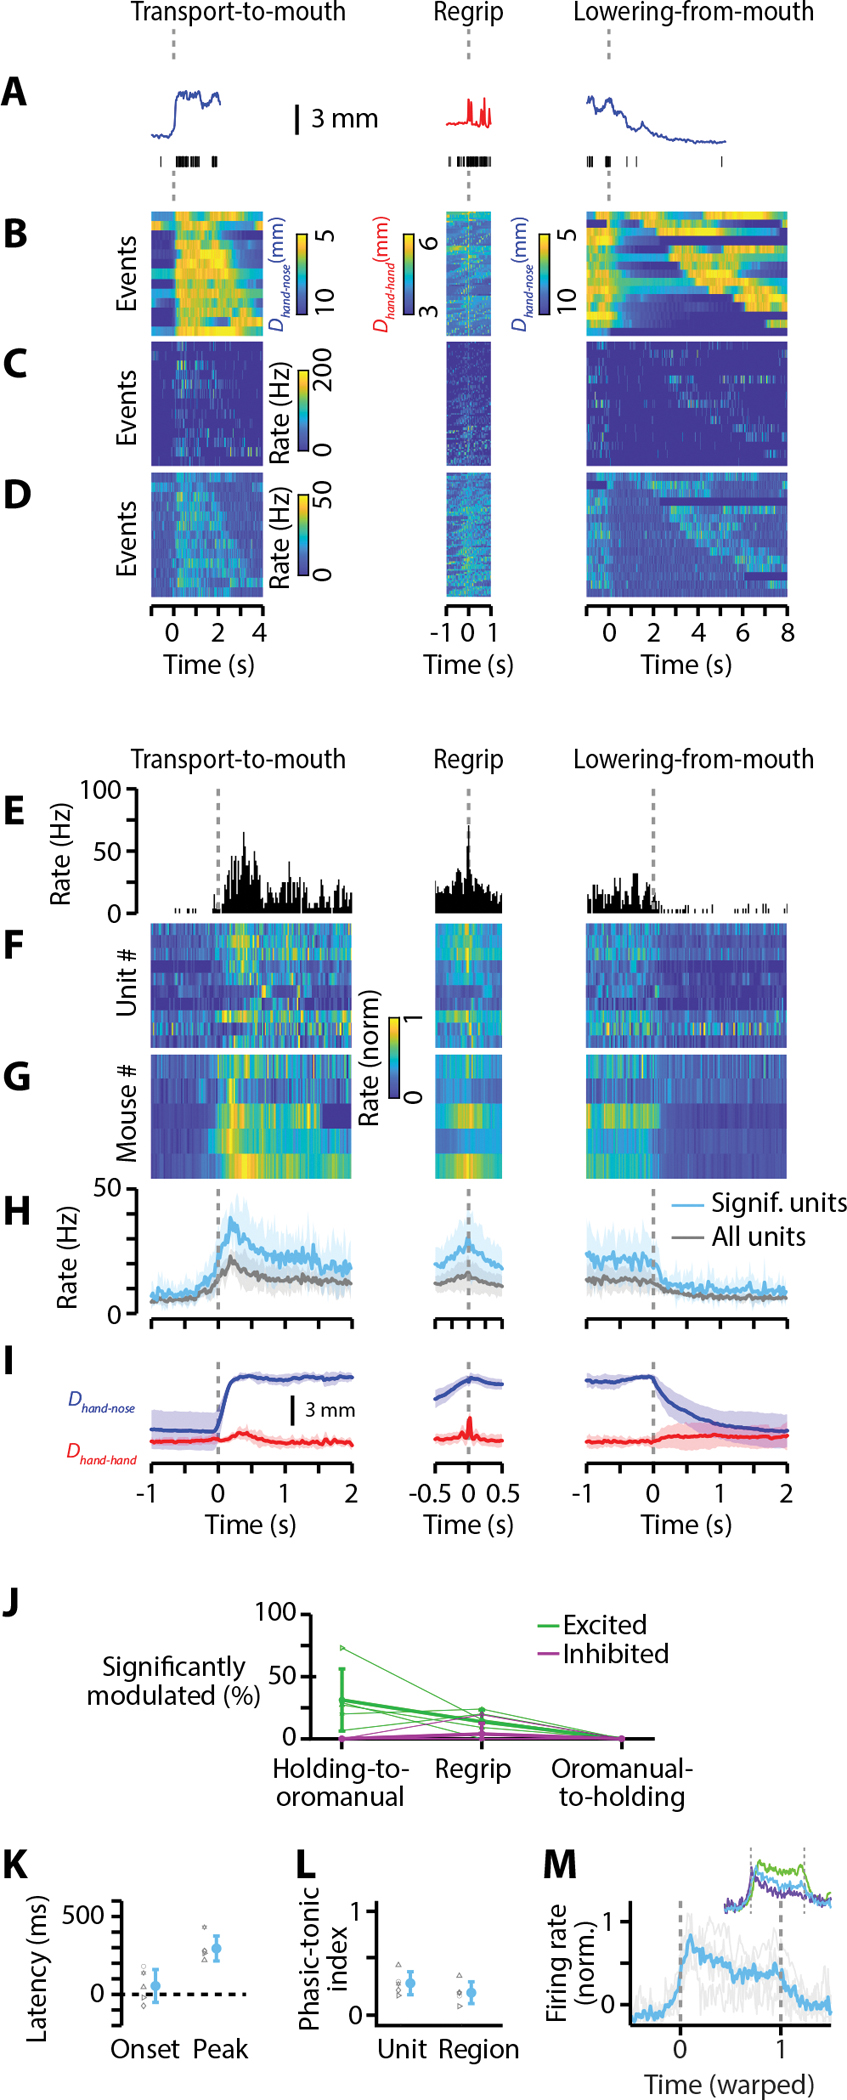
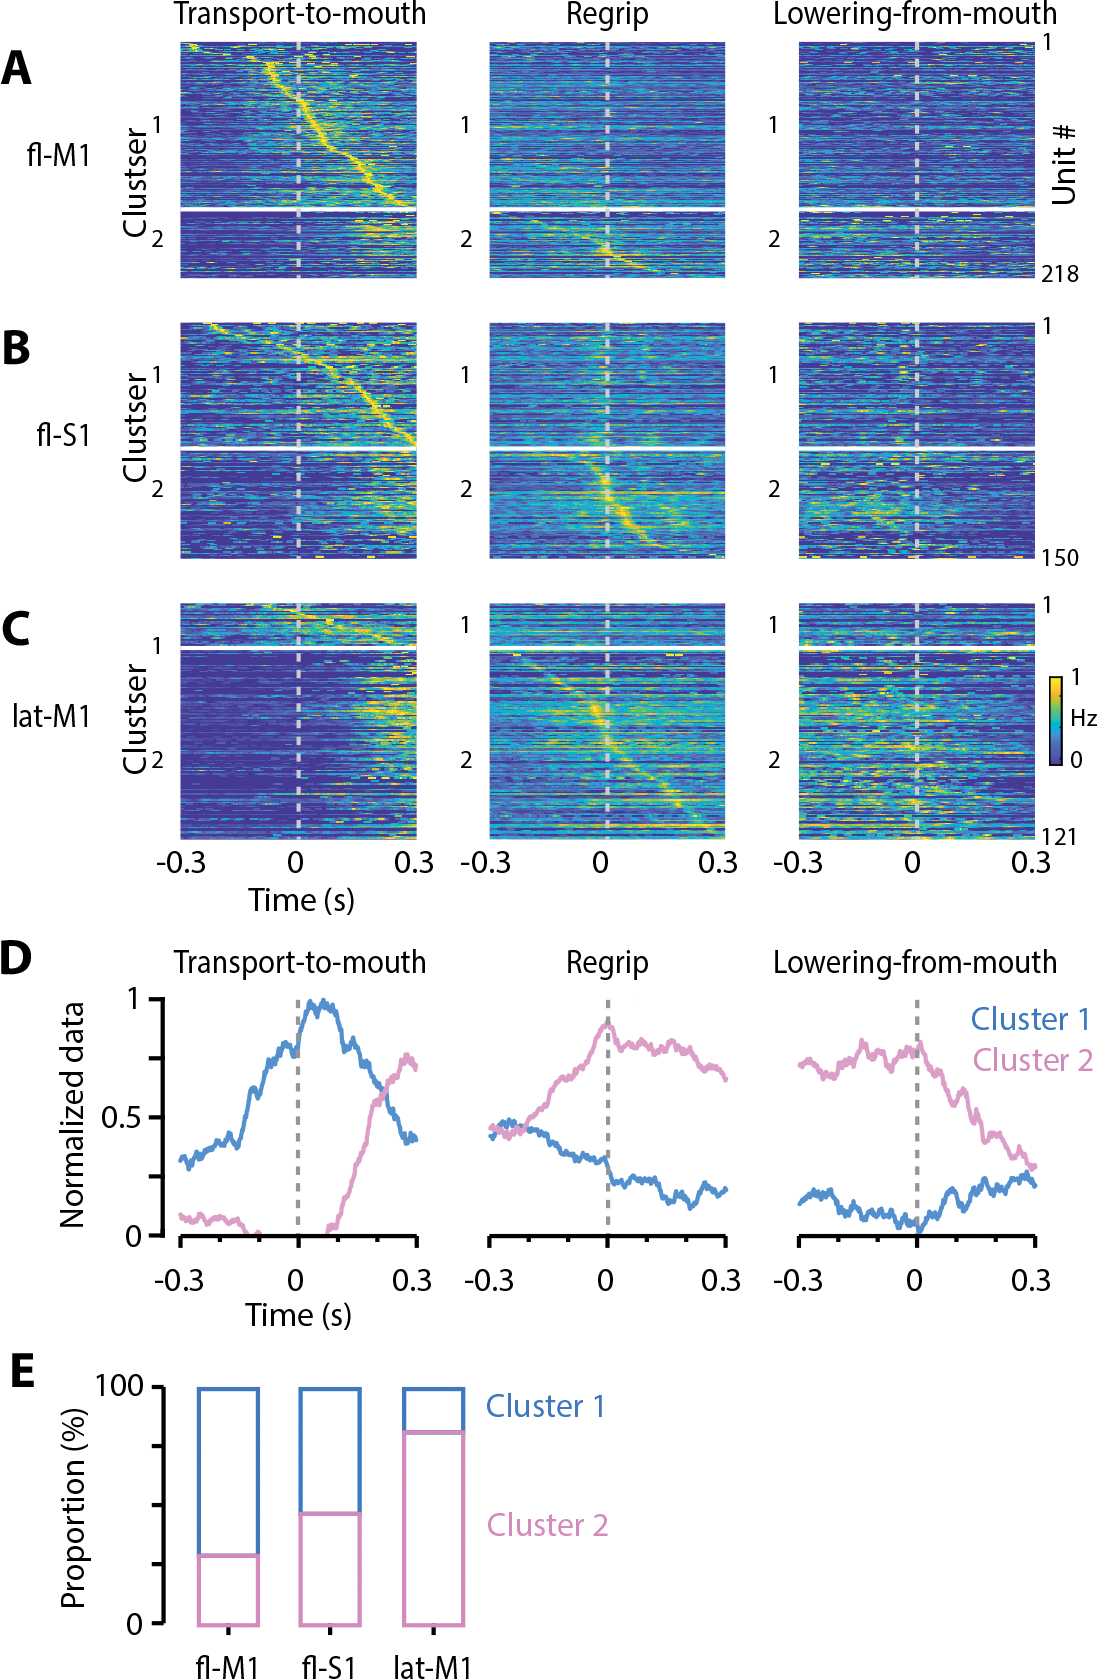
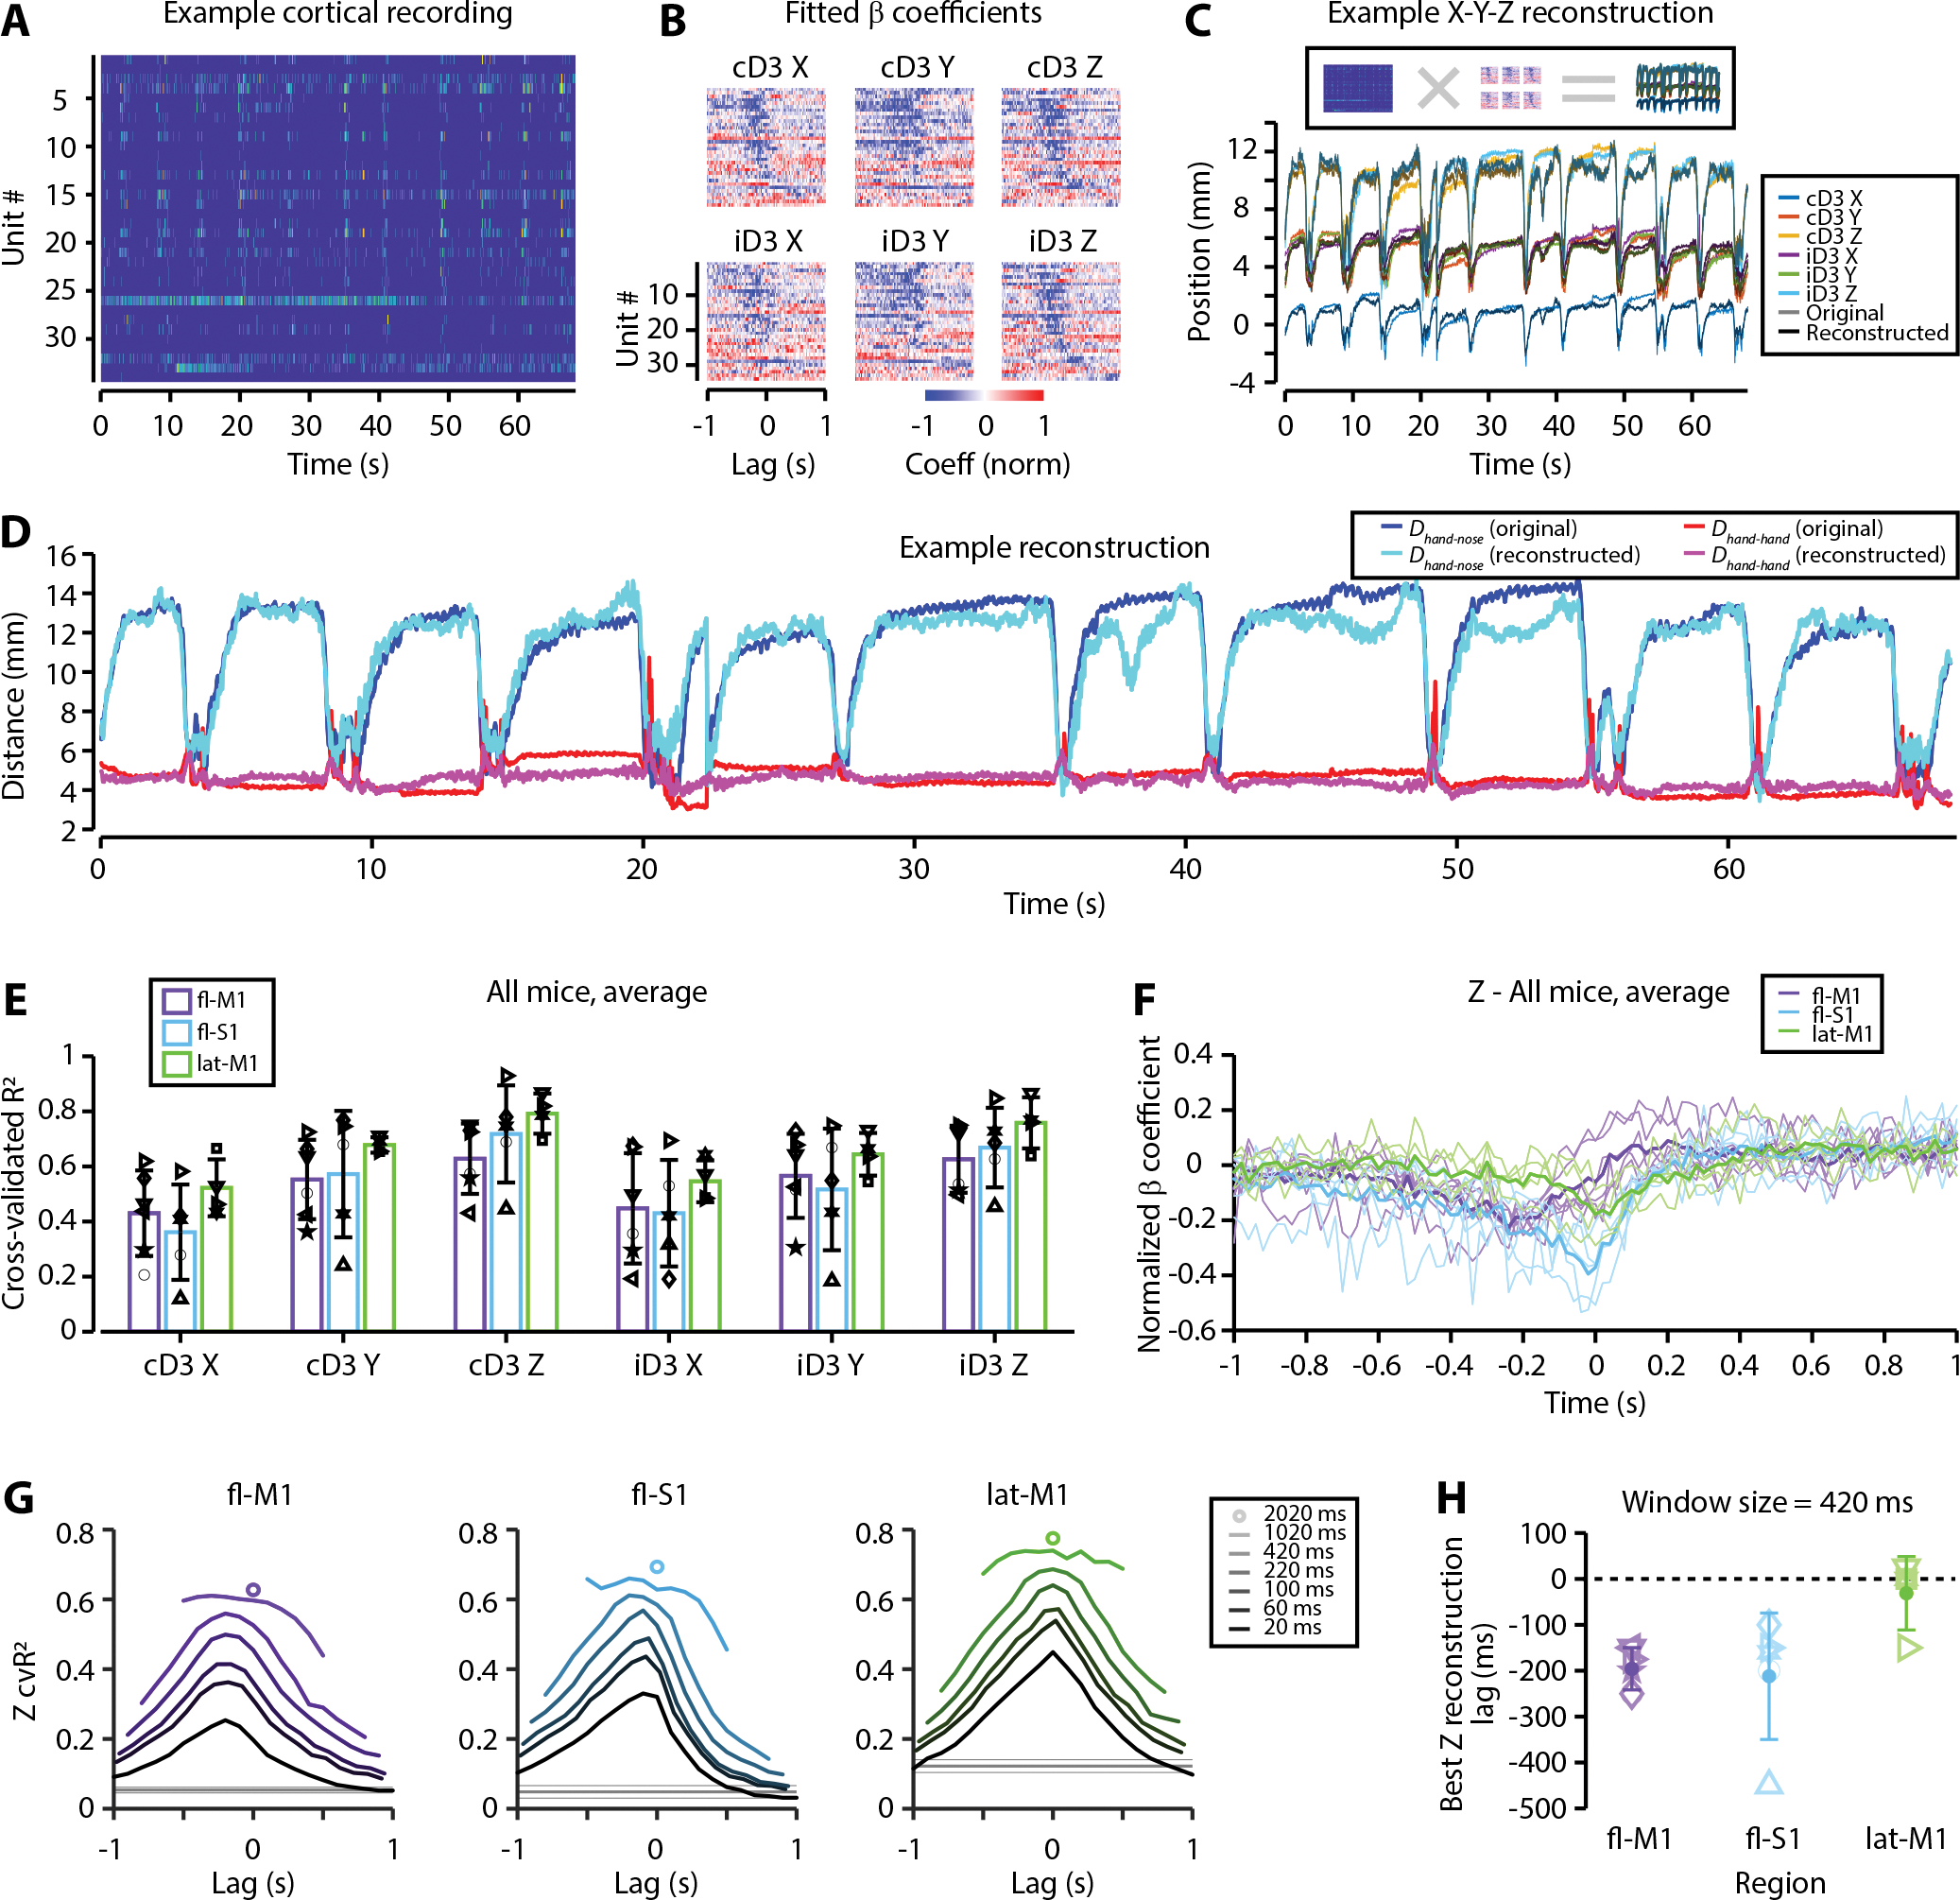
Food handling offers unique yet largely unexplored opportunities to investigate how cortical activity relates to forelimb movements in a natural, ethologically essential, and kinematically rich form of manual dexterity. To determine these relationships, we recorded high-speed (1,000 fps) video and multi-channel electrophysiological cortical spiking activity while mice handled food. The high temporal resolution of the video allowed us to decompose active manipulation ("oromanual") events into characteristic submovements, enabling event-aligned analysis of cortical activity. Activity in forelimb M1 was strongly modulated during food handling, generally higher during oromanual events and lower during holding intervals. Optogenetic silencing and stimulation of forelimb M1 neurons partially affected food-handling movements, exerting suppressive and activating effects, respectively. We also extended the analysis to forelimb S1 and lateral M1, finding broadly similar oromanual-related activity across all three areas. However, each area's activity displayed a distinct timing and phasic/tonic temporal profile, which was further analyzed by non-negative matrix factorization and demonstrated to be attributable to area-specific composition of activity classes. Current or future forelimb position could be accurately predicted from activity in all three regions, indicating that the cortical activity in these areas contains high information content about forelimb movements during food handling. These results thus establish that cortical activity during food handling is manipulation specific, distributed, and broadly similar across multiple sensorimotor areas while also exhibiting area- and submovement-specific relationships with the fast kinematic hallmarks of this natural form of complex free-object-handling manual dexterity.

Keywords: electrophysiology; food handling; forelimb; generalized linear model; manual dexterity; motor cortex; non-negative matrix factorization; optogenetics; oromanual; somatosensory cortex.


Conflict of interest statement

Declaration of interests The authors declare no competing interests.

Figures

Figure 1:
Figure 1:. Forelimb M1 activity during food-handling is associated with oromanual events
(A) Left: schematic of experimental set-up. Right: example video frames, with the hand-nose (Dhand-nose, blue) and hand-hand (Dhand-hand, red) distances annotated on the far right. (B) Example Dhand-nose (blue, top, reverse Y axis) and Dhand-hand (right, bottom) traces. Peaks and troughs in Dhand-nose correspond to oromanual events and holding intervals, while regrips appear as spikes in Dhand-hand. (C) Top: firing rate of a forelimb M1 single unit recorded simultaneously with the traces in (B). Inset: Example single unit. Middle: raster plot of spiking recorded on multiple channels on the same probe. Bottom: average firing rate across all units recorded on the same probe. See also Figure S1–2, Table S1, and Video S1–2.
Figure 2:
Figure 2:. Oromanual kinematics: submovement composition and modulation by forelimb M1 activity manipulations
(A) Dhand-nose (blue) and Dhand-hand (red) traces of an example oromanual event (highlighted event in Figure 1A). (B) Event-aligned and averaged transport-to-mouth (left), regrip (middle), and lowering-from-mouth (right) movements. Error bands indicate mean ± s.d for n = 9 mice. Insets show example curve fits to identify the start, middle, and end points of movements (STAR Methods). (C) Left: Example Dhand-nose (blue, top) and Dhand-hand (red, middle) traces during optogenetic stimulation. The peristimulus time histogram below shows the rate of transport-to-mouth movements in 100 ms bins following stimulus onset when stimulation was delivered during holding for n = 4 ChR2-expressing mice. Thin lines (‘Control’) indicate the background rate (‘Control’) (blue dashed: mean; solid grey: ±2 s.d.). Bottom left: average transport-to-mouth trajectories immediately following stimulation (cyan) and at all other times (blue). Top right: probability of observing a transport-to-mouth movement within 400 ms of stimulus onset (‘Peri’) compared to virtual stimulus timings shifted one second earlier (‘Pre’) or later (‘Post’), when stimulation occurred during holding, for mice expressing ChR2 in corticospinal neurons (blue, n = 4 mice) or control mice (GFP in corticospinal neurons or failed transfection, black, n = 4 mice). Middle right: mean frequency of regrips on all trials in the two seconds before (‘Pre’), one second during and immediately after stimulation (‘Peri’) and the following 2.4 seconds (‘Post’). Bottom right: same, but for percentage of time spent in oromanual. Thin lines are individual mice, thick error bars are mean ± s.d. over mice. (D) Left: Example Dhand-nose (blue, top) and Dhand-hand (red, bottom) traces during optogenetic silencing. Top right: Regrip frequency in the one second windows before (‘Pre’), during (‘Peri’), and after (‘Post’) silencing for wild-type (black, n = 5 mice) or PVxAi32 (red, n = 5 mice) mice. Thin lines are individual mice, thick error bars are mean ± s.d. over mice. Bottom right: average regrip trajectories between (red, n = 5 PVxAi32 mice) and during silencing trials (cyan, n = 3 PVxAi32 mice with regrips during silencing). See also Figure S3, Table S1–3, and Video S3–4.
Figure 3:
Figure 3:. Phasic-tonic oromanual-related activity in forelimb M1
(A) Traces of Dhand-nose (blue, reverse y-axis) for an example transport-to-mouth movement (left), Dhand-hand (red) for an example regrip (middle), and Dhand-nose for an example lowering-from-mouth movement (right). (B) Heatmap of all peri-oromanual event traces of kinematics for the same experiment as in (A). Left: Map of Dhand-nose (inverse color scale), aligned to the transport-to-mouth onset, sorted by oromanual event duration. Middle: Map of Dhand-hand, aligned to regrips, sorted by latency. Right: Map of Dhand-nose, aligned to lowering-from-mouth onset and sorted by holding interval duration. Subsequent oromanual events (as can be seen for shorter holding intervals) were excluded from analysis of holding-related activity. White arrows denote the corresponding events in (A). (C) Same experiment as (B), showing the corresponding activity of an example forelimb M1 single unit. (D) Same as (C) but showing the average firing rate of all active units recorded from forelimb M1 in the example experiment. (E) Peri-event time histograms (PETHs) for the example single unit in (C). Note shortened time axis. (F) Peak-normalized PETHs of all significantly modulated (see STAR Methods) active units recorded in the same experiment, plotted as a heatmap. White arrow denotes the example single unit in (C) and (E). (G) Average peak-normalized event-aligned firing rates across significantly modulated forelimb M1 active units and across experiments for all mice with forelimb M1 recordings (n = 6). (H) Mouse-average event-aligned firing rates (shaded region, mean ± s.d. over mice) for all units (grey) and only significantly modulated units (purple). (I) Mouse-average event-aligned Dhand-nose (blue, reverse y axis) and Dhand-hand (red) traces. (J) Percentages of forelimb M1 active units significantly excited (green) or inhibited (purple) for each event type. Thin lines are means over experiments for individual mice, error bars are mean ± s.d. over mice. (K) Onset and peak latencies for active units in forelimb M1. Grey symbols are means, averaging first over simultaneously recorded units, and then over experiments for individual mice. Purple symbols and error bars are means ± s.d. over mice. (L) Phasic-tonic indices (PTIs, see STAR Methods) for forelimb M1 active units (“Unit”) and average firing rate traces (“Region”). Grey symbols are means over experiments (after first averaging over simultaneously recorded units for Unit PTIs) for individual mice, purple symbols and error bars are mean ± s.d. over mice. (M) Normalized average forelimb M1 firing rate traces after time-warping each oromanual event to have the same duration. Thin lines are means over experiments for each mouse and thick lines are mean over mice. See also Figure S4, S7 and Table S1.
Figure 4:
Figure 4:. Tonic oromanual-associated activity in lateral M1
As Figure 3, but for all lateral M1 recordings (n = 4). See also Figure S4, S7 and Table S1.
Figure 5:
Figure 5:. Intermediate oromanual-associated activity in forelimb S1
As Figure 3, but for all forelimb S1 recordings (n = 5). Inset in (M) shows mouse-average time-warped firing rate traces for all three regions on the same axis (purple, forelimb M1; green, lateral M1; teal, forelimb S1). See also Figure S4, S7 and Table S1.
Figure 6:
Figure 6:. Phasic and tonic activity classes within and across areas
(A) Each row of the raster is the activity of a forelimb M1 active unit normalized to its maximum firing rate, aligned to transport-to-mouth (left), regrip (middle), and lowering-from-mouth (right) movements, and sorted by time of peak firing around transport-to-mouth movements for cluster 1 and regrips for cluster 2. Neurons were assigned to two clusters by applying NNMF to pooled data from all three areas. (B, C) Same as (A), for forelimb S1 and lateral M1, respectively. (D) NNMF factor weights for the two clusters. (E) Proportions of cluster 1 and 2 units for each area. See also Figure S5, S7 and Table S1
Figure 7:
Figure 7:. Hand position during food handling can be accurately decoded from cortical spiking activity
(A) Example raster showing all active units from a forelimb M1 recording. (B) Fitted GLM coefficients for the X, Y, and Z coordinates of the contra- (c) and ipsilateral (i) third digits (D3) from the recording in (A), normalized to range [−1, 1], ordered by time-to-trough of the contralateral D3 Z coefficients. (C) X, Y, and Z hand trajectories (lighter colors) for the same example recording shown in (A-B) and the corresponding reconstructed trajectories (darker colors). (D) Dhand-nose (blue) and Dhand-hand (red) traces from the recording in (A-C) compared to L (cyan) and D (magenta) traces calculated from the reconstructed hand trajectories. (E) Cross-validated reconstruction accuracy (cvR2) for each coordinate and region (purple: forelimb M1, teal: forelimb S1, green: lateral M1). Error bars are mean ± s.d over mice. Symbols are averages over experiments for individual mice. (F) GLM coefficients normalized to the range [−1,1] for the Z-coordinate GLMs averaged over neurons, experiments, hands, and mice for forelimb M1 (purple), forelimb S1 (teal), and lateral M1 (green). Thin lines are individual mice, thick lines are mean over mice. (G) Mouse-average cvR2 for the Z-coordinate (averaged over ipsi- and contralateral hands) when varying the size and central lag of the window used for reconstruction. Solid grey lines indicate reconstruction accuracy expected by chance, dashed lines are mean ± 2 s.d. over shuffles of the chance reconstruction accuracy. (H) Lag giving the highest hand-average Z-coordinate cvR2 for the 420 ms window as a function of region. Symbols are averages over experiments for individual mice, error bars are mean ± s.d. over mice. See also Figure S6 and Table S1

Similar articles

Cited by

References

    1. Sobinov AR, and Bensmaia SJ (2021) The neural mechanisms of manual dexterity. Nat. Rev. Neurosci. 22, 741–757. - PMC - PubMed
    1. Warriner CL, Fageiry SK, Carmona LM, and Miri A (2020) Towards cell and subtype resolved functional organization: mouse as a model for the cortical control of movement. Neuroscience. 450, 151–160. - PMC - PubMed
    1. Bollu T, Ito BS, Whitehead SC, Kardon B, Redd J, Liu MH, and Goldberg JH (2021) Cortex-dependent corrections as the tongue reaches for and misses targets. Nature. 594, 82–87. - PMC - PubMed
    1. Svoboda K, and Li N (2018) Neural mechanisms of movement planning: motor cortex and beyond. Curr. Opin. Neurobiol. 49, 33–41. - PubMed
    1. Miller CT, Gire D, Hoke K, Huk AC, Kelley D, Leopold DA, Smear MC, Theunissen F, Yartsev M, and Niell CM (2022) Natural behavior is the language of the brain. Curr. Biol. 32, R482–R493. - PMC - PubMed

Publication types

LinkOut - more resources