. 2022 Dec:66:101612.
doi: 10.1016/j.molmet.2022.101612. Epub 2022 Oct 13.

Lcn2 mediates adipocyte-muscle-tumor communication and hypothermia in pancreatic cancer cachexia

Affiliations

Lcn2 mediates adipocyte-muscle-tumor communication and hypothermia in pancreatic cancer cachexia

Mengistu Lemecha et al. Mol Metab. 2022 Dec.

Abstract

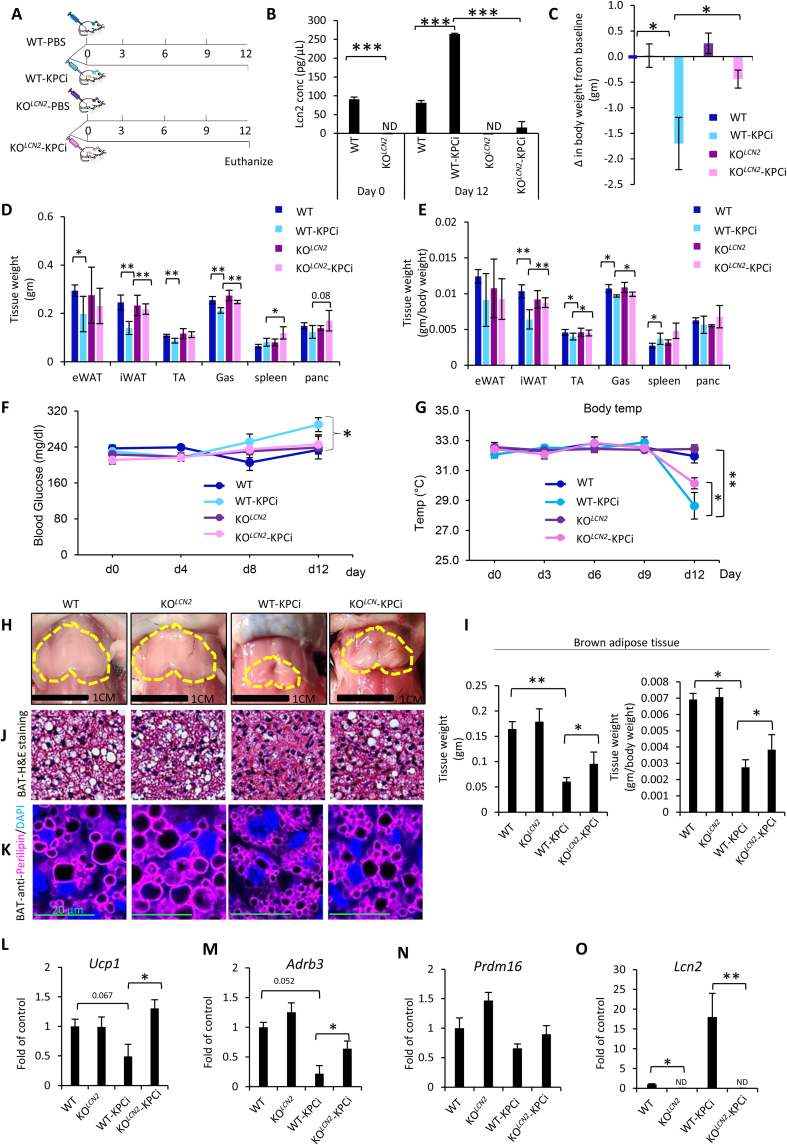
Objective: Adipose tissue is the largest endocrine organ. When activated by cancer cells, adipocytes secrete adipocytokines and release fatty acids, which are then transferred to cancer cells and used for structural and biochemical support. How this metabolic symbiosis between cancer cells and adipocytes affects skeletal muscle and thermogenesis during cancer cachexia is unknown. Cancer cachexia is a multiorgan syndrome and how the communication between tissues is established has yet to be determined. We investigated adipose tissue secretory factors and explored their role in crosstalk of adipocytes, muscle, and tumor during pancreatic cancer cachexia.

Methods: We used a pancreatic cancer cachexia mouse model generated by syngenic implantation of pancreatic ductal adenocarcinoma (PDAC) cells (KPC) intraperitoneally into C57BL/6 mice and Lcn2-knockout mice. For in vitro studies, adipocytes (3T3-L1 and primary adipocytes), cachectic cancer cells (Panc0203), non-cachectic cancer cells (Du145 cells), and skeletal muscle cells (C2C12 myoblasts) were used.

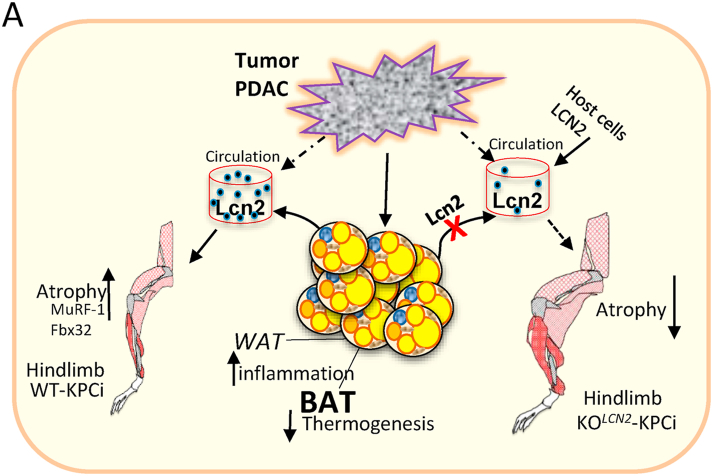
Results: To identify molecules involved in the crosstalk of adipose tissue with muscle and tumors, we treated 3T3-L1 adipocytes with conditioned medium (CM) from cancer cells. Upon screening the secretomes from PDAC-induced adipocytes, several adipocytokines were identified, including lipocalin 2 (Lcn2). We investigated Lcn2 as a potential mediator of cachexia induced by adipocytes in response to PDAC. During tumor progression, mice exhibited a decline in body weight gain, which was accompanied by loss of adipose and muscle tissues. Tumor-harboring mice developed drastic hypothermia because of a dramatic loss of fat in brown adipose tissue (BAT) and suppression of the thermogenesis pathway. We inhibited Lcn2 with an anti-Lcn2 antibody neutralization or genomic ablation in mice. Lcn2 deficiency significantly improved body temperature in tumor-bearing mice, which was supported by the increased expression of Ucp1 and β3-adrenergic receptor in BAT. In addition, Lcn2 inhibition abrogated the loss of fat and muscle in tumor-bearing mice. In contrast to tumor-bearing WT mice, the corresponding Lcn2-knockout mice showed reduced ATGL expression in iWAT and decreased the expression of muscle atrophy molecular markers MuRF-1 and Fbx32.

Conclusions: This study showed that Lcn2 is causally involved in the dysregulation of adipose tissue-muscle-tumor crosstalk during pancreatic cancer cachexia. Therapeutic targets that suppress Lcn2 may minimize the progression of cachexia.

Keywords: BAT; Cachexia; Hypothermia; Lcn2; PDAC; Thermogenesis.


Figures

Figure 1
Figure 1
PDAC-induced adipocyte secretome inhibited myotube development and Lcn2 was identified as a potential mediator. A) Oil Red O staining of 3T3-L1 adipocytes treated with conditioned media (CM) from cancer cells or non-conditioned media (NCM). B) Immunofluorescent staining of perilipin (green) and Mitotracker (red) in 3T3-L1 adipocytes treated with CM from cancer cells or NCM. C) Upper panel: glycerol and free fatty acid (FFA) levels were measured in CM collected from adipocytes pre-treated with cancer cell CM, n = 4. Lower panel: qRT-PCR of HSL and ATGL in adipocytes, n = 5. D) Immunoblot analysis of MyHC protein in C2C12 myotubes after treatment with cancer cell–induced adipogenic media, n = 3. E) Immunofluorescent staining of MyHC (green) and nuclei (DAPI, blue) in C2C12 cells treated with cancer adipogenic media, n = 4. Fusion index was calculated as the ratio of the nuclei number in myocytes with two or more nuclei versus the total number of nuclei, n = 4. F) Protein array detected with immunoblotting from conditioned media of matured 3T3-L1 adipocytes treated with the indicated cancer cell CM. G) Densitometric analysis of selected proteins detected in (K). H) Immunoblot analysis of Lcn2 in 3T3-L1 matured adipocytes treated with media from cancer cells or non-conditioned media from day 6–12 during adipocyte differentiation, n = 3. I) Lcn2 levels in cancer cell–induced adipogenic media measured by ELISA, n = 4. J) qRT-PCR of Lcn2 in adipocytes, n = 5. K) Immunoblot analysis of MyHC in C2C12 cells treated with 1 μg/ml of recombinant Lcn2 or DMSO (control) from day 4–6 after induction, n = 4. L) Immunofluorescent staining for MyHC (green) and nuclei (DAPI, blue) in C2C12 myotubes treated with 1 μg/ml of recombinant Lcn2 or DMSO (control) from day 4–6 after induction. ∗p < 0.05, ∗∗p < 0.01.
Figure 2
Figure 2
PDAC induced fat loss trigged hypothermia: A) Study design. KPC tumor cells (5 × 106) were implanted intraperitoneally into C57BL/6 mice (KPCi group, n = 5). The control mice were administered with PBS solution (PBS group, n = 5). B) Plasma levels of Lcn2 at day 8 post KPC tumor cell implantation or PBS administration in mice were measured by ELISA, n = 5. C) Immunoblot analysis of Lcn2 in inguinal white adipose tissue (iWAT) from control and KPCi mice, n = 5. D) Surface body temperature was measured using infrared camera at indicated time points, n = 5. E) Representative images of gross appearance of brown adipose tissue (BAT) (indicated by yellow dots) from control and KPCi mice are shown. F, G) Representative images of hematoxylin and eosin (H&E) (F) and Oil Red O (G) staining of BAT from day 4 and day 10 post KPC tumor cell implantation or PBS administration are shown. H, I) FACS analyses were used to identify immune cell populations gated out of total live cells isolated from BAT tissue on day 4 and day 10 post tumor cell implantation of indicated groups of mice. CD45+ cells (H) and CD11b + F4/80+ cells (I), n = 5. J) Top-ranking pathways identified by PGSEA on Kyoto Encyclopedia of Genes and Genomes (KEGG) using IDEPv905. Significance cutoff of FDR <0.5 and differential pathways are listed according to adjusted p value. Pathways activated are shown in red, and suppressed pathways are shown in blue. K) Volcano plot of gene expression of up-regulated (purple) and down-regulated (green) genes in BAT from KPCi mice compared with WT mice using ShinyGo 0.76. Selected genes are indicated. L) Heatmap of relative expression of selected thermogenesis-associated genes from the RNA-seq dataset. Genes with p < 0.05 are displayed. M) Thermogenesis pathway from KEGG. Genes significantly downregulated (red) and upregulated (green) in BAT during tumor progression compared with BAT of control group. ∗p < 0.05, ∗∗p < 0.01. For J–M: n = 2, gene set downregulated in KPCi mice by > 1.5 fold, FDR<0.05, p < 0.05 compared with WT mice used for analysis.
Figure 3
Figure 3
Reduced fat wasting and augmented normothermia in BAT of Lcn2 deficient KPCi mice. A) Strategy for establishing the four experimental groups: KOLCN2-KPCi (Lcn2 knockout mice implanted with KPC tumor cells), WT-KPCi (wild-type mice implanted with KPC tumor cells), KOLCN2 (Lcn2 KO mice administered with PBS) and WT (wild-type mice administered with PBS). B) Plasma Lcn2 levels were analyzed by ELISA at day 0 and day 12 post PBS or KPC cell inoculation in mice. C) Change in body weight from the baseline (day 0 to day 12). D, E) Tissue weight (D) and tissue weight normalized by total body weight (E). F) Non-fasting blood glucose was measured at 10 am on the indicated days. G) Surface body temperature was measured at the indicated time points. H) Representative image of BAT (indicated by yellow dotted line). I) BAT weight in the indicated groups. J) Hematoxylin and eosin staining of BAT (white, lipid droplet; purple, nuclei; red, cytoplasm and extracellular matrix). K) Immunofluorescent staining of perilipin (purple; original red color changed to purple for clarity) and nuclei (DAPI, blue) in BAT. L–O) qRT-PCR of Ucp-1, Adrb3, Prdm16 and Lcn2 in BAT. n = 5. A–I, n = 5. ∗p < 0.05, ∗∗p < 0.01, ∗∗∗p < 0.001.
Figure 4
Figure 4
Adipose tissue inflammation was reduced in Lcn2-deficient pancreatic cancer mice. A) Immunoblot analysis of Lcn2 protein in inguinal adipose tissues from WT and Lcn2-KO mice. Lysates from inguinal white adipose tissue (iWAT) of WT-KPCi mice used as positive control, n = 5. B) Immunoblot analysis of Lcn2 in iWAT from WT and Lcn2-KO mice inoculated with KPC cells, n = 5. C) Representative image of iWAT, n = 5. D) Hematoxylin and eosin staining of iWAT, n = 3. E, F) Immunoblot analysis of ATGL (adipose triglyceride lipase) protein in inguinal adipose tissues, n = 5. G) Trichrome stained images of iWAT, n = 3. H, I) FACS analyses to identify immune cell populations gated out of total live cells isolated from iWAT tissue of indicated groups of mice. CD45+ cells (H) and CD4+ cells (I), n = 5. Representative images are shown, n = 5. J, K) Rate of oxygen consumption measured during light and dark cycle using the Promethion metabolic cage system (J) and quantitative analysis (K), n = 4–5. L, M) Rate of energy expenditure measured during light and dark cycle using the Promethion metabolic cage system (L) and quantitative analysis (M), n = 4–5. N) Total food consumption measured hourly for individually housed animals using Promethion metabolic cage system, n = 5. O) Total distance in cage measured hourly for individually housed animals using Promethion metabolic cage system, n = 5. ∗p < 0.05.
Figure 5
Figure 5
Reduced muscle wasting in Lcn2 deficient KCPi mice and cancer induced adipogenic media from Lcn2-KO adipocytes improves myotube formation. A) Trichrome stained images of tibialis anterior; representative images are shown. B) Representatives immunoblot analysis of skeletal muscle atrophy markers MuRF-1. C, D) Representative immunoblot analysis and densitometry of band intensity of skeletal muscle atrophy molecular markers MuRF-1 and Fbx32 proteins. n = 5. E) Immunohistochemistry (IHC) staining of tibialis anterior (TA) tissues against MyHC3 protein. For the nuclei, hematoxylin counterstain was performed. Representative figures are showed, n = 3. The staining control with or without primary antibody (anti-MyHC3) is shown at right panel. F) Stromal vascular (SV) fractions isolation from iWAT of WT and Lcn2-KO mice differentiated to matured white adipocytes. The adipocytes were treated with conditioned media from cancer cells. Subsequently, cancer adipogenic media was collected and used to treat C2C12 cells. G) Lcn2 levels in cancer induced adipogenic media from primary matured white adipocytes measured by ELISA. n = 4. H, I) Immunoblot (G) and densitometric (H) analysis of MyHC in C2C12 after treatment with cancer cells induced adipogenic media. n = 3. ∗p < 0.05, ∗∗p < 0.01.
Figure 6
Figure 6
Schematic drawing showing role of Lcn2 as a communication factor between adipose tissue with muscle and tumor.

References

    1. Lim S., Brown J.L., Washington T.A., Greene N.P. Development and progression of cancer cachexia: perspectives from bench to bedside. Sports Medicine and Health Science. 2020;2:177–185. - PMC - PubMed
    1. Tan C.R., Yaffee P.M., Jamil L.H., Lo S.K., Nissen N., Pandol S.J., et al. Pancreatic cancer cachexia: a review of mechanisms and therapeutics. Frontiers in Physiology. 2014;5:88. - PMC - PubMed
    1. Society A.C. American Cancer Society; 2022. Cancer facts & figures.
    1. Henriques F., Lopes M.A., Franco F.O., Knobl P., Santos K.B., Bueno L.L., et al. Toll-like receptor-4 disruption suppresses adipose tissue remodeling and increases survival in cancer cachexia syndrome. Scientific Reports. 2018;8:1–14. - PMC - PubMed
    1. Castillo-Armengol J., Fajas L., Lopez-Mejia I.C. Inter-organ communication: a gatekeeper for metabolic health. EMBO Reports. 2019;20 - PMC - PubMed

Publication types