. 2022 Oct 15;13(1):6103.
doi: 10.1038/s41467-022-33899-1.

Discriminating cross-reactivity in polyclonal IgG1 responses against SARS-CoV-2 variants of concern

Affiliations

Discriminating cross-reactivity in polyclonal IgG1 responses against SARS-CoV-2 variants of concern

Danique M H van Rijswijck et al. Nat Commun. .

Abstract

Existing assays to measure antibody cross-reactivity against different SARS-CoV-2 spike (S) protein variants lack the discriminatory power to provide insights at the level of individual clones. Using a mass spectrometry-based approach we are able to monitor individual donors' IgG1 clonal responses following a SARS-CoV-2 infection. We monitor the plasma clonal IgG1 profiles of 8 donors who had experienced an infection by either the wild type Wuhan Hu-1 virus or one of 3 VOCs (Alpha, Beta and Gamma). In these donors we chart the full plasma IgG1 repertoires as well as the IgG1 repertoires targeting the SARS-CoV-2 spike protein trimer VOC antigens. The plasma of each donor contains numerous anti-spike IgG1 antibodies, accounting for <0.1% up to almost 10% of all IgG1s. Some of these antibodies are VOC-specific whereas others do recognize multiple or even all VOCs. We show that in these polyclonal responses, each clone exhibits a distinct cross-reactivity and also distinct virus neutralization capacity. These observations support the need for a more personalized look at the antibody clonal responses to infectious diseases.


Conflict of interest statement

The authors declare no competing interests.

Figures

Fig. 1
Fig. 1. Donor Characteristics and Monitoring of individual full IgG1 and S-protein antigen directed IgG1 profiles.
a Overview of the donors, who had experienced an infection by the named VOCs. VOCs are color-coded with WT (gray), Alpha (orange), Beta (purple) and Gamma (green). The table also lists age, gender, and disease state including Fever, respiratory symptoms and intensive care unit (ICU) admission following the World Health Care (WHO) severity score. b For each plasma sample taken we analyzed the full plasma IgG1 antibody repertoire as well as the antigen directed IgG1 clones to the four different VOCs S-proteins. The experimental approach involves the IgG capturing from full plasma as well as the S-protein specific immune-capturing. Fab fragments of the IgG1s were generated by enzymatic cleavage and subsequently subjected to intact-protein LC–MS analysis. Clonal repertoires could be profiled qualitatively, whereby each identified clone can be characterized by its unique accurate mass (in Dalton) and retention time (RT in minutes). By spiking in known quantities of two recombinant mAbs each plasma IgG1 clone could be quantified. The different S-protein specific Fab repertoires and the full plasma Fab repertoires were then compared, both intra- and inter-donors.
Fig. 2
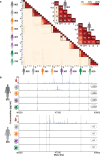
Fig. 2. S-protein specific IgG1 repertoires are polyclonal and unique per donor, whereas within a donor substantial cross-reactivity is observed when enriching with the four VOC S-protein trimers.
a Quantitative overlap of IgG1 repertoires illustrated by a heatmap, depicting the degree of overlap between all detected IgG1 repertoires, i.e. from all donors, extracted from either the full plasma (FP) or after pulldowns with each of the VOCs S-protein of all variants studied (WT, Alpha, Beta and Gamma). The quantitative overlap of Fab molecules, based on intensity per each unique identifier RT#mass, was quantified and shown as a percentage as indicated by the color bar. The zoomed-in panels for donors 002 and 003 highlight the substantial overlap for donor 003 between the S-protein specific Fab profiles, and the full plasma IgG1 profile Source data are provided as a Source Data file. b Deconvoluted full Fab mass profiles as obtained for donor 002 and 003, from the S-protein specific Fab profiles (WT, Alpha, Beta and Gamma) and the full plasma Fab profile (top). Each peak represents a unique Fab at its detected mass and plasma concentration. The number on the right of each S-protein specific profile, indicated the y-axis multiplier compared to the y-axis used for the full plasma profiles.Supplementary Figs. 3–5 depict the full Fab mass profiles of all the other six donors.
Fig. 3
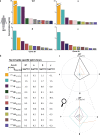
Fig. 3. Within a single donor, antigen directed IgG1 clones display distinctive cross-reactivity versus the VOCs S-protein variants.
a Quantitative comparison of the ten most abundant IgG1 Fab clones, affinity-enriched from the plasma of donor 003, with each of the four S-protein variants. Each bar represents one of the 10 most abundant clones with the height indicating the concentration in µg/ml, using the same colors for the clones corresponding to panel (b). Each clone that was not in the total top 10 but was in the top 10 for that specific VOC is colored grey. Source data are provided as a Source Data file. b Top 10 most abundant clones with their relative abundance after the pull-down with each of the four VOCs S-protein variants. The colored bars in a and the dotted lines in the radar plot in c are corresponding to the clones in the table B. c Radar plot with on each edge the data for one of the S-protein variants. These plots depict the difference in binding of specific clones against the VOCs S-protein variants. The thick solid black line representing the sum of all enriched IgG1 clones. Color coding is identical as used in a and b. Source data are provided as a Source Data file. The magnifying glass used in this figure was retrieved via Wikipedia.
Fig. 4
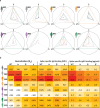
Fig. 4. Properties of antigen specific IgG(1) repertoires and correlation between different binding and neutralization assays.
a each radar plot represents data for a single donor, with axis representing data of the neutralization assay (N), S-protein specific total IgG binding assay (B) and S-protein specific IgG1 binding by LC–MS (MS). Per axis and per donor, the values are normalized based on the highest value observed for that axis for that specific donor, giving a value 1 with the other values displaying the proportion of this highest base value, i.e. in between 0 and 1. Each line represents data against a particular S-protein (shown with the color of the line) for that specific donor. b Values behind the radar plots in A. ID50 determined in the neutralization assays (left), and amount of S-protein specific IgG binding observed by the fluorescence assay (middle) and the LC–MS based clonal profiling (right). In the latter assay S-protein specific binding is calculated by summing up the concentrations of the S-protein specific clones for that specific donor. The colors represent the high (in red) to low (light yellow) values determined per individual assay.

References

    1. Harvey WT, et al. SARS-CoV-2 variants, spike mutations and immune escape. Nat. Rev. Microbiol. 2021;19:409–424. doi: 10.1038/s41579-021-00573-0. - DOI - PMC - PubMed
    1. WHO. Tracking SARS-CoV-2 variants, https://www.who.int/en/activities/tracking-SARS-CoV-2-variants/ (2022).
    1. Lazarevic, I., Pravica, V., Miljanovic, D. & Cupic, M. Immune evasion of SARS-CoV-2 emerging variants: what have we learnt so far? Viruses13, 10.3390/v13071192 (2021). - PMC - PubMed
    1. Caniels TG, et al. Emerging SARS-CoV-2 variants of concern evade humoral immune responses from infection and vaccination. Sci. Adv. 2021;7:eabj5365. doi: 10.1126/sciadv.abj5365. - DOI - PMC - PubMed
    1. Cox RJ, Brokstad KA. Not just antibodies: B cells and T cells mediate immunity to COVID-19. Nat. Rev. Immunol. 2020;20:581–582. doi: 10.1038/s41577-020-00436-4. - DOI - PMC - PubMed

Publication types

Supplementary concepts