. 2022 Oct 15;13(1):6102.
doi: 10.1038/s41467-022-33885-7.

Genetic variants associated with psychiatric disorders are enriched at epigenetically active sites in lymphoid cells

Affiliations

Genetic variants associated with psychiatric disorders are enriched at epigenetically active sites in lymphoid cells

Mary-Ellen Lynall et al. Nat Commun. .

Abstract

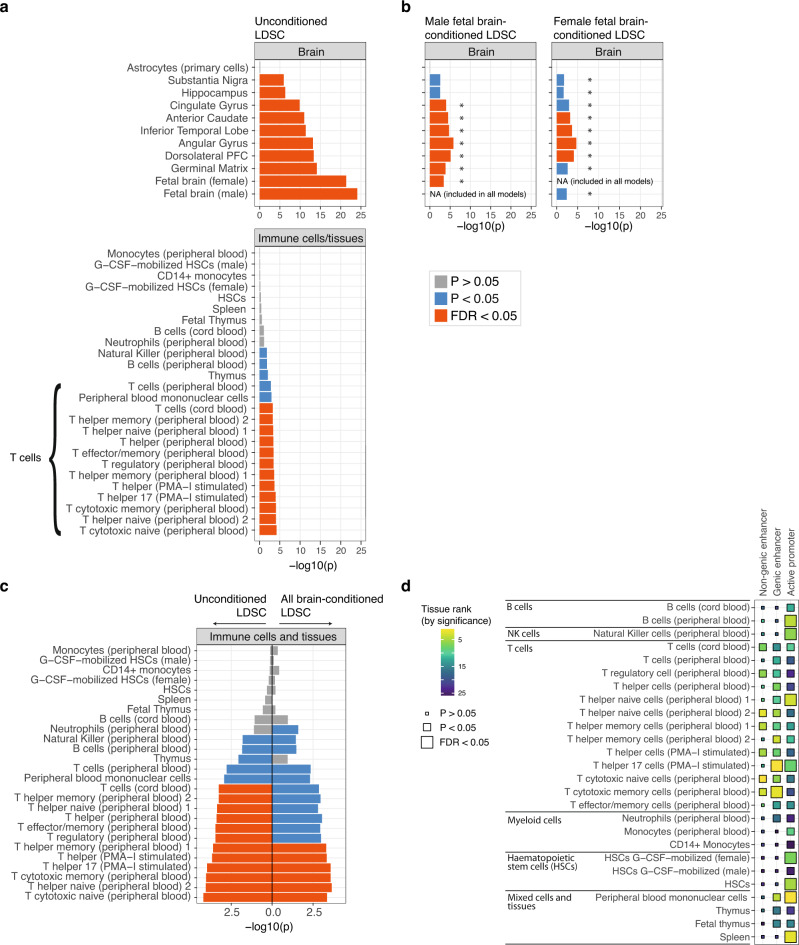
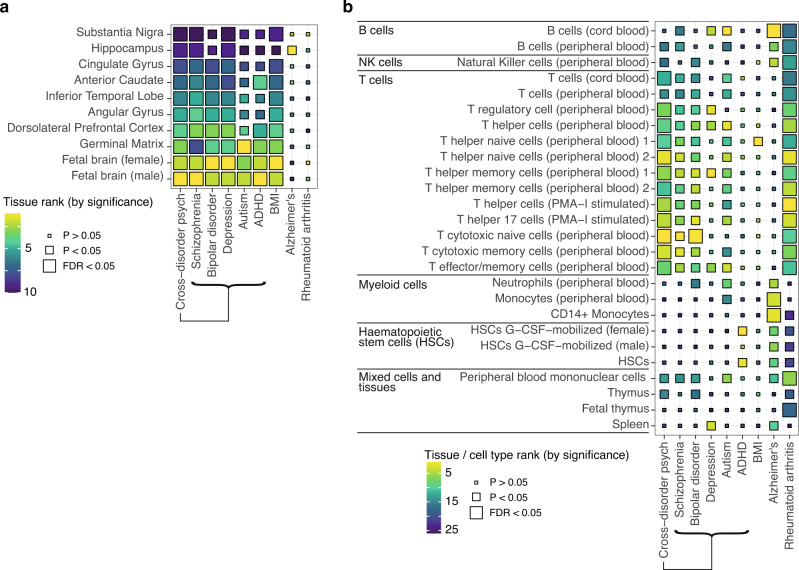
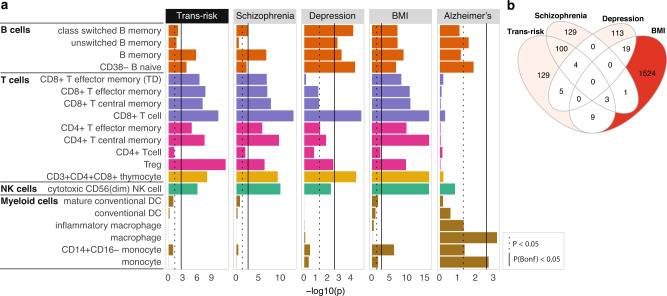
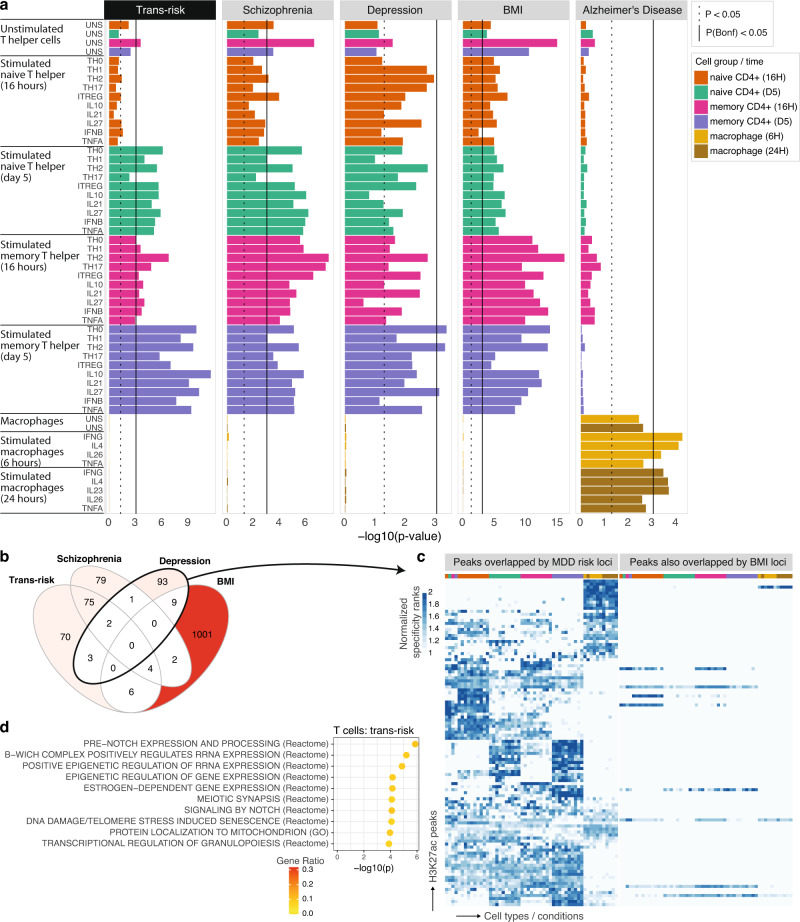
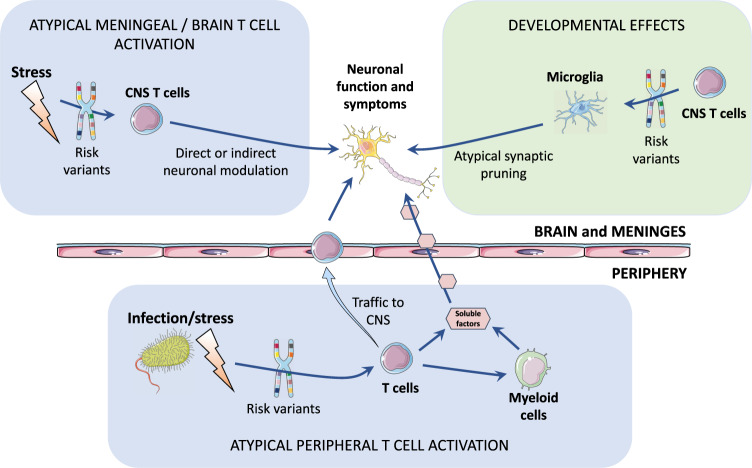
Multiple psychiatric disorders have been associated with abnormalities in both the innate and adaptive immune systems. The role of these abnormalities in pathogenesis, and whether they are driven by psychiatric risk variants, remains unclear. We test for enrichment of GWAS variants associated with multiple psychiatric disorders (cross-disorder or trans-diagnostic risk), or 5 specific disorders (cis-diagnostic risk), in regulatory elements in immune cells. We use three independent epigenetic datasets representing multiple organ systems and immune cell subsets. Trans-diagnostic and cis-diagnostic risk variants (for schizophrenia and depression) are enriched at epigenetically active sites in brain tissues and in lymphoid cells, especially stimulated CD4+ T cells. There is no evidence for enrichment of either trans-risk or cis-risk variants for schizophrenia or depression in myeloid cells. This suggests a possible model where environmental stimuli activate T cells to unmask the effects of psychiatric risk variants, contributing to the pathogenesis of mental health disorders.


Conflict of interest statement

E.T.B. serves as a member of the scientific advisory boards of Sosei Heptares, Boehringer Ingelheim, Monument Therapeutics, and the Brain & Behavior Research Foundation, and as a consultant for GlaxoSmithKline; he is also a Deputy Editor of Biological Psychiatry. J.G. and R.P. are paid for their editorial work for Complex Psychiatry journal. M.B.S. in the past 3 years has received consulting income from Actelion, Acadia Pharmaceuticals, Aptinyx, atai Life Sciences, Boehringer Ingelheim, Bionomics, BioXcel Therapeutics, Clexio, EmpowerPharm, Engrail Therapeutics, GW Pharmaceuticals, Janssen, Jazz Pharmaceuticals, and Roche/Genentech. M.B.S. has stock options in Oxeia Biopharmaceuticals and EpiVario. He is paid for his editorial work on Depression and Anxiety (Editor-in-Chief), Biological Psychiatry (Deputy Editor), and UpToDate (Co-Editor-in-Chief for Psychiatry). He has also received research support from NIH, Department of Veterans Affairs, and the Department of Defense. He is on the scientific advisory board for the Brain and Behavior Research Foundation and the Anxiety and Depression Association of America. The remaining authors declare no competing interests.

Figures

Fig. 1
Fig. 1. Trans-diagnostic risk enrichment at epigenetically active sites in brain tissue and, independently, in T cells.
a Enrichment of trans-diagnostic risk at active regulatory elements in 88 tissues from the Roadmap epigenomics consortium. P-values estimated by stratified linkage disequilibrium score regression (LDSC) analysis (see Methods) were used to test the null hypotheses (one-sided tests) that risk variants were not co-located with epigenetically activated sites more frequently than expected by chance, using the false discovery rate (FDR < 0.05; orange) to correct for multiple tests across N = 88 tissues. Tissues with nominally significant enrichment (P < 0.05, blue) are also shown for context. For results in all other tissues see Supplementary Fig. 1. b Validation of brain-conditioned LDSC modelling. As expected, when the LDSC model for enrichment of adult brain tissues was conditioned on the active regulatory annotations for fetal brain tissue (male and female), there was significant reduction in enrichment across all adult brain tissues (asterisks indicate one-sided two-sample Z-tests with P < 0.05). c Brain-conditioned analysis of enrichment of trans-diagnostic risk variants at active regulatory annotations in immune tissues. Probability of enrichment (log P scale) was estimated by both unconditioned LDSC modelling (left panel of bar chart; same data as in Fig. 1a but on a different x-axis range of log probabilities); and brain-conditioned LDSC modelling (right panel of bar chart), one-sided tests. Conditioning enrichment of immune cells on active regulatory annotations in all brain tissues did not significantly reduce enrichment for any immune tissue (all two-sample Z-tests had P > 0.05); but some T cell subsets were no longer significantly enriched at FDR = 5%; see Supplementary Fig. 2 for comparable results in all other tissues. d Enrichment of trans-diagnostic risk in enhancers, genic enhancers and active promoters in all immune subsets (LDSC, one-sided tests). Large tiles show results significant at FDR < 0.05, to correct for the 78 annotations tested; mid-sized tiles show results significant at P < 0.05. Tile fill indicates the P-value rank within each annotation across cell types. There was enrichment of trans-risk at both enhancers and promoters in multiple adaptive immune cell subsets. See Supplementary Data 1 for full statistics. PFC prefrontal cortex, HSC hematopoietic stem cell, PMA-I phorbol-myristate-acetate and ionomycin.
Fig. 2
Fig. 2. Cis-diagnostic risk enrichment at epigenetically activated sites in adult and fetal brain tissue and immune cells for 8 specific disorders.
For each of 5 mental health disorders (schizophrenia, bipolar disorder, major depressive disorder [MDD], autism, and attention deficit-hyperactivity disorder [ADHD]), and for each of 3 positive control disorders (obesity, Alzheimer’s disease and rheumatoid arthritis), enrichment of cis-risk variants at active regulatory elements (active promoters and enhancers) was tested in a 10 brain tissue samples (3 fetal) and b 26 immune cell subsets and tissues (3 fetal). P-values are shown for the results of stratified linkage disequilibrium score regression (s-LDSC) analysis (one-sided tests), taking the union of active elements in a given cell type as the annotation of interest. Tile size, from large to small, indicates P-value thresholds from FDR < 0.05 (significant after Benjamini-Hochberg correction for all 88 tissues tested, including those not shown here), through P < 0.05 (nominally significant), to P ≥ 0.05 (not significant). Tile fill indicates the P-value rank within each disorder across all cells/tissues to facilitate comparisons across results from differently-powered genetic association studies. See Supplementary Fig. 3 and Supplementary Data 1 for full statistics. HSC hematopoietic stem cell, PMA-I phorbol-myristate-acetate and ionomycin, ADHD attention deficit hyperactivity disorder, BMI body mass index.
Fig. 3
Fig. 3. Trans- and cis-diagnostic risk variant enrichment at histone-acetylated marks on adult immune cells in the BLUEPRINT dataset.
a Bar plots show enrichment of genetic risk for each disorder at active promoters/enhancers (H3K27ac marks) in unstimulated, sorted immune cells. CHEERS was used to detect enrichment of risk loci at cell-type specific H3K27ac peaks (see Methods). P-values are reported from a discrete uniform distribution (one-sided tests). The dotted black line marks the nominal significance threshold, P < 0.05; the solid black line marks the Bonferroni-corrected significance threshold, PBonf < 0.05. Note differing x-axis scales. See Supplementary Fig. 5A for ADHD and bipolar disorder results (non-significant after Bonferroni correction). b Venn diagram shows counts of variant-peak overlaps shared between disorders and unique to each disorder (each peak is only counted once even if overlapping multiple variants). For an upset plot of peak overlaps across all disorders, see Supplementary Fig. 5B. TD terminally differentiated, NK natural killer, BMI body mass index.
Fig. 4
Fig. 4. Trans- and cis-risk variant enrichment at histone-acetylated marks on experimentally stimulated immune cells in the Soskic immune stimulation dataset.
a Bar plots show enrichment of genetic risk for each condition at active promoters/enhancers (H3K27ac marks) in sorted and unstimulated or ex vivo stimulated immune cell subsets: macrophages, naïve CD4+ (helper) T cells and memory CD4+ T cells, assayed at both early and late timepoints after stimulation with one of several different cytokine cocktails promoting differentiation to different T cell states (as shown in row labels). CHEERS was used to detect enrichment of risk loci at cell-type specific H3K27ac peaks (see Methods). P-values are reported from a discrete uniform distribution (one-sided tests). The dotted black line marks the nominal significance threshold, P < 0.05; the solid black line marks the Bonferroni-corrected significance threshold, PBonferroni < 0.05. Note differing x-axis scales. Results for other disorders are shown in Supplementary Fig. 6. b Venn diagrams show counts of variant-peak overlaps shared between disorders and unique to each disorder. For an upset plot of peak overlaps across all disorders, see Supplementary Fig. 7b. c All Soskic immune stimulation dataset peaks overlapped by risk variants for major depressive disorder (MDD). Each row corresponds to an H3K27ac peak overlapping a risk variant for MDD; each column corresponds to a different cytokine-induced cell state, ordered and colored as in Fig. 4a (see legend). The blue fill shade represents how specific each peak is to each cell state (specificity rank of each peak normalized to the mean specificity rank of all peaks). Only 9 of the 108 MDD-associated H3K27ac immune peaks also overlap BMI risk variants. d For peaks which were both highly specific to T cells (including both unstimulated and stimulated cells) and overlapped by trans-risk variants, nearest genes were identified and tested for enrichment for curated biological pathways (GO and Reactome) using a one-sided hypergeometric test. Only the 10 most significant pathways are shown (all FDR < 0.05). Fill colour indicates gene ratio (number of test genes in the pathway/total number of test genes). See Supplementary Fig. 8 for results for cis-diagnostic risks. GO gene ontology, BMI body mass index.
Fig. 5
Fig. 5. Schematic of potential pathogenic pathways by which genetic risk variants enriched at epigenetically active sites in T cells could lead to neuronal changes and ultimately psychiatric disorders.
Infection or other stressors may induce activation of regulatory elements in T cells that are enriched for trans- or cis-diagnostic risk variants, potentially leading to atypical T cell phenotypes and downstream activation of innate immune (myeloid) cells in the periphery and CNS (light blue boxes). Atypical activation of T cells resident in the CNS, or trafficking into the meninges and brain from the periphery, could adversely affect neuronal function. Developmentally (light green box), T cells are known to control microglial pruning of neuronal synapses as part of normative brain developmental programs in childhood and adolescence. Atypical T cells, in genetically-at-risk individuals, could promote atypical microglial pruning of synapses, contributing to the formation of disconnected networks or circuits in the adult brain. CNS, central nervous system. Parts of the figure were drawn by using pictures from Servier Medical Art. Servier Medical Art by Servier is licensed under a Creative Commons Attribution 3.0 Unported License (https://creativecommons.org/licenses/by/3.0/).

Similar articles

Cited by

References

    1. Cross-Disorder Group of the Psychiatric Genomics Consortium. Genomic relationships, novel loci, and pleiotropic mechanisms across eight psychiatric disorders. Cell. 2019;179:1469–1482 e1411. doi: 10.1016/j.cell.2019.11.020. - DOI - PMC - PubMed
    1. Peyrot WJ, Price AL. Identifying loci with different allele frequencies among cases of eight psychiatric disorders using CC-GWAS. Nat. Genet. 2021;53:445–454. doi: 10.1038/s41588-021-00787-1. - DOI - PMC - PubMed
    1. Lee PH, Feng YA, Smoller JW. Pleiotropy and cross-disorder genetics among psychiatric disorders. Biol. Psychiatry. 2021;89:20–31. doi: 10.1016/j.biopsych.2020.09.026. - DOI - PMC - PubMed
    1. Kessler RC, Davis CG, Kendler KS. Childhood adversity and adult psychiatric disorder in the US National Comorbidity Survey. Psychol. Med. 1997;27:1101–1119. doi: 10.1017/S0033291797005588. - DOI - PubMed
    1. Schmitt A, Malchow B, Hasan A, Falkai P. The impact of environmental factors in severe psychiatric disorders. Front Neurosci. 2014;8:19. doi: 10.3389/fnins.2014.00019. - DOI - PMC - PubMed

Publication types