. 2022 Oct 15;13(10):871.
doi: 10.1038/s41419-022-05314-6.

Loss of CASZ1 tumor suppressor linked to oncogenic subversion of neuroblastoma core regulatory circuitry

Affiliations

Loss of CASZ1 tumor suppressor linked to oncogenic subversion of neuroblastoma core regulatory circuitry

Zhihui Liu et al. Cell Death Dis. .

Abstract

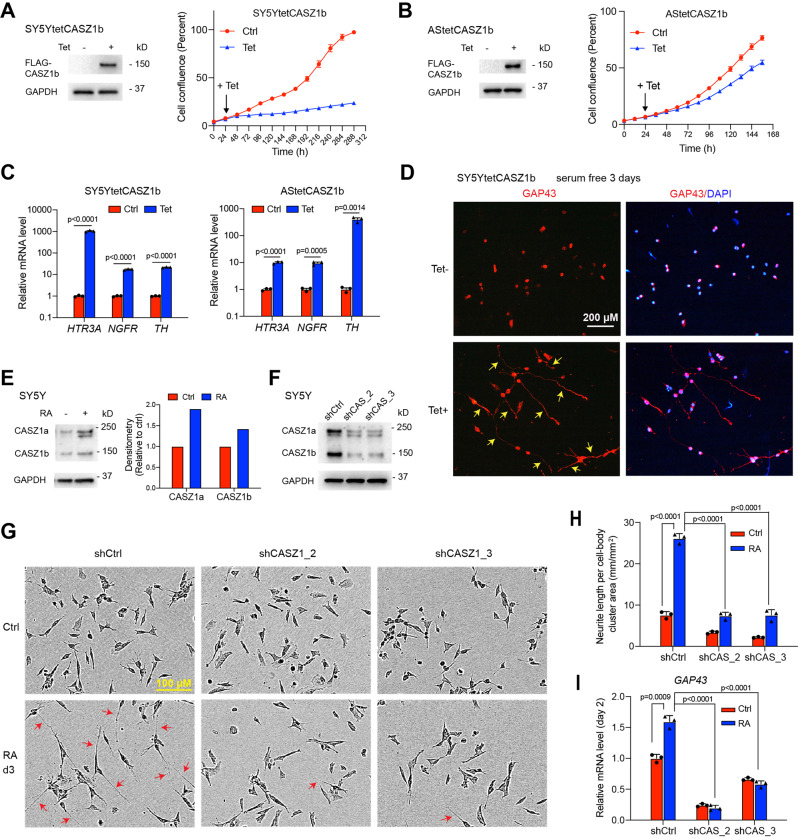
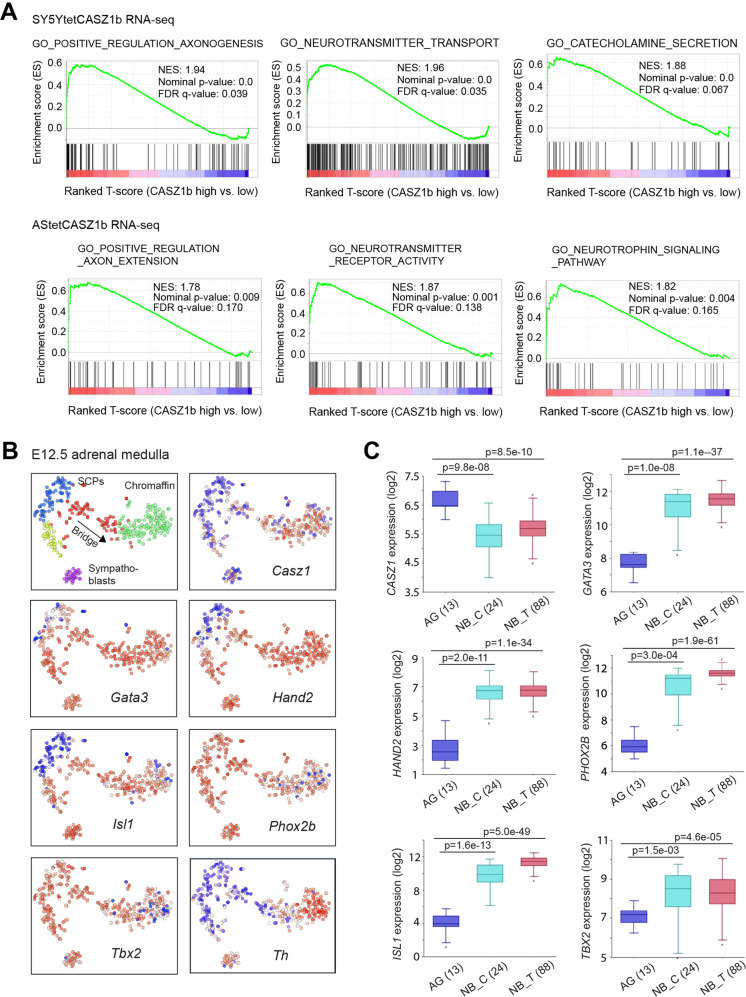
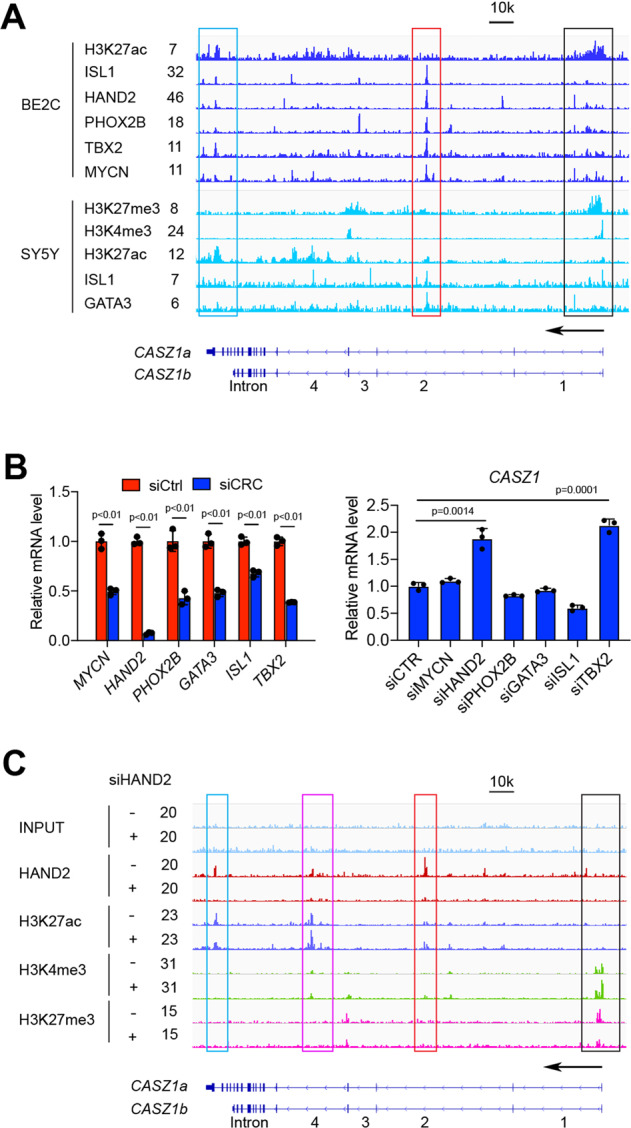
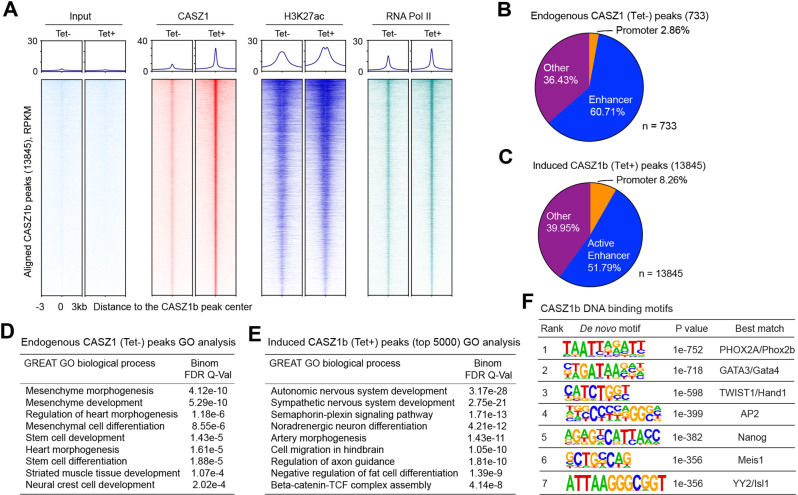
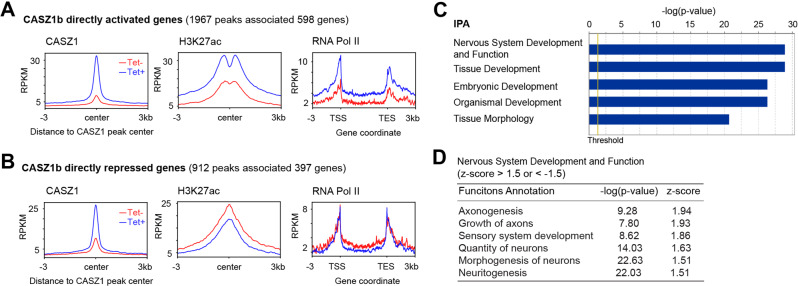
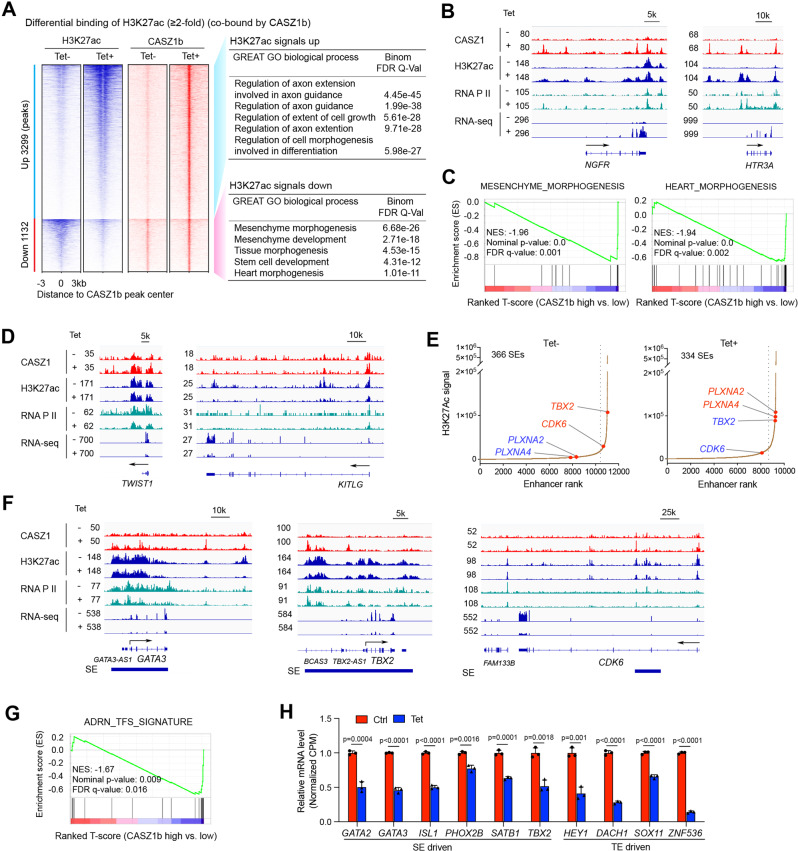
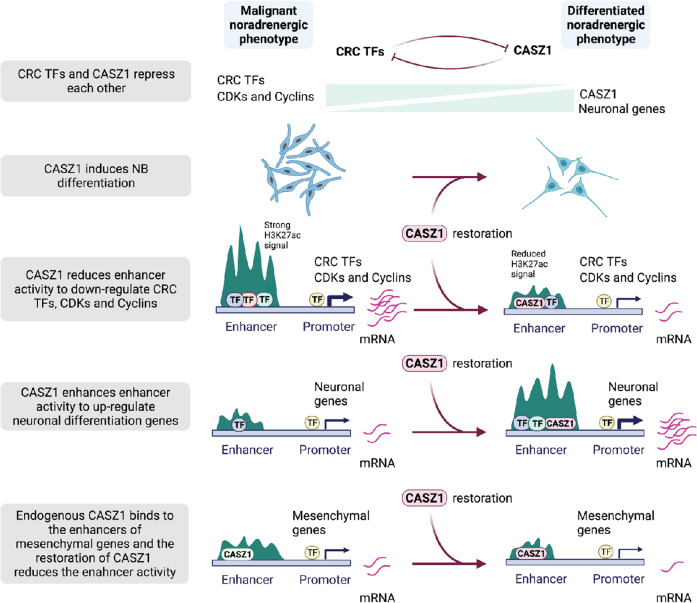
The neural crest lineage regulatory transcription factors (TFs) form a core regulatory circuitry (CRC) in neuroblastoma (NB) to specify a noradrenergic tumor phenotype. Oncogenic subversion of CRC TFs is well documented, but the role of loss of tumor suppressors plays remains unclear. Zinc-finger TF CASZ1 is a chromosome 1p36 (chr1p36) tumor suppressor. Single-cell RNA sequencing data analyses indicate that CASZ1 is highly expressed in developing chromaffin cells coincident with an expression of NB CRC TFs. In NB tumor cells, the CASZ1 tumor suppressor is silenced while CRC components are highly expressed. We find the NB CRC component HAND2 directly represses CASZ1 expression. ChIP-seq and transcriptomic analyses reveal that restoration of CASZ1 upregulates noradrenergic neuronal genes and represses expression of CRC components by remodeling enhancer activity. Our study identifies that the restored CASZ1 forms a negative feedback regulatory circuit with the established NB CRC to induce noradrenergic neuronal differentiation of NB.


Conflict of interest statement

The authors declare no competing interests.

Figures

Fig. 1
Fig. 1. CASZ1b is essential for neuronal differentiation.
A Western blot shows induction of CASZ1b expression in CASZ1b stably transfected SY5Y cells after tetracycline (Tet) treatment for 24 h (left panel); CASZ1b represses SY5Y cell proliferation is observed based on IncuCyte cell confluence assay. B Western blot shows induction of CASZ1b expression in CASZ1b stably transfected AS cells after Tet treatment for 24 h (left panel); CASZ1b represses AS cell proliferation is observed based on IncuCyte cell confluence assay (right panel). C Realtime PCR results show that the restoration of CASZ1b upregulates mRNA levels of neuronal genes in both SY5Y cells (48 h Tet treatment) and AS cells (72 h Tet treatment). D CASZ1b induces neurite extension (yellow arrow) in SY5Y cells shown by GAP43 staining. E Western blot shows that CASZ1 is upregulated when SY5Y cells are treated with retinoic acid for 3 days. The densitometry graph on the right is generated by normalizing GAPDH signal and the signal in Ctrl is set as 1. F Western blot shows that the knockdown of CASZ1 decreases expression of both CASZ1a and CASZ1b isoforms. G The knockdown of CASZ1 attenuates RA-induced neurite extension (red arrow) shown by the phase-contrast imaging. H The silencing of CASZ1 results in a significant decrease in RA-induced neurite length as evaluated by using the IncuCyte neurite-length assay. I Realtime PCR results show that the siRNA knockdown of CASZ1 for 2 days attenuates RA induced increases in GAP43 mRNA levels. Data represent mean ± SEM, n = 3 biological replicates. Two-sided Student’s t test was used to calculate statistical difference.
Fig. 2
Fig. 2. CASZ1 regulates sympathoadrenal lineage genes.
A GSEA shows a positive enrichment of axonogenesis, neurotransmitter transport, and catecholamine secretion genes upon induction of CASZ1b in SY5Y cells (top panel). GSEA shows a positive enrichment of axonogenesis, neurotransmitter transport and neurotrophin signaling genes when CASZ1b is overexpressed in AS cells. B The single-cell mRNA expression pattern of Casz1, CRC components, and sympathoadrenal lineage-determination and mark genes in E12.5 mouse embryonic adrenal medulla were analyzed using the Harvard interactive interface tools (http://pklab.med.harvard.edu/cgi-bin/R/rook/nc.SS2_16_250-2/index.html; scRNAseq results are available at Gene Expression Omnibus, GSE99933). Note: left-upper corner image: SCPs, schwann precursor cells (blue); SCPs transition to an intermediate cell population called Bridge cells (red) as they transition to chromaffin cells (green) or Bridge cells (yellow) as they transition to Sympathoblasts (purple). The relative expression magnitude: blue low, white intermediate, and red high. C The mRNA levels of CASZ1 and CRC components in human normal adrenal gland (AG), neuroblastoma cell lines (NB_C) and neuroblastoma tumors (NB_T, Versteeg cohort) are analyzed using the R2:Genomics Analysis and Visualization platforms (gserver1.amc.nl/cgi-bin/r2/main.cgi). Data are presented as box and whisker plots with middle lines indicating medians and whiskers representing the 25th and 75th percentiles. The graph is generated using databases in the R2 platform.
Fig. 3
Fig. 3. CASZ1 is regulated by noradrenergic NB CRC components.
A Results of analysis of publicly available ChIP-seq data of the CRC components show that the CRC components bind to the CASZ1 gene locus, with a relatively stronger signal of CRC components within the 2nd intron (red box) but a lower signal of H3K27ac. Bivalent mark of H3K27me3 and H3K4me3 is observed at the CASZ1 gene promoter in SY5Y cells (black box). B Realtime PCR shows that the siRNA knockdown of MYCN and CRC compoents (left panel), and the loss of HAND2 or TBX2 results in a decrease of CASZ1 mRNA levels (right panel). C ChIP-seq results show that decreasing expression of HAND2 in IMR32 cells results in a decrease of HAND2 signal within CASZ1 gene locus, which is accompanied by an increase of H3K27ac signal within the 2nd and 3rd intron (red and pink boxes), as well as an increase of H3K4me3 signal and a decrease of H3K27me3 signal within the CASZ1 promoter.
Fig. 4
Fig. 4. Genome-wide mapping of CASZ1b binding sites.
A Heatmap shows the ranked CASZ1b binding peaks (13,845) and the aligned peaks of H3K27ac, RNA Pol II and input control at CASZ1b peak center before (−) and after (+) Tet treatment of SY5YtetCASZ1b cells. RPKM, reads per kilobase per million. B Endogenous CASZ1 peak distribution shows that CASZ1 mainly binds to active enhancers. C Induced CASZ1b peak distribution analysis shows that CASZ1b mainly binds to active enhancers. D GREAT GO biological process analysis indicates endogenous CASZ1 binding sites are associated with mesenchyme, heart and neural crest development. E GREAT GO biological process analysis shows that the CASZ1b binding sites are associated with sympathetic nervous system development and noradrenergic neuron differentiation. F Homer de novo motif scan of CASZ1b binding sites shows the enrichment of neural crest development associated TFs and NB noradrenergic CRC TFs binding motifs. RPKM: reads per kilobase per million mapped reads.
Fig. 5
Fig. 5. CASZ1b directly activates neuronal differentiation genes.
A Composite plots of the 598 upregulated genes before (Tet-) after (Tet+) induction of CASZ1b in SY5Y cells, which show increased CASZ1b signals (left panel) and H3K27ac signals (middle panel) at the CASZ1b peak center, as well as increased signals of RNA Pol II on the gene body (right panel). B Composite plots of the 397 genes directly downregulated by CASZ1, which show increased CASZ1b signals (left panel) and decreased signals of H3K27ac (middle panel) at the CASZ1b peak center, as well as decreased signals of RNA Pol II on the gene body (right panel). C Ingenuity pathway analysis (IPA) shows that CASZ1b directly regulated genes are involved in nervous system and tissue development. D IPA shows that CASZ1b directly regulated genes are enriched in the positive regulation of neuronal differentiation and axonogenesis.
Fig. 6
Fig. 6. CASZ1b represses NB CRC and mesenchymal signature genes and activates neuronal genes through affecting enhancer activity.
A Restoration of CASZ1b in SY5Y cells results an increase of H3K27ac signals (heatmap on the left) on genes that are associated with axonogenesis (GO analysis on the right) and a decrease of H3K27ac signals on genes (heatmap on the left panel) that are associated with mesenchyme development (GO analysis, right panel). B Signal tracks show the increase of CASZ1b, H3K27ac and RNA Pol II signals and RNA-seq signals on the neuronal genes NGFR and HTR3A after induction of CASZ1b (Tet+ vs. Tet−). C GSEA shows a negative enrichment of mesenchyme morphogenesis and heart morphogenesis genes upon induction of CASZ1b in SY5Y cells. D Signal tracks show the increase of CASZ1b signals, and decrease of H3K27ac, RNA Pol II and RNA-seq signals on the mesenchyme development regulators TWIST1 and KITLG after induction of CASZ1b (Tet+ vs. Tet−). E Restoration of CASZ1b in SY5Y cells re-organizes SEs. The histograms show an increase of H3K27ac signal on neuronal genes PLXNA2 and PLXNA4 and a decrease of H3K27ac signals on CRC component TBX2, as well as cell cycle progression regulator CDK6. F Signal tracks show that the restoration of CASZ1b in SY5Y cells results in a decrease of SE signals (H3K27ac), as well as RNA Pol II signals and RNA-seq reads on GATA3 and CDK6; G GSEA shows that the restoration of CASZ1b in SY5Y cells results in a significant negative enrichment of noradrenergic NB TFs coding genes. H The bar graph shows the negative regulation of noradrenergic NB TFs coding genes that either driven by SEs or typical enhancers (TEs) in SY5Y cells after restoration of CASZ1b based on the normalized RNA-seq reads (CPM: counts per million). Data represent mean ± SEM, n = 3 biological replicates. Two-sided Student’s t test was used to calculate statistical difference.
Fig. 7
Fig. 7. Schematic diagram of CASZ1 action.
Restoration of CASZ1 directly represses CRC TFs, suppresses cell cycle regulators, mesenchymal genes and activates neural differentiation genes through remodeling enhancers.

References

    1. Marshall GM, Carter DR, Cheung BB, Liu T, Mateos MK, Meyerowitz JG, et al. The prenatal origins of cancer. Nat Rev Cancer. 2014;14:277–89. doi: 10.1038/nrc3679. - DOI - PMC - PubMed
    1. Matthay KK, Maris JM, Schleiermacher G, Nakagawara A, Mackall CL, Diller L, et al. Neuroblastoma. Nat Rev Dis Prim. 2016;2:16078. doi: 10.1038/nrdp.2016.78. - DOI - PubMed
    1. Maris JM, Hogarty MD, Bagatell R, Cohn SL. Neuroblastoma. Lancet. 2007;369:2106–20. doi: 10.1016/S0140-6736(07)60983-0. - DOI - PubMed
    1. Irwin MS, Park JR. Neuroblastoma: paradigm for precision medicine. Pediatr Clin North Am. 2015;62:225–56. doi: 10.1016/j.pcl.2014.09.015. - DOI - PubMed
    1. Boeva V, Louis-Brennetot C, Peltier A, Durand S, Pierre-Eugene C, Raynal V, et al. Heterogeneity of neuroblastoma cell identity defined by transcriptional circuitries. Nat Genet. 2017;49:1408–13. doi: 10.1038/ng.3921. - DOI - PubMed

Publication types

MeSH terms