. 2022 Oct 15;13(10):872.
doi: 10.1038/s41419-022-05318-2.

The Cancermuts software package for the prioritization of missense cancer variants: a case study of AMBRA1 in melanoma

Affiliations

The Cancermuts software package for the prioritization of missense cancer variants: a case study of AMBRA1 in melanoma

Matteo Tiberti et al. Cell Death Dis. .

Abstract

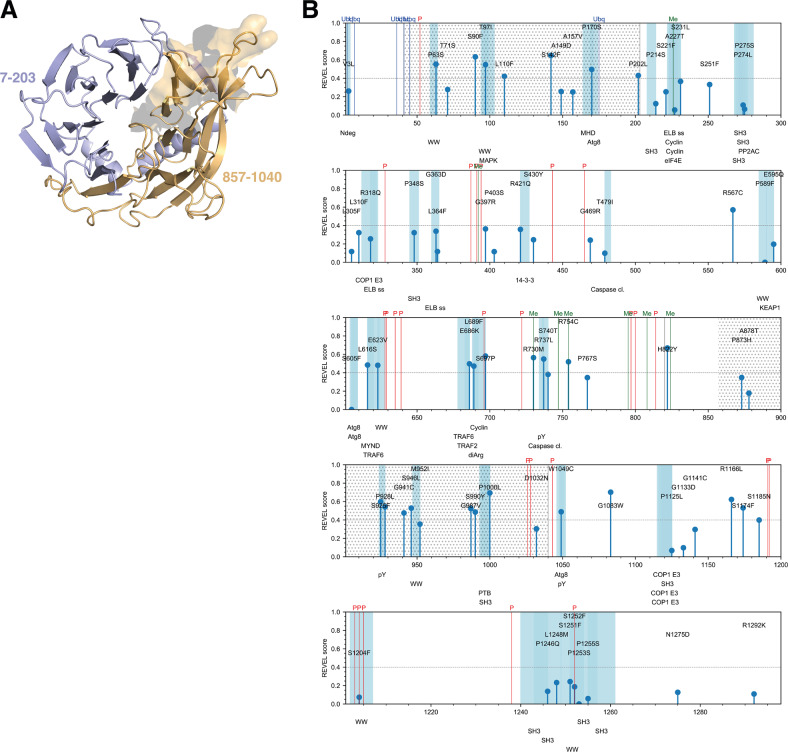
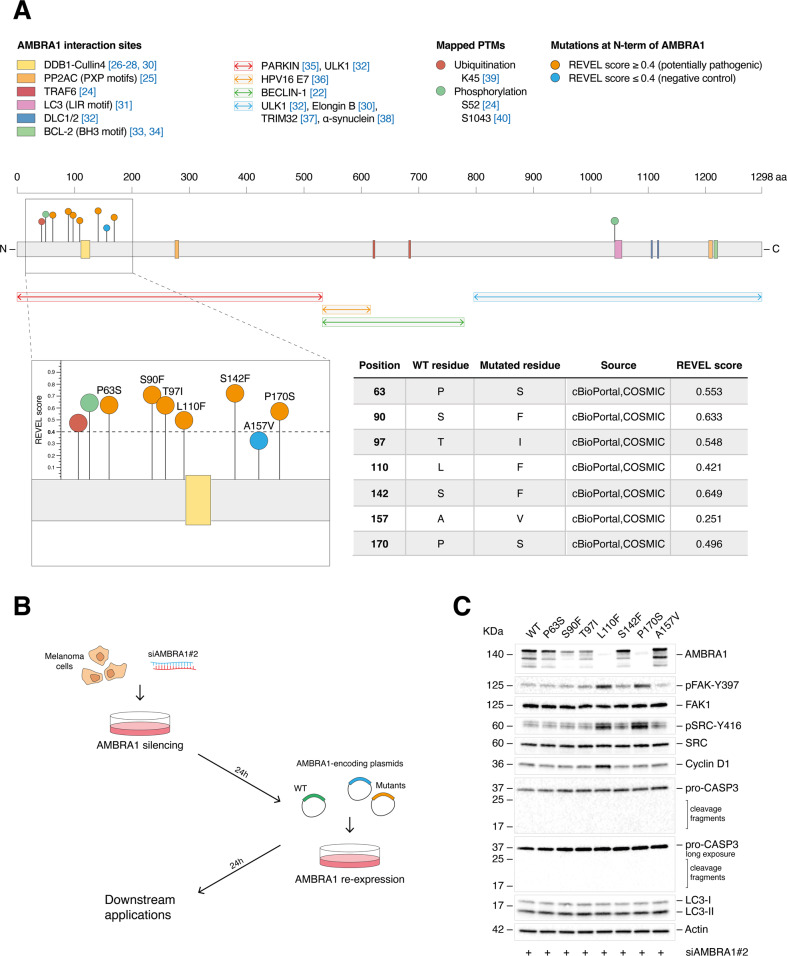
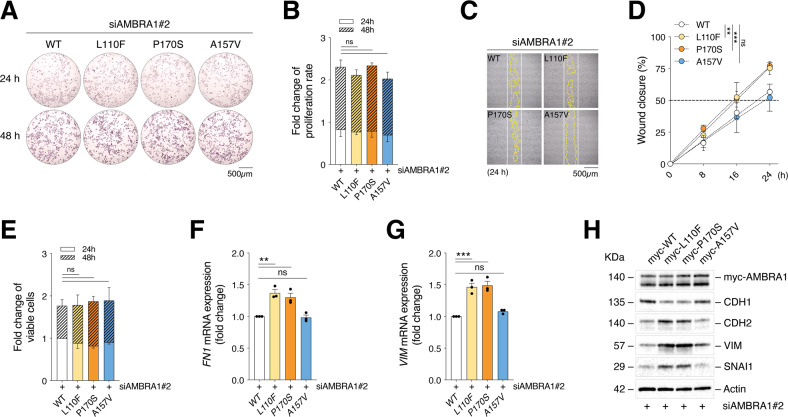
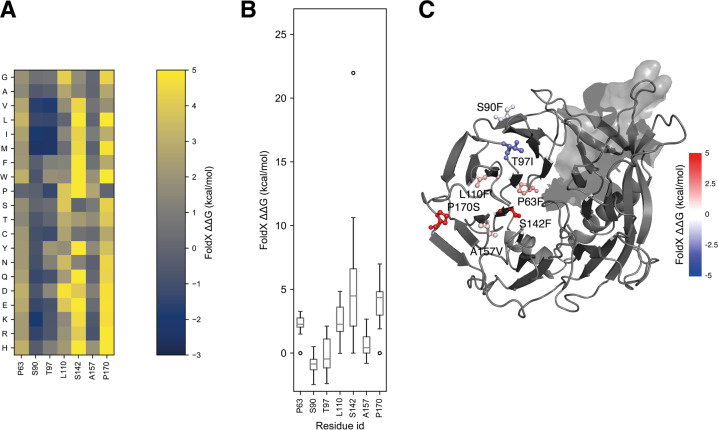
Cancer genomics and cancer mutation databases have made an available wealth of information about missense mutations found in cancer patient samples. Contextualizing by means of annotation and predicting the effect of amino acid change help identify which ones are more likely to have a pathogenic impact. Those can be validated by means of experimental approaches that assess the impact of protein mutations on the cellular functions or their tumorigenic potential. Here, we propose the integrative bioinformatic approach Cancermuts, implemented as a Python package. Cancermuts is able to gather known missense cancer mutations from databases such as cBioPortal and COSMIC, and annotate them with the pathogenicity score REVEL as well as information on their source. It is also able to add annotations about the protein context these mutations are found in, such as post-translational modification sites, structured/unstructured regions, presence of short linear motifs, and more. We applied Cancermuts to the intrinsically disordered protein AMBRA1, a key regulator of many cellular processes frequently deregulated in cancer. By these means, we classified mutations of AMBRA1 in melanoma, where AMBRA1 is highly mutated and displays a tumor-suppressive role. Next, based on REVEL score, position along the sequence, and their local context, we applied cellular and molecular approaches to validate the predicted pathogenicity of a subset of mutations in an in vitro melanoma model. By doing so, we have identified two AMBRA1 mutations which show enhanced tumorigenic potential and are worth further investigation, highlighting the usefulness of the tool. Cancermuts can be used on any protein targets starting from minimal information, and it is available at https://www.github.com/ELELAB/cancermuts as free software.


Conflict of interest statement

The authors declare no competing interests.

Figures

Fig. 1
Fig. 1. Schematic representation of the Cancermuts workflow.
The figure shows on the left the different layers of evidence that Cancermuts supports. The Uniprot main isoform sequence is the basis on which either per-position or per-sequence annotations are performed (post-translational modifications, structure definition, linear motifs) that can be provided by one of the sources and by manual user annotation. The sequence can also be annotated by downloading cancer-related mutations and relative metadata, including REVEL scores and gnomAD allele frequencies. Mutations can be supplied by manual annotation as well. Once the information has been collected, it can be summarized as a table (right) and as a plot (bottom right).
Fig. 2
Fig. 2. Predicted structured regions of AMBRA1 and identified cancer mutations.
A predicted structured regions of AMBRA1 including the β-propeller domain. The N-terminal and C-terminal regions of the model are shown in blue (7–203) and orange (857–1040), respectively. In the N-terminal region, we included in the model the helical structures (residues 7–41) that are upstream of the propeller domain since they were predicted with high confidence by AlphaFold2. The part of this structured region against which the AMBRA1 antibody for the C-terminal region we have used has been raised is also highlighted by showing its molecular surface (top right). B Melanoma-related mutations and corresponding annotations as collected by Cancermuts. Plots follow the main Uniprot sequence numbering; each mutation is annotated as a stem the height of which is proportional to the identified REVEL score (with 0 for those that could not be annotated). Blue shades and corresponding bottom labels refer to linear motifs as annotated by ELM. Post-translational modifications are shown as colored vertical lines. A gray dotted pattern was used to represent the predicted structured β-propeller domain of AMBRA1. Predicted SLIMs that do not overlap with mutations have been hidden from this plot for ease of visualization.
Fig. 3
Fig. 3. Analysis of the effect(s) of the point mutations of AMBRA1 on its functions.
A Schematic representation of AMBRA1 including interaction sites and PTMs identified experimentally. AMBRA1 mutations are also mapped and specified in the table to the right. B Schematic representation of the transfection strategy. C WB analysis of pFAK-Y397, FAK1, pSRC-Y416, SRC, Cyclin D1, pro-CASP3 (including cleaved fragments), and LC3 (-I and -II) in A375 melanoma cells re-expressing the P63S, S90F, T97I, L110F, S142F, and P170S AMBRA1 mutants. Re-expression of WT and A157V AMBRA1 was used as a reference and negative control, respectively. AMBRA1 and Actin were detected as transfection and loading control, respectively. Images are representative of n = 3 independent experiments.
Fig. 4
Fig. 4. Analysis of the role of L110F and P170S mutants on AMBRA1 stability.
A RT-qPCR analyses of AMBRA1 upon WT, L110F, P170S, and A157V re-expression. Data were normalized on L34 and expressed as fold change vs non-transfected cells (Ctrl, indicated by a dashed line) ± SEM (n = 3; ***p = 0.0002; ****p < 0.0001; one-way ANOVA). B 24 h after transfection of the constructs, A375 cells were treated with MG-132 (10 µM) or C CQ (40 µM) for 4 h and WB analyses for AMBRA1 and Actin performed. Ubiquitylated proteins (Ub) and LC3-II accumulation were detected as positive controls for the treatments. Images are representative of n = 4 independent experiments. D WB analyses of soluble and insoluble fractions upon mutant re-expression. AMBRA1 and Actin were detected (n = 3). A representative gel activation is also shown. E WB analyses of AMBRA1 upon WT, L110F, P170S, and A157V re-expression in A375 and F upon re-expression of AMBRA1-myc-tagged constructs using a panel of anti-AMBRA1 antibodies. In F, AMBRA1 has been revealed also using an anti-myc antibody. G A375 cells were re-expressed with AMBRA1-myc-tagged WT, L110F, P170S and A157V constructs and pFAK-Y397, FAK1, pSRC-Y416, SRC, Cyclin D1, and LC3 (-I and -II) detected by WB. AMBRA1 was detected using an anti-myc antibody. In EG Actin was revealed as loading control and images are representative of n = 3 independent experiments.
Fig. 5
Fig. 5. Analysis of the effect of L110F and P170S mutants on melanoma invasiveness.
A Representative Crystal Violet staining of WT-, L110F-, P170S- and A157V-expressing A375 cells after 24 and 48 h (n = 3). B Quantification of the staining shown in (A). Data are shown as fold change ± SD with respect to control sample (WT at 24 h) (n = 3; ns=not significant; two-way ANOVA). C Representative images (n = 3) of wound healing assay in mutant-expressing A375 cells at 24 h. White and yellow lines outline wound edge at T0 and at the time indicated. D Quantification of wound closure is shown as percentage ± SD vs T0 at the times indicated (n = 3; ns=not significant; **p = 0.0018; ***p = 0.0004; two-way ANOVA). E Cell viability of WT-, L110F-, P170S- and A157V-expressing A375 cells after 24 and 48 h is expressed as fold change ± SD with respect to control sample (WT at 24 h) (n = 3; ns=not significant; two-way ANOVA). F RT-qPCR analyses of EMT markers FN1 (n = 3; ns=not significant; **p = 0.0016 L110F vs WT; **p = 0.006 P170S vs WT; one-way ANOVA) and G VIM (n = 3; ns not significant; ***p = 0.0003 L110F vs WT; ***p = 0.0002 P170S vs WT; one-way ANOVA) upon WT, L110F, P170S and A157V re-expression. Data are expressed as fold change vs WT ± SEM. H A375 cells were re-expressed with AMBRA1-myc-tagged WT, L110F, P170S and A157V constructs and CDH1, CDH2, VIM and SNAI1 detected by WB. AMBRA1 was detected using an anti-myc antibody as transfection control whereas Actin as loading control. Images are representative of n = 3 independent experiments.
Fig. 6
Fig. 6. Predicted changes of folding free energy upon mutation for the mutations experimentally tested.
In these plots, positive values represent mutations predicted to be destabilizing the protein structure, while negative values represent mutations predicted to be stabilizing. A Heatmap with predicted changes of free energy for the whole mutational scans at the sites we tested experimentally. Values in the plot have been limited within the −3 to 5 kcal/mol range to avoid using a less effective color scale due to outliers. B Box plots representing the distribution of the same values plotted in (A). C Residues at mutation sites corresponding to mutations that have been experimentally tested are shown on the predicted protein structure as sticks, colored proportionally to the predicted free energy change of the respective mutations, as per the colorbar. Values here have been limited in the −5 to 5 kcal/mol for the same reasons as in (B) to obtain a symmetrical colormap around 0.

Similar articles

Cited by

References

    1. Grossman RL, Heath AP, Ferretti V, Varmus HE, Lowy DR, Kibbe WA, et al. Toward a shared vision for cancer genomic data. N. Engl J Med. 2016;375:1109–12. doi: 10.1056/NEJMp1607591. - DOI - PMC - PubMed
    1. Cancer Genome Atlas Research N. Weinstein JN, Collisson EA, Mills GB, Shaw KR, Ozenberger BA, et al. The Cancer Genome Atlas Pan-Cancer analysis project. Nat Genet. 2013;45:1113–20. doi: 10.1038/ng.2764. - DOI - PMC - PubMed
    1. Tate JG, Bamford S, Jubb HC, Sondka Z, Beare DM, Bindal N, et al. COSMIC: the catalogue of somatic mutations in cancer. Nucleic Acids Res. 2019;47:D941–7. doi: 10.1093/nar/gky1015. - DOI - PMC - PubMed
    1. Cerami E, Gao J, Dogrusoz U, Gross BE, Sumer SO, Aksoy BA, et al. The cBio cancer genomics portal: an open platform for exploring multidimensional cancer genomics data. Cancer Discov. 2012;2:401–4. doi: 10.1158/2159-8290.CD-12-0095. - DOI - PMC - PubMed
    1. Gao J, Aksoy BA, Dogrusoz U, Dresdner G, Gross B, Sumer SO, et al. Integrative analysis of complex cancer genomics and clinical profiles using the cBioPortal. Sci Signal. 2013;6:pl1. doi: 10.1126/scisignal.2004088. - DOI - PMC - PubMed

Publication types

Substances