. 2022 Oct 15;12(1):17318.
doi: 10.1038/s41598-022-21596-4.

Lateral confined growth of cells activates Lef1 dependent pathways to regulate cell-state transitions

Affiliations

Lateral confined growth of cells activates Lef1 dependent pathways to regulate cell-state transitions

Luezhen Yuan et al. Sci Rep. .

Abstract

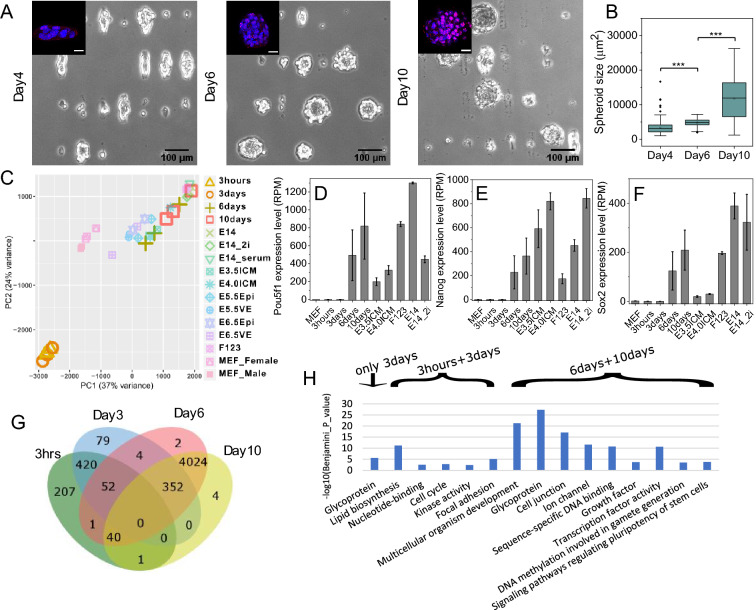
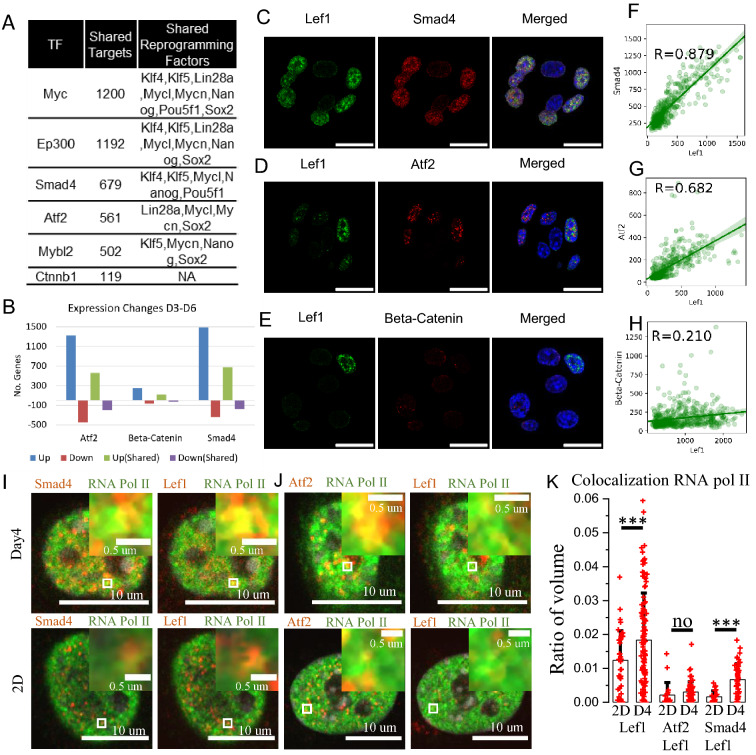
Long-term sustained mechano-chemical signals in tissue microenvironment regulate cell-state transitions. In recent work, we showed that laterally confined growth of fibroblasts induce dedifferentiation programs. However, the molecular mechanisms underlying such mechanically induced cell-state transitions are poorly understood. In this paper, we identify Lef1 as a critical somatic transcription factor for the mechanical regulation of de-differentiation pathways. Network optimization methods applied to time-lapse RNA-seq data identify Lef1 dependent signaling as potential regulators of such cell-state transitions. We show that Lef1 knockdown results in the down-regulation of fibroblast de-differentiation and that Lef1 directly interacts with the promoter regions of downstream reprogramming factors. We also evaluate the potential upstream activation pathways of Lef1, including the Smad4, Atf2, NFkB and Beta-catenin pathways, thereby identifying that Smad4 and Atf2 may be critical for Lef1 activation. Collectively, we describe an important mechanotransduction pathway, including Lef1, which upon activation, through progressive lateral cell confinement, results in fibroblast de-differentiation.


Conflict of interest statement

The authors declare no competing interests.

Figures

Figure 1
Figure 1
Global gene expression analysis of fibroblast cells grown under lateral confinement reveals their de-differentiation. (A) Differential interference contrast images of cells grown under lateral confinement for 4, 6, or 10 days. The insets show fluorescence images of Oct4 staining (in red) and nuclei (in blue). Inset scale bar is 20 um. (B) The box plot of spheroid sizes on days 4, 6, and 10 reveals that cells organize into a spheroid on the micropattern, which progressively increases in size. *** P < 0.001; n = 499, 440, 153 for day4, 6, and 10 respectively; two-sided Student’s t-test was used. (C) Principal Component Analysis of the gene expression profile shows change of cell states through de-differentiation. Genes involved in this analysis are differentially expressed with adjusted p value < 0.01 and |log2 Fold change|> 2. (D, E, F) Bar plot graphs of Oct4, Nanog, or Sox2 gene expression (RPM) over four time points during de-differentiation and how it compares to other cell types. MEF: mouse embryonic fibroblasts; E3.5ICM: E3.5 inner cell mass; E4.5ICM: E4.5 inner cell mass; F123: F123 cell line; E14: ES-E14TG2a cell line cultured in mouse ES cell media; E14_2i: ES-E14TG2a cell line cultured in 2i condition. Error bars represent ± SD. (G) Venn diagram showing the number of up-regulated genes over the four time points during de-differentiation. For example, there are 4024 genes up-regulated on day6 and day10 compared to the 3 h and day3 timepoints. Up-regulated genes have FDR (adjusted p value) < 0.01. (H) Functional annotation of genes that are overexpressed on the day3 timepoint (207 genes), at both 3 h and day3 timepoints (420 genes), and at both day6 and day10 timepoints (4024 genes).
Figure 2
Figure 2
Prize-Collecting Steiner Tree analysis highlights Lef1 dependent signaling during lateral confined growth of fibroblasts. (AD) The heatmaps show the expression changes of transcriptional regulators which were found by gene ontology annotation. They contain the terms GO:0,044,212 (transcription regulatory region DNA binding), GO:0,035,326 (enhancer binding), GO:0,008,301 (DNA binding and bending), and GO:0,001,047 (core promoter binding). The values refer to the log2 fold change compared to the 3 h sample. (E) Transcriptional regulatory network derived using the Prize-Collecting Steiner Tree method. Nodes in orange, red, and pink represent genes up-regulated on day3 and important intermediates that connect them. Nodes shown in red and pink are transcriptional regulators. Nodes in blue and turquoise represent genes up-regulated on day6. Within these, turquoise nodes represent reprogramming factors. (F, G) Enlarged pictures of (E) showing transcriptional regulators (in pink and Lef1 and its interactors with turquoise border) that can regulate the expression or bind to the gene loci of reprogramming factors (in turquoise). (H) Ranking of the transcriptional regulators (pink nodes in (E)).
Figure 3
Figure 3
Knockdown of Lef1 and time course studies of Lef1 and Oct4 show the critical role of Lef1 in fibroblast de-differentiation. (A, B) Bar plot graphs of Lef1 and Oct4 mRNA expression level over time, error bars represent ± SD. (C) The scatter plot of Lef1 and Oct4 nuclear fluorescence intensity. Each dot represents the average intensity for one nucleus. The Pearson correlation coefficient r is 0.64. (D) The fluorescence images of Lef1 (in red) and nucleus (in blue) for cells at day2, 4, 6, and 10. Scale bar is 20 um. (E) The box plot shows the quantification of average nuclear Lef1 intensity over time; n = 244, 279, and 673 respectively. (F) The fluorescence images of Oct4 (in red) and nucleus (in blue) for cells at day2, 4, 6, and 10. Scale bar is 20 um. (G) The box plot shows the quantification of average nuclear Oct4 intensity over time; n = 481, 1486, 1248 and 2472 respectively. (H) The fluorescence images of Oct4 (in magenta) and nucleus (in cyan) for control and Lef1 siRNA treated cells. Scale bar is 50 um. (I) Quantification of Oct4 nuclear intensity shows distinct distributions for control and Lef1 siRNA samples; *** P < 0.001; n = 2708 and 3171 respectively.
Figure 4
Figure 4
Lef1 binds to the gene loci of the reprogramming factors during the mechanically induced fibroblast de-differentiation. (A) The heatmap shows binding of Lef1 to the promoter regions of selected genes in Day4. Control cells grown on 2D culture are also shown. The unit is percentage of input. (B) Fold change of Lef1 promoter occupancy comparing Day4 sample to control sample. *P < 0.05. (C/D) The bar plot shows the increase of binding of Lef1 to Nanog and Oct4 promoter regions at 3 h, Day2 and Day4.
Figure 5
Figure 5
Lef1 activation is potentially regulated by Smad4 and Atf2 pathways. (A) Table of identified genes that could interact with Lef1, the number of shared targets with Lef1 and the shared reprogramming factors as targets. (B) Bar plot showing the number of genes up-regulated or down-regulated from day3 to day6. Up (Shared): shared targets with Lef1 that are up-regulated. Down (Shared): shared targets with Lef1 that are down-regulated. These targets are differentially expressed with adjusted p value < 0.01. (C, D, E) The staining of Lef1, Smad4, and Nucleus; Lef1, Atf2 and Nucleus; and Lef1, Beta-catenin and Nucleus in day4 sample. Scale bar is 20 um. (F, G, H) Scatter plots showing the averaged nuclear fluorescence intensity of Lef1 and Smad4; Lef1 and Atf2; and Lef1 and Beta-catenin along with linear fits and the corresponding Pearson correlation coefficients. Representative images of co-staining with Lef1/Smad4/RNA pol II (I), Lef1/Atf2/RNA pol II (J). The insets are the zoom of small white box regions from the respective images. (K) Barplot shows the change of colocalization from 2D culture conditions to D4 (Day4 sample). The unit is the ratio of colocalized volume and the nucleus volume. Each dot represents one nucleus. The first two bars are the colocalization of Lef1 and RNA pol II. The middle two bars are the colocalization of Lef1, Atf2 and RNA pol II. The last two bars are the colocalization of Lef1, Smad4 and RNA pol II.
Figure 6
Figure 6
Schematic representation of the molecular mechanism of laterally confined growth induced fibroblast de-differentiation.

References

    1. Kim DH, et al. Epithelial mesenchymal transition in embryonic development, tissue repair and cancer: A comprehensive overview. J Clin Med. 2017;7:1. doi: 10.3390/jcm7010001. - DOI - PMC - PubMed
    1. Przybyla L, Muncie JM, Weaver VM. Mechanical control of epithelial-to-mesenchymal transitions in development and cancer. Annu. Rev. Cell Dev. Biol. 2016;32:527–554. doi: 10.1146/annurev-cellbio-111315-125150. - DOI - PubMed
    1. Thiery JP, Acloque H, Huang RYJ, Nieto MA. Epithelial-mesenchymal transitions in development and disease. Cell. 2009;139:871–890. doi: 10.1016/j.cell.2009.11.007. - DOI - PubMed
    1. Takahashi K, Yamanaka S. Induction of pluripotent stem cells from mouse embryonic and adult fibroblast cultures by defined factors. Cell. 2006;126:663–676. doi: 10.1016/j.cell.2006.07.024. - DOI - PubMed
    1. Roy B, et al. Laterally confined growth of cells induces nuclear reprogramming in the absence of exogenous biochemical factors. Proc. Natl. Acad. Sci. U.S.A. 2018;115:E4741–E4750. doi: 10.1073/pnas.1714770115. - DOI - PMC - PubMed

Publication types

MeSH terms